
Abstract
Abstract
Word matches are widely used to compare genomic sequences. Complete genome alignment methods often rely on the use of matches as anchors for building their alignments, and various alignment-free approaches that characterize similarities between large sequences are based on word matches. Among matches that are retrieved from the comparison of two genomic sequences, a part of them may correspond to spurious matches (SMs), which are matches obtained by chance rather than by homologous relationships. The number of SMs depends on the minimal match length (ℓ) that has to be set in the algorithm used to retrieve them. Indeed, if ℓ is too small, a lot of matches are recovered but most of them are SMs. Conversely, if ℓ is too large, fewer matches are retrieved but many smaller significant matches are certainly ignored. To date, the choice of ℓ mostly depends on empirical threshold values rather than robust statistical methods. To overcome this problem, we propose a statistical approach based on the use of a mixture model of geometric distributions to characterize the distribution of the length of matches obtained from the comparison of two genomic sequences.
1. Introduction
There are two different approaches to compare long DNA sequences such as complete genomes. The first approach is the calculation of a complete alignment based on the principle of anchor alignment (Delcher et al., 1999; Devillers et al., 2010, 2011). Briefly, it is derived into two steps: (1) all the extremely conserved regions between the compared sequences are retrieved; and (2) these regions are sorted, and a part of them are selected to anchor sequences together. Anchored regions form the backbone that may correspond to the common ancestral sequence of the compared genomes; the rest are considered as specific regions (Chiapello et al., 2005). The second approach is more global. It consists in computing a score evaluating either a distance or the similarities between the compared sequences. These approaches are called “alignment-free methods” and are based on various theoretical foundations (Vinga and Almeida, 2003).
The critical step in the two above approaches is the detection of highly conserved regions between the compared genomes. There are two ways to retrieve these regions. The first one consists in performing local alignments, and the second one consists in identifying word matches (WMs). WMs correspond to exactly conserved sub-sequences shared by all the compared sequences. While local alignments have been intensively studied, few efforts have been provided regarding the use of WMs in comparative genomics.
Basically, there are two approaches to using WMs in comparative genomics. The first approach is to retrieve all the matches of a given length, the k-word matches (Forêt et al., 2009), where k is the length of the matches. k-WMs are essentially used in alignment-free methods such as for the D2 statistic (Forêt et al., 2009). The second approach consists in retrieving the maximal exact matches (MEMs), which are WMs that cannot be extended either from their left nor from their right. MEMs are widely used as anchor points in complete genome alignment (Höhl et al., 2002) as well as in alignment-free methods (Deloger et al., 2009). It is noteworthy that, in comparative genomics, most of the studies that use WMs are based on the detection of MEMs rather than k-words. Indeed, it has been shown that k-word approaches often suffer from serious shortcomings to treat long genomic sequences (Reinert et al., 2009). However, a few recent studies have proposed k-word methods dedicated to the comparison of complete genomes (Guyon et al., 2009; Sims et al., 2009).
Computation of k-WMs and MEMs has been well studied (Lippert et al., 2005; Ohlebusch and Kurtz, 2008), and various efficient algorithms to retrieve them are available (Delcher et al., 2002; Khan et al., 2009). They only require one essential parameter that is the minimal length (ℓ) of the matches to retrieve. For the k-WM approaches, ℓ directly corresponds to k, and for the methods using MEMs, ℓ is the length of the shortest MEMs retrieved.
Selecting a suitable value for ℓ is a challenging task. Indeed, when retrieving WMs, two kinds of matches are found: (1) the significant matches that are related to the homologous relationship of the compared sequences; and (2) the spurious matches that are obtained only by chance. The shorter the retrieved WMs, the higher the number of spurious matches. Thus, the challenge is that ℓ has to be high enough to avoid spurious matches (Guyon and Guénoche, 2008) but not too high to discard significant matches. Figure 1 exemplifies this problem of providing the number and the type of the MEMs retrieved between two short sequences for different values of ℓ.
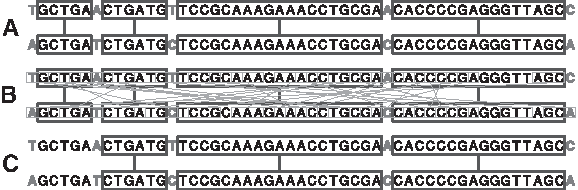
Retrieving MEMs between two DNA sequences: impact of the choice of the minimal length ℓ.
Until now, approaches aiming at choosing a reliable value for ℓ mostly relied on empirical analyses such as in Chiapello et al., (2005, 2008) and Wen et al., (2005). There are a few studies that propose statistical methods to solve this issue. For example, Reinert and Waterman (2006), inspired by the pioneering work of Karlin and Ost (1985), used a mixed Poisson approximation to analyze the length of the longest match in random sequences. They showed that, with their model, the probability for a spurious match to be longer than 22 nucleotides was very low. Guyon and Guénoche (2008) used a Poisson approximation to evaluate the expected number of MUMs (MEMs that are observed only once in the compared genomes) between random DNA sequences. They showed that the probability for a MUM to be longer than 22 nucleotides between two random sequences of about 2 Mb was almost null. By using a Bernoulli model and a Monte Carlo method, Lippert et al. (2005) showed that a threshold of 35 nucleotides was reliable to avoid spurious matches. However, most of these studies only investigated random sequences and did not test whether or not their thresholds were reliable on real DNA sequences. In addition, only a few of them consider the characteristics of the compared sequences such as their length, their nucleotide composition, or their relative divergence, although intuitively, one expects that the optimal value for ℓ should depend on these characteristics.
In this context, we developed a statistical approach based on the use of a mixture model of geometric distributions to characterize the distribution of the lengths of MEMs retrieved when comparing two genomes. In this article, after a brief presentation of the method, we show how our model can be used to find an optimal value for ℓ (ℓopt). The strengths and weaknesses of our method are then discussed through examples drawn from simulated and real genomic sequences.
2. Method
2.1. MEM lengths and geometric distribution
When comparing sequences, two kinds of MEMs are retrieved: the significant and the spurious MEMs. In this subsection, we show how it is possible to consider that the lengths of these two types of MEMs present a geometric distribution. Briefly, a geometric distribution can be defined as follows. Let's consider a sequential experiment in which independent Bernoulli trials with a probability of success p are repeated. We define the random variable X that corresponds to the number of repeats before the first success of a Bernoulli trial. The probability that X = k, i.e., k Bernoulli trials that fail followed by one success, is given by:
for
2.1.1. Significant MEMs
Significant MEMs correspond to the MEMs obtained from the homologous relationship of the compared sequences. If we consider two aligned homologous sequences, the length of a MEM is given by the number of identical nucleotides between two point-mutations (Fig. 1A). Let pmut be the probability of a point-mutation. Here, we assume that point-mutations are independent and identically distributed (i.i.d.) in the sequences. We define the random variable Lsign as the length of significant MEMs; it has a geometric distribution with parameter pmut. From equation (1), the probability that a significant MEM has a length k is given by:
Literally, a MEM of length ℓ corresponds to ℓ failures (probability: (1 –pmut) ℓ ) followed by one success (probability: pmut).
2.1.2. Spurious MEMs
Spurious MEMs randomly occur between the compared sequences. Let us consider random positions in the genomes. The length of a spurious MEM starting at these positions is given by the number of nucleotides that match before the first mismatch. Let pmis be the probability of a mismatch between random positions in the compared sequences, and let the random variable Lspur be defined as the length of spurious MEMs; it has a geometric distribution with parameter pmis. From equation (1), the probability that a spurious MEM has a length ℓ is given by:
2.2. Mixture model
To model the length L of the MEMs retrieved between two genomic sequences, we propose the following K-component geometric mixture distribution:
where
and
2.3. EM algorithm
An Expectation-Maximization (EM) algorithm (Dempster et al., 1977) was used to estimate the parameters Ψ of the mixture model. EM algorithms are iterative optimization methods that estimate unknown parameters in statistical models. A comprehensive and detailed presentation of EM algorithms is available in Mclachlan and Krishnan (1997). Briefly, let knowing the value of and
2.4. Selecting the number of components K
The selection of the number of components in the mixture model approaches is a critical task that requires a statistic evaluation (Mclachlan and Krishnan, 1997). This question has been intensively investigated, and different solutions based on various statistical approaches have been proposed (Leroux, 1992; Green, 1995; Solka et al., 1998). In the domain of mixture modeling, the Bayesian Information Criterion (BIC) (Schwarz, 1978) is probably the most used statistical tool to face this task. It is defined as follow:
where
2.5. Software tools and implementation
The EM algorithm was implemented in C and run under the statistical environment R (version 2.11.1). The source code is available upon request. We used the MUMmer tool (version 3) (Kurtz et al., 2004) to retrieve the MEMs. MUMmer is rooted on a suffix tree algorithm and is widely used to retrieve maximal matches between sequences.
3. Results
The mixture model presented in the previous section can be used to identify an optimal value for ℓ to limit the number of spurious MEMs. Considering the lengths of the MEMs that are retrieved between a pair of sequences, the EM algorithm estimates values for the parameters (pi) for the K components of the mixture model. Depending on these estimations, it is then possible to determine if a component describes the length of spurious MEMs or the length of significant MEMs. Changing the minimal length (ℓ) of the MEMs impacts the proportion of each type of MEMs. More especially, if ℓ is high enough, the proportion of spurious MEMs will be low enough to be ignored, and hence, the component corresponding to them will not be identified by our model. This latter value of ℓ could be used as a threshold to limit the amount of spurious MEMs.
All the results presented in this section were obtained from 1000 repetitions of the EM algorithm and selection of the estimation that led to the highest likelihood. First, controlled simulated sequences were investigated to illustrate the use of our method, and second, real DNA sequences were studied to show its practical interest.
3.1. Simulated random DNA sequences
3.1.1. Selecting an optimal value for ℓ:ℓopt
Let's consider a pair of 2-Mb sequences with equal proportion of each base (25%). The first sequence (S1) was randomly generated, and the second one (S2) was obtained by applying substitutions on S1 with a rate of 0.01 substitution per site. Figure 2 displays the results obtained when adjusting a two-component mixture model (K = 2) to compare S1 and S2.
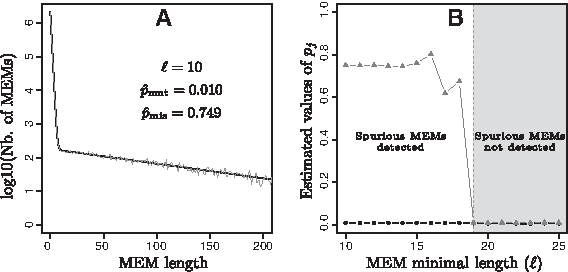
Estimations obtained with the EM algorithm with two components (K = 2) for the comparison of S1 and S2.
Figure 2A provides an observed versus fitted plot of MEM length distribution when the minimal length of the retrieved MEMs is fixed at 10 nucleotides (ℓ = 10). It clearly shows that the model fits the observed data exactly. This means that, if all the MEMs with a minimal length of 10 nucleotides are considered, it is possible to characterize the two distributions that correspond to significant MEMs and spurious MEMs. Interestingly, the estimated
Figure 2B gives the estimated values of the geometric distribution parameters (pj) with respect to the minimal length (ℓ) of MEMs. The model had two components (K = 2), and thus two (pj) values were estimated. The black curve corresponds to the lowest estimated values. It does not vary with ℓ values, and it is globally equal to 0.01. This is exactly the substitution rate chosen to obtain S2. Consequently, it is possible to associate this curve with pmut (i.e., the component corresponding to significant MEMs). The gray curve can be associated with pmis, the component of spurious MEMs. It displays a completely different tendency. For ℓ of 10–15, it has steady values around 0.75; then it varies and rapidly falls to 0.01 for ℓ ≥ 19. This means that for ℓ ≤ 15 the model is able to clearly detect the spurious MEM component, while for ℓ ≥ 19 the parameters of the two components are identical, p1 = p2 ≃ pmut, providing us a threshold to discriminate spurious MEMs. As a consequence, in this example, we considered ℓopt = 19 as threshold value. Note that, for ℓ equal to 16, 17, and 18, spurious MEMs are still detected, but they are not enough to accurately estimate the value of pmis, implying the observed fluctuations.
3.1.2. Impacts of sequence characteristics on ℓopt
Impacts of the characteristics of the compared sequences on the value of ℓopt were investigated with simulated data. Three parameters were considered: the length, the divergence (measured in substitutions per site), and the base composition (measured in GC%). For each condition of length, divergence, and base composition, the mean of ℓopt was computed over 50 trials. For each trial, the evaluation of ℓopt was performed by using the same approach than in Figure 2B. The obtained results are summarized in Figure 3.
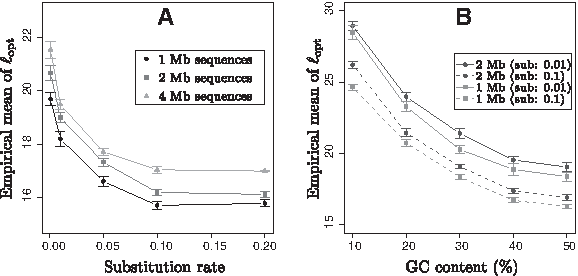
Mean of ℓopt values and confidence interval (95%), computed over 50 trials, with respect to the characteristics of compared sequences on simulated data.
Figure 3A is a plot of the empirical mean of ℓopt values with respect to the divergence of the compared sequences for three different lengths at 1–4 Mb. This figure clearly shows that the length and the relative divergence of the compared sequences yield the selection of different ℓopt values. First, ℓopt decreases for substitution rates ranged between 0 and 0.1, and then reached a globally steady state for higher values of substitution rates. This means that, for very closely related sequences, the optimal ℓ value should be higher than for more distant sequences. Moreover, the longer the compared sequences, the higher the ℓopt. Figure 3B gives the variations of ℓopt with respect to the GC content of the compared sequences when considering 1-Mb and 2-Mb sequences and with substitution rates set at 0.01 and 0.1. It clearly shows that values of ℓopt are highly influenced by the GC content of the compared sequences. The higher the GC bias, the higher the ℓopt.
Selection of ℓopt is influenced by the intrinsic characteristics of the compared sequences. The overall variation observed in this analysis was 15–30 nucleotides.
In the next subsection, real DNA sequences were investigated to illustrate the applicability of our method on real data.
3.2. Analysis of real DNA sequences
3.2.1. Impact of the number of components K
The main difficulty when analyzing real DNA sequences is to select a suitable number of components (K) for the mixture model. Indeed, for simulated data, the substitution rate is fixed all along the sequences while real genomes are considerately more heterogeneous, including more or less conserved regions that are sometimes rearranged (i.e., non collinear). Consequently, considering more than one substitution rate is relevant to analyze real DNA sequences. Moreover, variations of K can have an impact on the selection of ℓopt. This is exemplified in Figure 4. Figure 4A provides the estimations of pmis, the parameter associated with spurious MEMs, for the comparison of the genomes of two strains of Staphylococcus aureus (MSSA476 and JH1) when considering K = 2 (black curve) and K = 3 (gray curve). This figure clearly shows that the values of ℓopt for both models are the same: ℓopt = 18. This is not the case in Figure 4B, which deals with two strains of Bacillus cereus (ATCC 10987 and E33L). In this example, the two-component model yields ℓopt = 17, while the three-component model yields ℓopt = 18. It is thus crucial to set K before the determination of ℓopt.
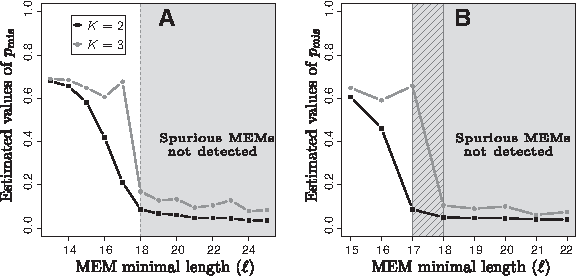
Impact of the number of components (K) on the selection of ℓopt. Estimated pmis with respect to the value of ℓ when K = 2 and K = 3.
Intrinsically, the greater K, the higher the likelihood of the model. This is illustrated in Figure 5, which compares the observed data with the predictions of the mixture model when K = 2 and K = 3 for the comparison of two Staphylococcus aureus strains (MSSA476 and JH1). It shows that, for this example, the model K = 3 is significantly better than for the model K = 2. On the other hand, increasing the number of components also increases the complexity of the model (i.e., number of parameters to estimate). Thus, the challenge is to find a trade-off between the precision of the model (its likelihood) and its complexity. To face this task, the BIC information defined above was used.

Impact of the number of components (K) on the model predictions. Comparison of two Staphylococcus aureus strains (MSSA476 and JH1): observed data versus fitted values when K = 2 and K = 3.
3.2.2. Analysis of complete bacterial genomes
Comparison of complete bacterial genomes at the nucleotide scale is very often limited to closely related genomes (Chiapello et al., 2005). This is why most of the existing approaches deal with intra-species comparisons. In this context, 53 pairs of bacterial genomes from the same species or from very close species were selected to be analyzed with our method. These bacterial genomes are listed in Table 1.
Selected value of ℓ opt that was retrieved a least once with an other value of K.
For each pair, the following is provided: the species name, the strain names and their corresponding lengths (nuc.), a measurement of their relative divergence with the MUMi index, the number of components K selected according to the BIC value, the selected value of ℓ opt , and the average GC content (%).
Pairs of genomes were selected in order to have a representative range of lengths and divergence. To evaluate the distance between each pair, we used the MUMi index that was especially designed to measure distances between closely related complete genome sequences (Deloger et al., 2009). Briefly, MUMi evaluates the ratio of cumulative length of maximal unique matches (MUMs) to the total genome length. It varies between 0 and 1: the lower the MUMi, the closer the genomes. For each pair, three models were considered: K = 2, K = 3, and K = 4. The best one, according to the BIC, was selected and used to evaluate the value of ℓopt. All the results of this analysis are given in Table 1. The pairs of genomes are sorted according to their divergence (MUMi).
The models with K = 2, K = 3, and K = 4 were selected 6, 30, and 17 times, respectively. A slight relation between the selected model, and the divergence of the genomes is observed; more distant sequences seem to require fewer components than closer ones. Intuitively, this can be explained by the fact that close genomes share more MEMs than distant ones, and thus more components are necessary to model the distribution of their length.
The selected values of ℓopt are 17–23. More than 50% of the selected values of ℓopt are equal to 18, and approximately 25% of the others are equal to 21. Note that, for 70% of these pairs of genomes, the value of ℓopt for the best model (selected from BIC) was also found in at least one of the two other models (Table 1). These predictions were confronted with the characteristics of the compared genomes. Figure 6 summarizes these analyses when considering the length and the GC content of the sequences. Interestingly, the highest values of ℓopt (22 and 23 nucleotides) were obtained for genomes with high GC bias, and the smallest value of ℓopt (17 nucleotides) was obtained for genomes with a low GC bias. Moreover, it is noteworthy that in this dataset the length of the genomes is correlated with the GC content; small genomes have a high GC bias, and long genomes have a low GC bias. Consequently, the relationship between ℓopt and the length of the compared sequences is balanced by the GC bias. Lastly, no relation was identified between the selection of ℓopt and the MUMi index. This study confirms that the relationship between ℓopt and the characteristics of the genomes is complex and involves various factors.

Selected values of ℓopt for the 53 pairs of bacterial genomes with respect to the GC content (abscissa) and the length of the genomes (point size and grey scale).
4. Discussion
The method presented in this article is is based on the principle that the distribution of the length of spurious and significant MEMs between two sequences can be distinguished by using a mixture model of geometric distributions. First, our model identifies the components that characterize the two types of matches. Second, it allows us to establish a threshold for the MEM minimal length (ℓ) values to discriminate between spurious and significant MEMs.
Our model was developed to analyze MEMs retrieved from two sequences. However, it is possible to treat data obtained from more than two sequences. Indeed, the inputs of our model are only the lengths of the retrieved MEMs, and thus, they can come from the comparison of two sequences or more. The only limitation is when considering more than two sequences, the biological significance of the estimated parameters is less intuitive, especially if the compared sequences are very distant.
In this study, two kinds of data were analyzed: simulated DNA sequences and real bacterial genomes. Results obtained with simulated data were particularly interesting. The model was able to retrieve very accurately the parameters of each component. We were also able to identify a relation between the optimal value of ℓ (ℓopt) and some characteristics of the sequences. Applications to real DNA sequence were also successful. The applicability of the method is the same as for simulated data. The main difficulty remains in the choice of a suitable number of components. We solve this problem by using the BIC. From the analysis of 53 bacterial genomes, we confirmed that characteristics of the compared sequences impact on the determination of ℓopt.
For sake of simplicity, in our model we assumed that point-mutations are i.i.d. in genomes. Although this is true in simulated sequences, it is obviously not the case in most real DNA sequences. However, we showed (Fig. 5) that our model is able to capture the overall distribution of MEM length between two genomes, despite this assumption.
The lack of effect of the MUMi index on the values of ℓopt can have different explanations. First, measuring the distances between complete genomes is not as simple as for short DNA sequences. Most of the existing approaches deal with the evaluation of the cumulative length of common words between sequences such as the D2 statistic (Forêt et al., 2009) or the MUMi index (Deloger et al., 2009) or, with a more flexible definition, the determination of the conserved subsequences between genomes, called the “backbone” (Chiapello et al., 2005). This means that distant genomes are not sequences that share homologous regions with a low percentage of identity, but rather they are sequences that share few highly conserved subsequences. This can explain why, when considering very distant genomes (Table 1), no impact was observed on the values of ℓopt, while when increasing the substitution rate in simulated data, ℓopt significantly decreases. Another possible explanation comes from the following observation: the greater the distance between the compared genomes, the smaller the conserved sequences and thus, the fewer the MEMs. Consequently, when considering very distant genomes, the number of significant MEMs may not be sufficient to accurately estimate the parameter pmut.
For about 75% of the real sequences, estimated ℓopt values were 18–21. These results are very close to the empirical values used in former studies such as in the complete bacterial genome alignment procedure proposed in Chiapello et al., (2005) (ℓopt = 20) or the definition of the MUMi index in Deloger et al., (2009) (ℓopt = 19). Our results are also comparable to those obtained in some preliminary statistical studies such as in Guyon and Guénoche (2008) (ℓopt = 22). However, the advantage of our approach is to provide a value of ℓopt adapted to each pair of genomes studied.
Note that our model provides directly estimations of the probabilities that MEMs belong to spurious or significant components, according to their length (see equation 5). Consequently, in addition to the determination of the threshold (ℓopt), these probabilities can be directly used to weigh MEMs in comparison purposes (e.g., to improve anchor selection in complete genome alignments).
The method presented here can be of interest in several domains. It helps to choose suitable anchor lengths in anchor-based alignments of complete genomes and to calibrate statistical tools to compare large sequences. Other secondary applications can be considered. For example, indexing methods are based on the use of word matches. The size and the precision of an index is directly linked to the length of WMs: increasing the length of WMs increases the precision of the index, but it also increases the index size. Our method could probably provide a good trade-off to balance between size and precision of an index.
Beyond the determination of an optimal value of MEM minimal length, our method is also able to estimate very accurately one or several substitution rates between two sequences. There only exist a few recent methods able to do such estimations on genomic sequences, but to our knowledge, none of them are able to identify several substitution rates for the same pair of genomes. In addition, mixture proportions of our model can provide fruitful information concerning the structure of the compared sequences. Thus, for example, by considering the lengths of the sequences and the mixing proportion of spurious matches (πmis) over the mixing proportion of significant matches (πmut), it is possible to estimate the proportion of sequences that are specific in each compared genome, providing an estimation of the backbone coverage (Chiapello et al., 2005). Moreover, if several substitution rates are considered (K > 2), mixing proportions (πj) allow us to estimate the different proportions of sequences that are governed by the different estimated substitution rates (data not shown).
Lastly, in this study, we only considered exact matches because they are used over whelmingly in comparative genomics. However, some recent developments use non-exact matches or spaced seeds (Choi et al., 2004), that consist in allowing one or several mismatches. These kind of approaches also suffer from a lack of expertise concerning the length of the seeds and the number of mismatches to consider. Consequently, adapting our method to spaced seeds should provide benefits to the development of such approaches.
Footnotes
Acknowledgments
We thank Dr. M. El Karoui (Harvard Medical School) for her valuable comments on this work. This work was supported by the Agence Nationale de la Recherche (project CoCoGen; grant BLAN071_185484).
Disclosure Statement
No competing financial interests exist.