
Abstract
Abstract
1. Introduction
It has been shown in the literature that understanding of the mechanism is crucial in modeling microarray data and successful separation of array artifacts from the biological signals (Li and Wong, 2001; Held et al., 2003, 2006; Johnson et al., 2006; Kapur et al., 2008; Kalari et al. (2006); Mount et al. (1992); Pozhitkov et al., 2010). The first important step is to identify the source of the artifacts by studying the components that present the main characteristics of the artifact. The genomic wave has been shown to present a high correlation with the GC content, a main feature of the genomic waves (Diskin et al., 2008). However, this does not imply that the GC content is the only source of the genomic wave artifact, and more studies, especially based on the array mechanism, are needed to achieve a better understanding of the source of the artifact, which may lead to an accurate estimation of the artifact and its complete correction. Furthermore, it has been reported that the study of GC content plays a major role in signal bias correction (Hasan and Schreiber, 2006) because the GC content varies from intron regions to exon regions (Gilbert and Rechtsteiner, 2009) and may affect many genome functions, including splicing (Zhang et al., 2011), genomic punctuation (Zhang et al., 2004), and perturbations in genomic signals (Hasan and Schreiber, 2006). However, it is not known whether the current methods of removing the genomic wave also remove part of the biological signals, which, if it is true, may lead to potential loss of statistical power and trade off the gain from the artifact removal. Therefore, identification of the source of the genomic waves and confirmation for the separation of the artifact from the biological signals is crucial to subsequent association studies. In this article, we report a novel method of catching the genomic wave on oligonucleotide SNP arrays and provide further insight on the source of the genomic waves, which further confirms that the genomic wave artifact can be separated from the biological signals through a simple regression model that removes not only the genomic wave artifact but also other artifacts simultaneously.
In a previous study (Wan et al., 2009), we modeled hybridization of the DNA–DNA duplex binding through a probe intensity composite representation (PICR) model based on physicochemical thermodynamics model. The single array-based PICR model employs a linear regression in each SNP probe set and generates highly accurate copy number estimation and SNP genotype calls consistently across arrays and array platforms (Wan et al., 2009). Here we report that the PICR model catches the genomic wave with the SNP-specific baseline term, and leaves the estimated target concentration unaffected by the genomic wave artifact. Thus, subsequent analysis based on the allelic concentrations by the PICR does not suffer from the genomic wave artifact. By analyzing the baseline component, we further find that the genomic wave presents the wave pattern of the linear effect of the GC content consistently across chromosomes, and a nonlinear effect of the fragment length (FL) varying across chromosomes. We illustrate the effect of the genomic wave and its removal with the Affymetrix 500K HapMap data and the Wellcome Trust Case–Control Consortium data.
2. Materials and Methods
2.1. Data
GeneChip 500K SNP array HapMap samples were downloaded from the Affymetrix, Inc., website. The hypertension cases of the Wellcome Trust Case–Control Study data were obtained from the Wellcome Trust Case–Control Consortium online (see References).
2.2. Statistical analysis
Probe intensity data were obtained from each CEL file of the Affymetrix 500K GeneChip array, and then processed through the PICR model to generate the allelic concentrations using Equation 1.
where I's are the probe intensities of a probe set designed to annotate a given SNP of two alleles, labeled as alleles A and B. By the SNP array design, these probes in the probe set may have perfect match to allele A (PA), mismatch to allele A (MA), perfect match to allele B (PB), and mismatch to allele B (MB). b is the SNP-specific baseline background of the intensity, and may include the array background and the SNP-specific deviation from it. NA and NB are the allelic concentrations of the target sequences for annotating alleles A and B, respectively. The function f represents the binding affinity of each probe to the allele (either A or B) of an SNP between a target sequence ST and a probe sequence SP, and was computed following the generalized positional-dependent-nearest-neighbor (GPDNN) model (Wan et al., 2009). The measurement error term ɛ is assumed to follow a normal distribution with mean 0 and a common variance σ2. By linear regression, the PICR model yields the allelic concentrations NA and NB, and the baseline intensity b by the model intercept. For subsequent analysis, only NA and NB are used in association test on DNA variants (Wan et al., 2009).
To illustrate the genomic wave, we examined plot of the relative concentration (RC) at the base 2 logarithmic scale along the genomic position of the SNP, and the plot of the SNP-specific baseline intercept b at the base 2 logarithmic scale. The RC was defined as RC = (NA + NB)/med (N), where med(N) = median(NA + NB) across all SNPs on the same array except for the SNPs on the X-chromosome. Thus, the regular DNA copy number 2 corresponds to RC = 1, and severe deviation from 1 indicates a copy number deviation from 2 at the SNP locus. A loess smoothing curve with a smoothing parameter 0.1 was also fitted to the RC to reveal the pattern along the chromosome, similar to what was examined by Marioni et al. (2007) and Diskin et al. (2008). We further calculated the Pearson correlation coefficient between the RC and the GC content for each SNP and between the baseline intercept b and the GC content. Here the Pearson correlation is preferred to the Spearman correlation in examining the correlation between continuous variables. The correlation coefficients on multiple arrays in each study data set are illustrated with boxplot by chromosome.
The following generalized additive models (GAM) (Hastie and Tibshirani, 1991) were fitted to the baseline estimate b at the base 2 logarithmic scale and its loess smoothing value:
and
where log(b) and loess(log[b]) are the log-transformed SNP-specific baseline estimated from the PICR model and the fitted value of its loess smoothing, respectively. s1(FL) and s2(FL) are the nonlinear smooth terms of the FL. The linear term on GC content was chosen because the nonlinear effect of the GC content is found nonsignificant (p > 0.05). The capture of the genomic wave is demonstrated by the loess smoothing of the log(b) with a smoothing parameter 0.1, and the effect of the GC content, α + β × GC in the model fitting.
To explain that the wave pattern in the smoothing curve loess(log[b]) of (2.2) is captured by the term b or log(b) in (2.1), rather than some terms other than b, we assess the similarity of the effect of the GC content between models (2.1) and (2.2) by the relative difference (RD), defined as the ratio of the mean squared difference of the fitted value with the GC component between models (2.1) and (2.2) calculated with the total number of SNPs (M) on each chromosome to the median of the loess smoothed value of the log intercept as in Equation 3.
3. Results
3.1. Components presenting genomic wave
We examined the pattern of the RC along the chromosome and the baseline intercept of the PICR model. The RC plot and its loess smoothing curve show some fluctuation on chromosome 11, but no consistent pattern across arrays as illustrated with 3 randomly selected HapMap SNP arrays (left panels of Fig. 1). Similar plots are found on other chromosomes (data not shown). In contrast, the loess smoothing curve of the baseline intercept presents consistent wave pattern on chromosome 11 (right panels of Fig. 1) as illustrated with 3 randomly selected HapMap SNP arrays, and similar pattern on other chromosomes (data not shown), across all HapMap samples. The correlation between the RC and the GC content is around 0 consistently across all chromosomes (Fig. 2) and not statistically significant, whereas the correlation between the baseline intercept and the GC content is positive (>0.2) on all chromosomes except for the X-chromosome (>0.16) (Fig. 3). Since the genomic wave has been reported to be highly correlated with the GC content consistently across array platforms (Diskin et al., 2008), it implies that the genomic wave is contained in the baseline intercept term only, but not in the allelic concentrations. Since the allelic concentrations contain the genetic information and convey the biological signals and functions of the genes (Wan et al., 2009), this indicates that the genomic wave can be successfully separated from the biological signals by the PICR model, and thus does not affect the outcome of subsequent analysis based on the allelic concentrations.
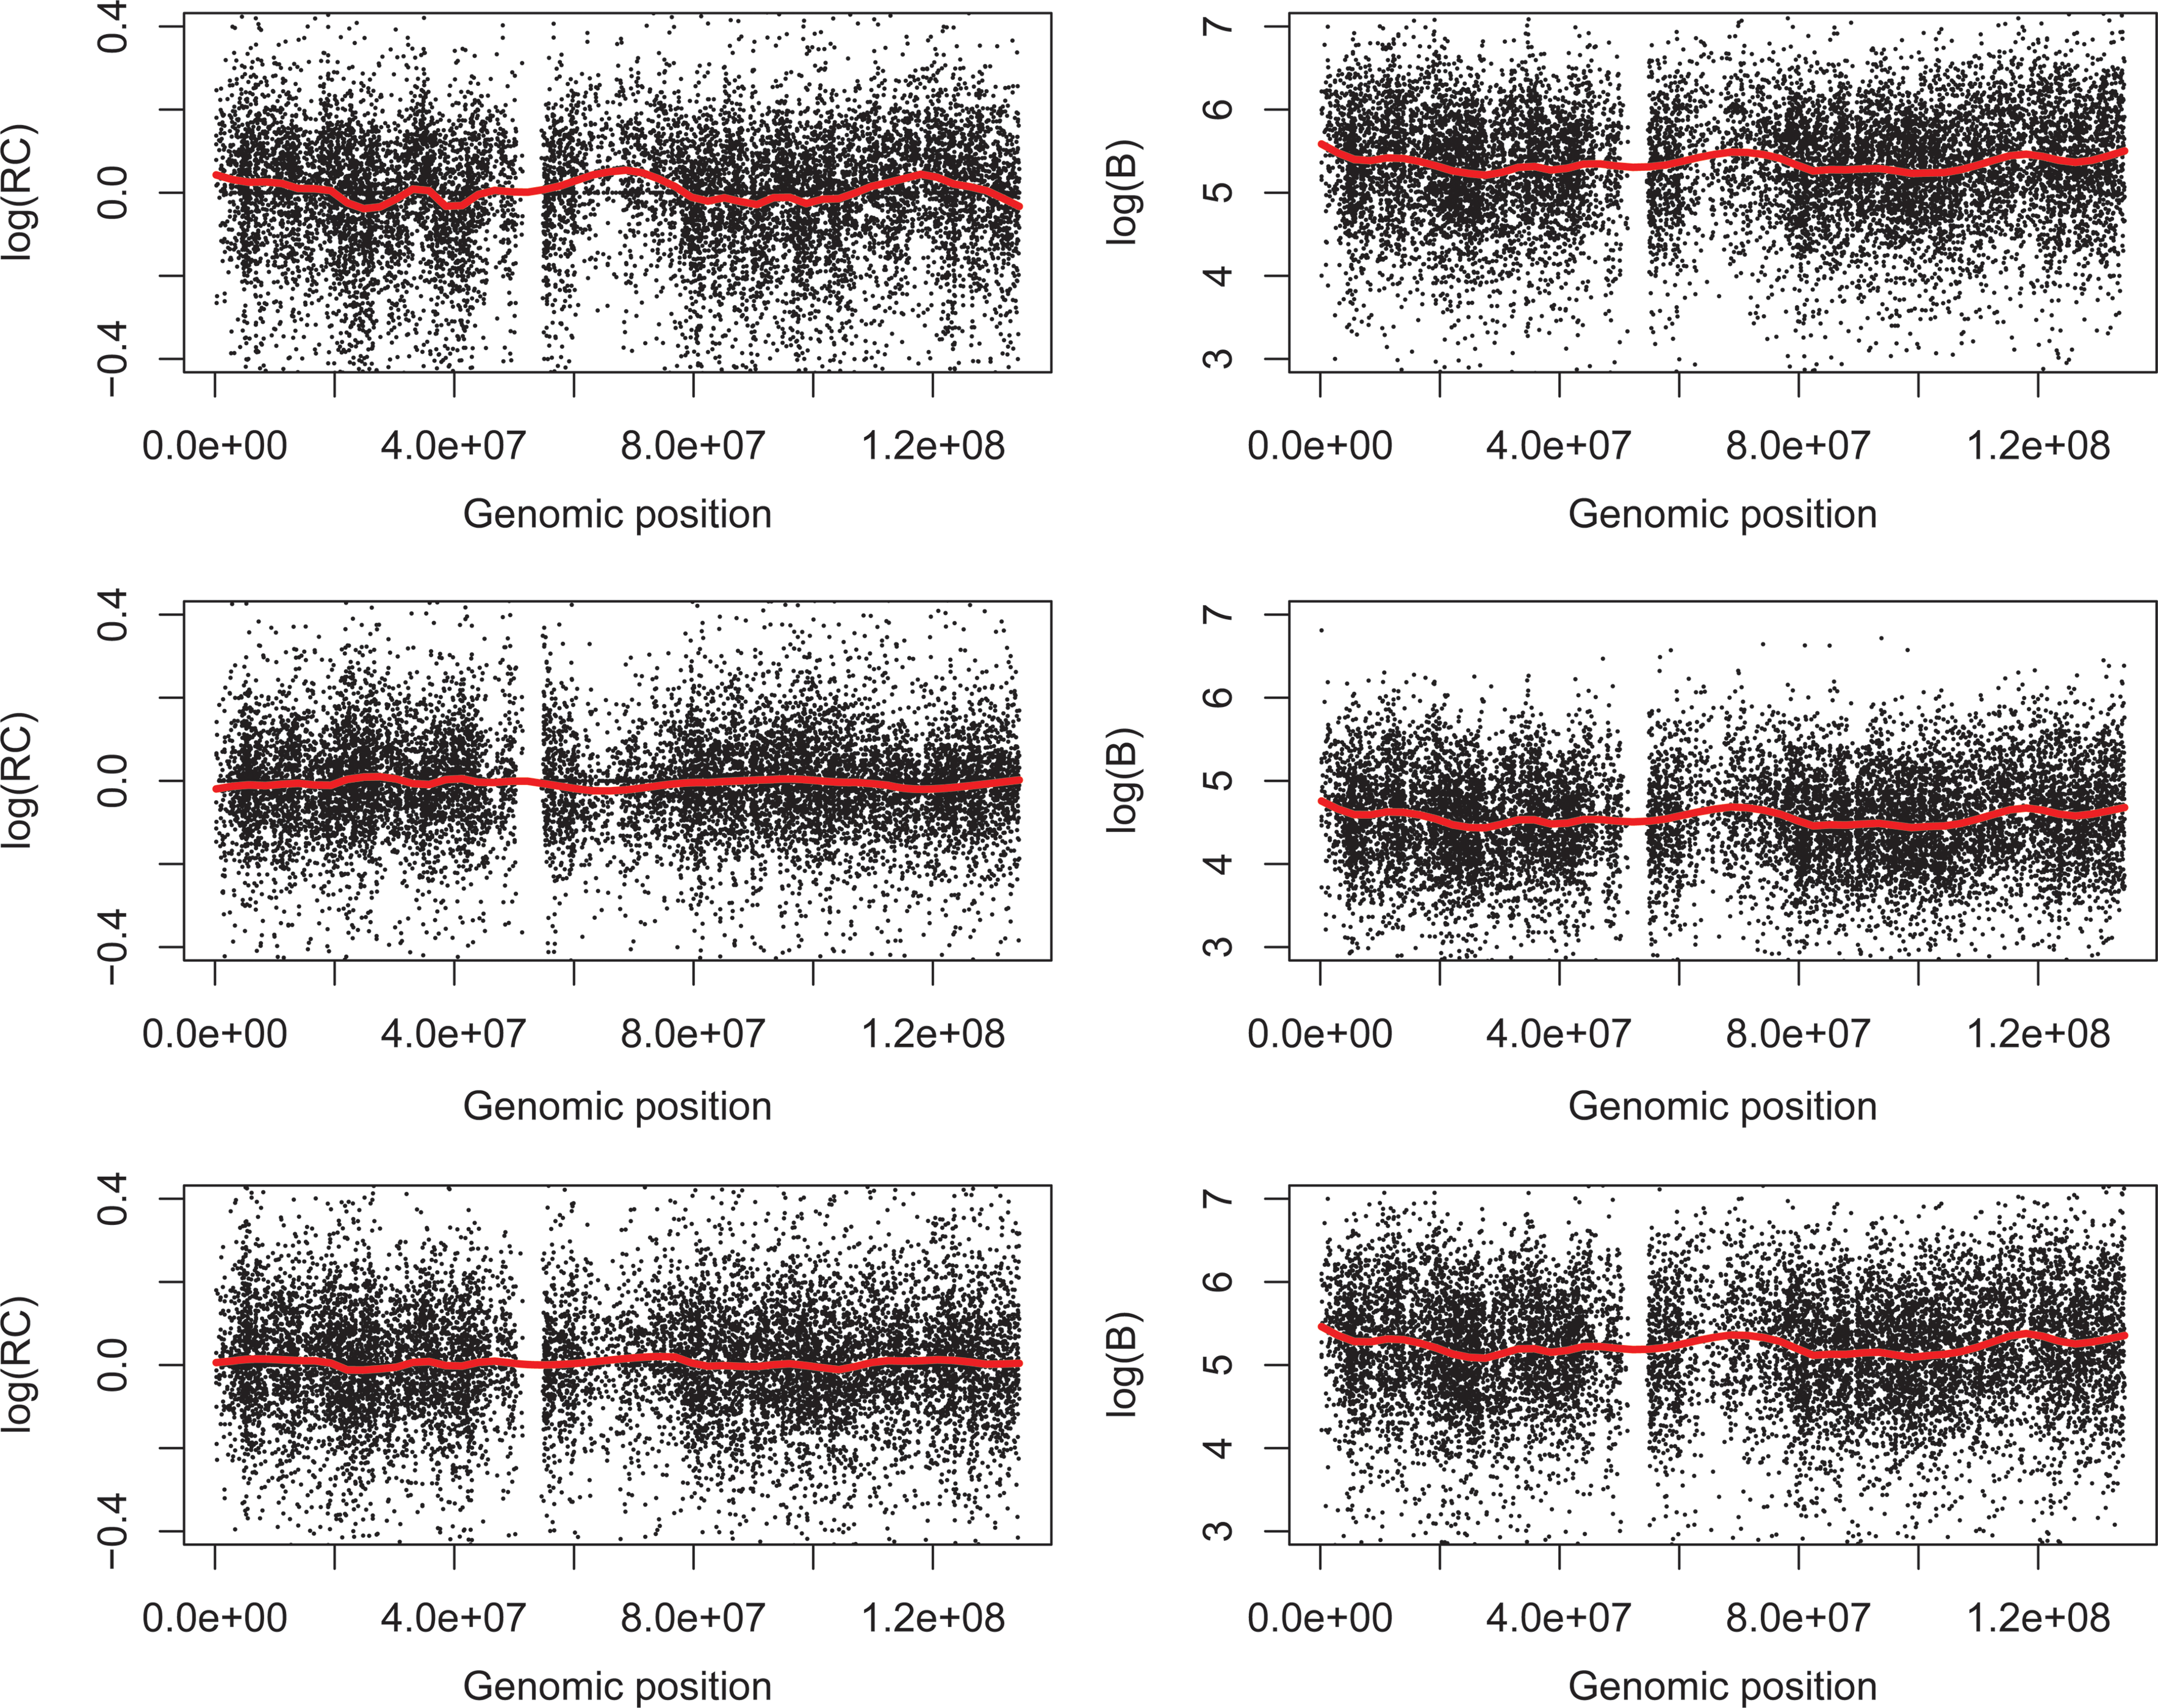
Illustration of the genomic wave on chromosome 11 with 3 randomly selected arrays of the HapMap samples on Affymetrix 500K GeneChip Arrays. Left panel: plot of the relative concentration (RC) in log 2 scale with a loess fit (red curve). Right panel: plot of the baseline intercept in log 2 scale with a loess smoothing curve (span = 0.1) (red curve).

Boxplot of the correlation between the baseline intercept and the GC content by chromosome.
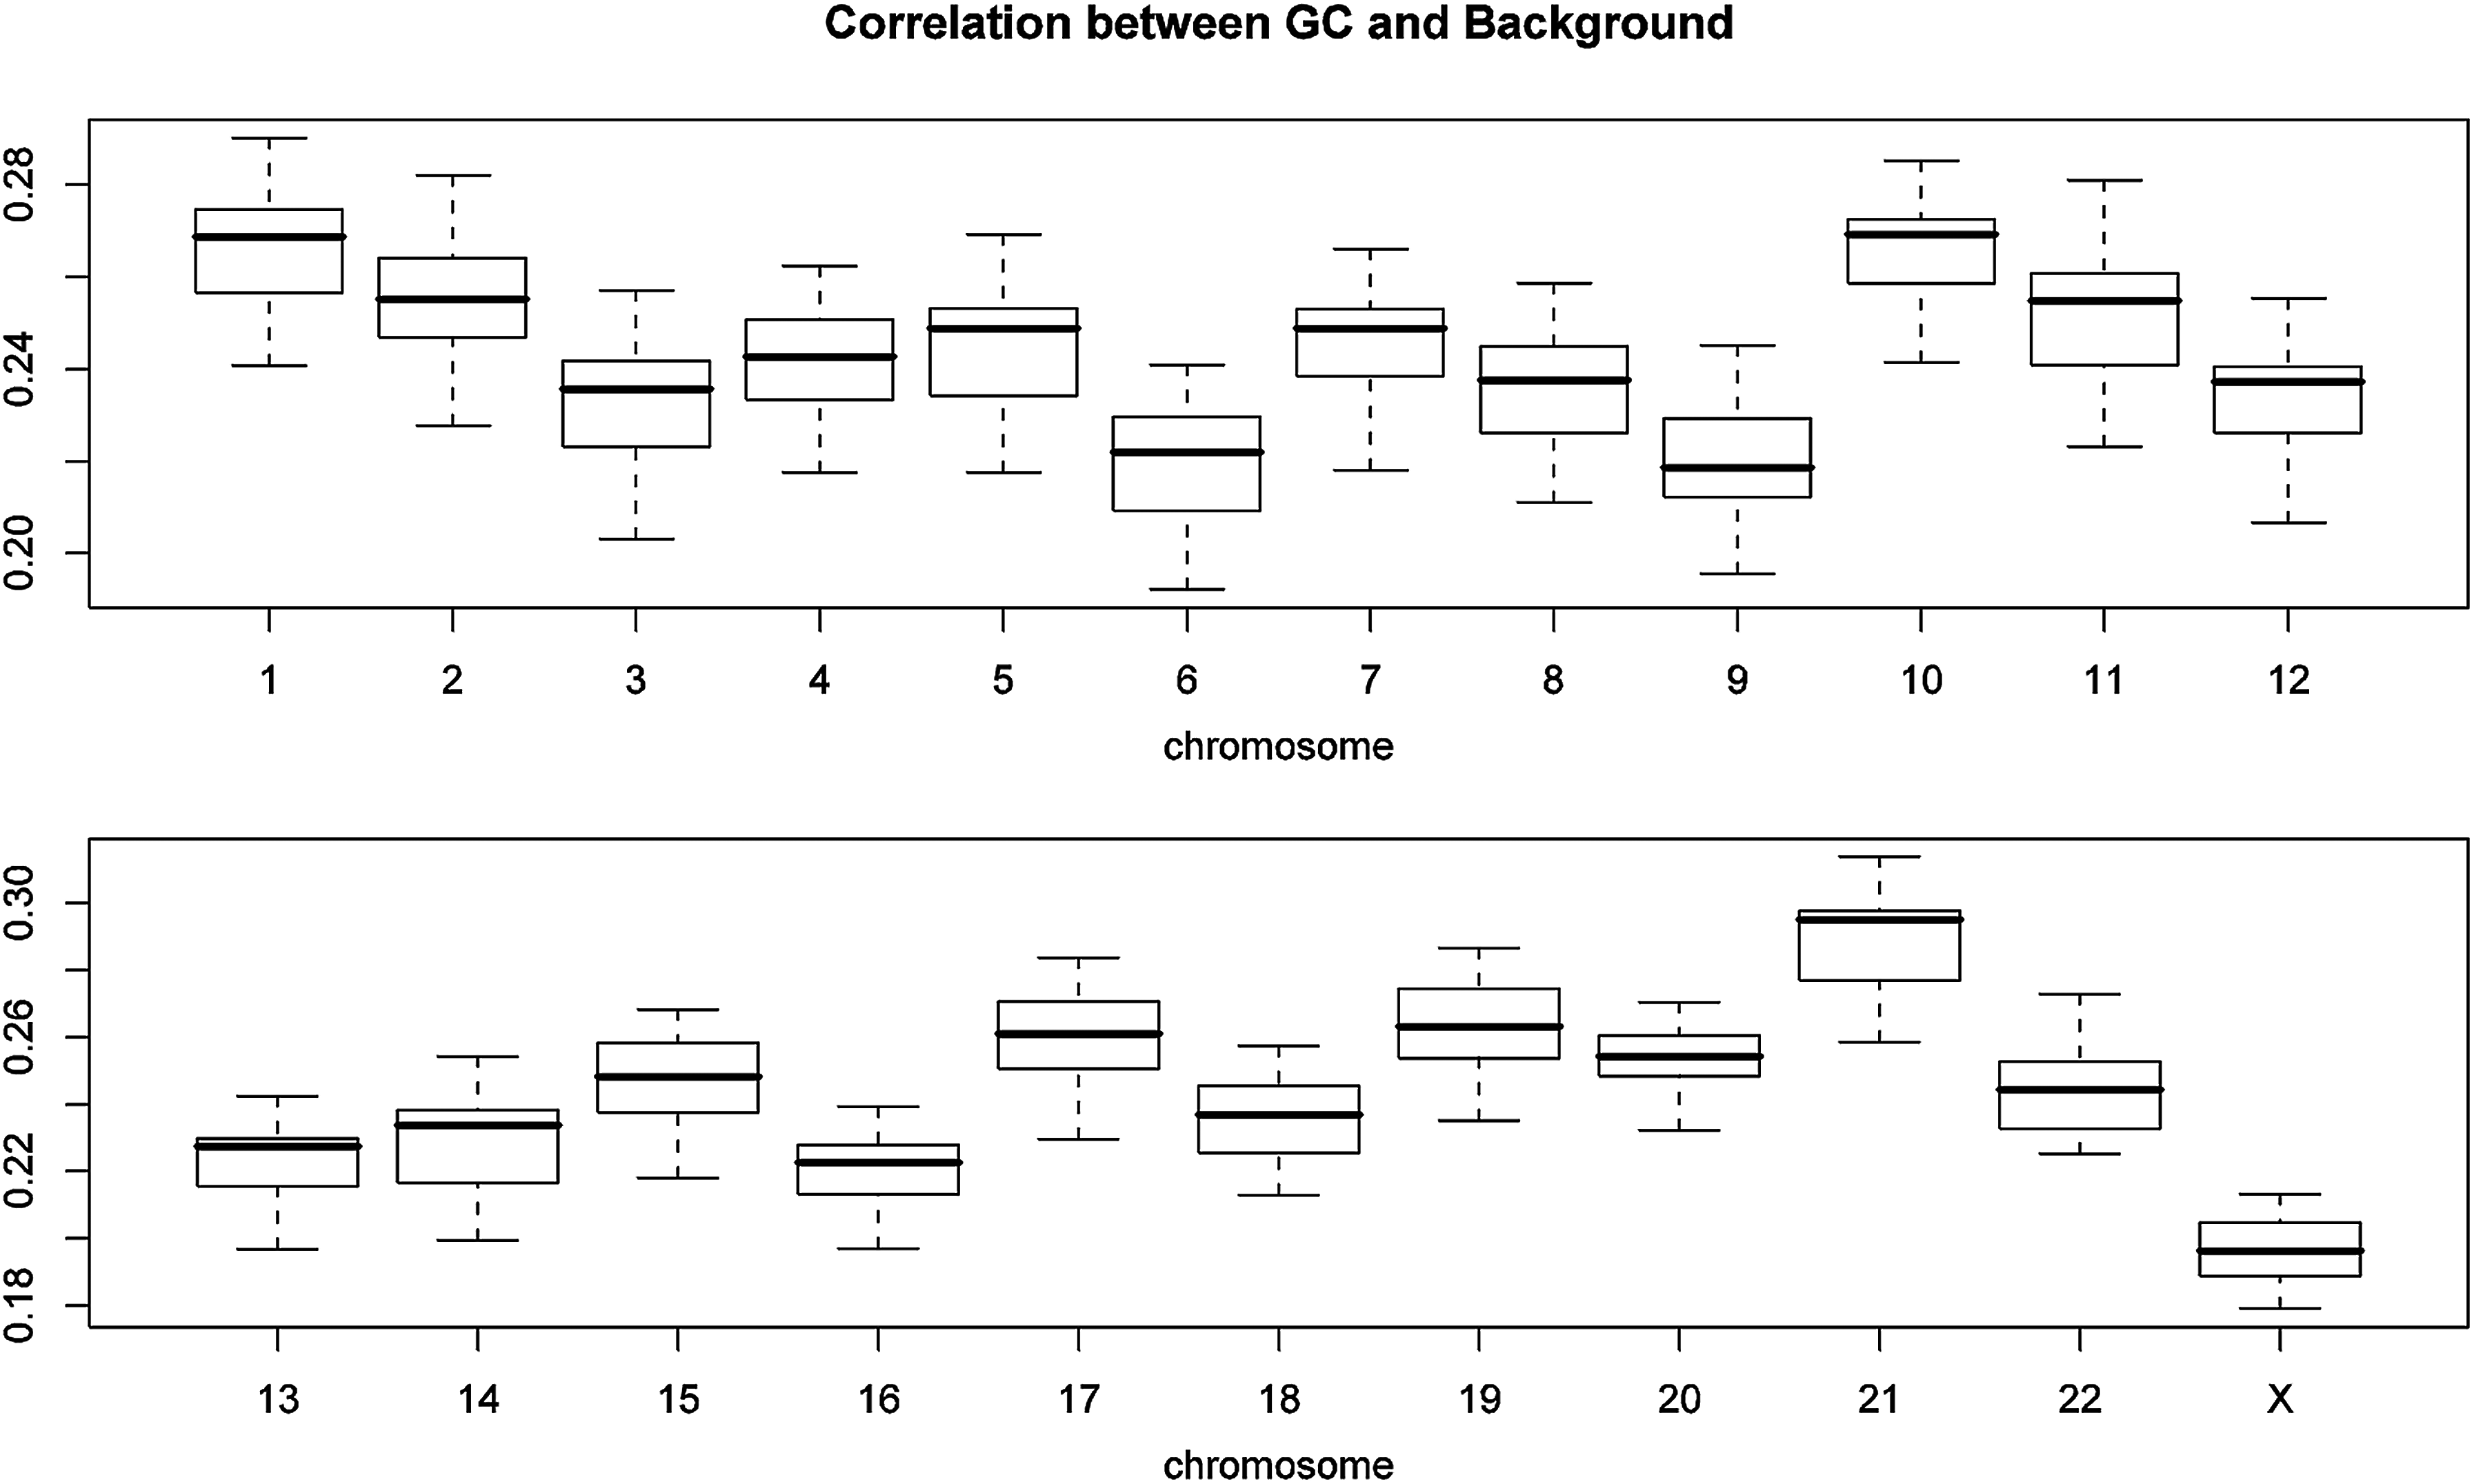
Boxplot of the correlation between the baseline intercept and the GC content by chromosome.
3.2. Decomposition of the genomic wave
Given that we have identified the source of the artifact, the only term containing the genomic wave is the SNP-specific baseline term of the PICR model (1), we further study the baseline term by decomposing it into the GC content and FL of the target sequence through a GAM model (2.1 and 2.2) to further trace the genomic wave. The GAM model has a linear effect of the GC content (nonlinear term is not significant with p > 0.05) for most chromosomes (1 to 21) except for chromosomes 22 and X. Figure 4A and B illustrates the linear effect and nonlinear effect of the GC content on chromosomes 3 and 22, respectively. The nonlinear effect of the FL also varies across chromosomes as shown in Figure 4C and D on chromosomes 3 and 6 on two randomly selected arrays. The parallel pattern of the effect of GC content across arrays indicates that the effect remains consistent across arrays, but also varies across chromosomes, which further suggests that the GC content may be used for array normalization, as also observed by Gilbert and Rechtsteiner (2009). Figure 5 illustrates the capture of the genomic wave (black curve of loess smoothing of the baseline term) by the GC content (α1 + β1 × GC in green) from the GAM model (2.1) (upper panel), and the comparison of the primary effect of the GC content (β1 × GC in green) to the effect of the nonlinear FL (s1(FL) in red) on chromosome 11 (lower panel). The difference in scale of the green curve of the GC content between the upper and the lower panels of Figure 5 is because of the omit of the intercept term α2 in the lower panel, to illustrate the effect of the FL. The fairly flat FL effect compared with the large wave pattern of the GC content in the lower panel demonstrates that the GC content is a dominant source of the genomic wave, while the contribution of the FL is small. The same pattern was observed across all chromosomes.

Illustration of the effects of the GC content and fragment length on the genomic wave.

Capture of the genomic wave on chromosome 11 by the GAM model on the GC content and the fragment length of the target sequence. Upper panel shows the loess smoothing of the baseline term (black) and the fitted value by the GC content and the overall mean (α+ β × GC) of the GAM model (green) in log scale. The exclusion of the fragment length demonstrates that the genomic wave consists largely of GC content. Lower panel shows the effects of the GC content β × GC (green) and the fragment length s(FL) (red) from the GAM model in log scale with the former dominating the latter.
To further quantify the portion of the GC content out of the genomic wave, we examined the variability explained by the GC content out of the total from the loess-smoothed log(b) through GAM model (2.2). Notice that GAM model (2.1) does not serve the purpose since log(b) does not represent the genomic wave, while its loess-smoothed term loess(log(b)) does. The FL term is not significant in model (2.2), and leaves the GC component relatively large to the total variability in loess(log(b)). Although the two GAM models, (2.1) and (2.2), fit different quantities, smoothed and unsmoothed log(b), respectively, their effects of the GC components are very much close through the comparison of the relative difference RD (Table 1). This further confirms that the genomic wave has a dominant GC content component, as illustrated in Figure 6A and B in comparison of the loess smoothing of the SNP-specific baseline and the fit by the GC content. It can thus be concluded that the genomic wave can be captured mainly with the GC content of the SNP target sequence. The WTCCC samples present similar results (data not shown).

Illustration of the comparison of the loess smoothing of the SNP-specific baseline and the fit by the GC content on one randomly selected HapMap sample on
4. Discussion and Conclusions
The genomic wave has been reported as an artifact in the genome data independent of the array media used for data generation. It requires special computational methods to remove the artifact before downstream association studies. Further understanding of the sources of the artifact may lead to successful separation of the biological signals from the artifact.
In this work, we discovered that the genomic wave in the oligonucleotide SNP arrays can be captured and further separated successfully from the biological signals. By studying the array mechanism of the oligoarrays through the PICR model, we showed that the intercept term of the PICR model contains the genomic wave, while the allelic concentrations do not. Further modeling of the intercept term through the GAM model revealed that both the GC content and the FL are significant, with the former presenting a linear effect and contributing largely to the genomic wave, while the latter presenting a nonlinear effect varying across the chromosomes.
Our finding not only confirmed previous conclusion of the high correlation between the genomic wave and the GC content (Diskin et al., 2008), but also quantified the effect of the GC content and the FL, which has not been reported in the literature. In particular, the linear effect of the GC content and the nonlinear effect of the FL varying across chromosomes are novel observations and may be useful for array normalization. Our finding further confirmed that the allelic concentration of the SNPs does not possess consistent wave pattern and is free of the artifact of the genomic wave. This provides strong evidence to the following conclusions: (1) Subsequent analysis based on the allelic concentrations estimated with the PICR model does not suffer from the genomic wave artifact, including association studies on SNP genotypes, copy number alterations, and so on. (2) The genomic wave artifact can be successfully separated from the biological signals by applying the PICR model and the RC method without taking any procedure for artifact adjustment. (3) The GC content of the target sequence is a major source of the genomic wave. (4) Compared to the GC content, the FL of the SNP target sequence has a significant nonlinear effect on the SNP-specific baseline, which varies largely across chromosomes.
Given our previous findings that the PICR model removes the unequal footing artifact, filters the noise in the probe intensity data from the SNP arrays, and yields accurate copy number estimation, we conclude that the PICR model can simultaneously remove multiple artifacts, including two most important ones, the unequal footing and the genomic wave. Thus, the PICR model provides a unified computational approach to the simultaneous removal of multiple artifacts, which has not been achieved by any other computational approach.
Although the PICR model has a large number of parameters, its implementation is fast because the free energy parameters and binding affinities can be precalculated and remain the same across different arrays. Following one reviewer's suggestion to examine the sensitivity of the PICR model in terms of genotype calling accuracy, we randomly selected one HapMap sample and conducted parameter permutation followed by SNP genotype calling. To keep the parameters sensible, all parameters of the PICR model were permuted within each level of the following parameter space: perfect match nucleotide pair effect, perfect match position effect, mismatch nucleotide pair effect, mismatch nucleotide triplet effect, and mismatch position effect. To examine the effect on SNP genotype calling, we permuted the parameters 10 times and calculated the genotype calling accuracy following each permutation. The results show that compared with the high genotype calling accuracy on the selected sample by the original PICR model (99.4% correct calls using the HapMap SNP annotation as the gold standard), the permutation decreased the accuracy largely. Among the 10 permutations, 8 had 80% accuracy, while the other 2 had very low accuracy (38.4% and 33.8% correct calls). The large drop of genotyping accuracy by permutation indicates that the relative large number of model parameters of the PICR model does not lead to overfitting, unlike previous report achieved by modeling of RNA gene expression arrays with a small number of parameters (Ding and Lawrence, 2001; Wan et al., 2008). This may partly reflect the difference in the Affymetrix array design between SNP GeneChip arrays and gene expression Human Genome arrays that use different number of probes for each target annotation.
Given that the genomic wave has been observed in both oligoarrays and bead arrays, and is independent of the array platform (Diskin et al., 2008), it can be implied that the genomic wave must not come from any array specific features, but rather from common experimental procedures. Our finding showed that the GC content and the FL of the DNA sequence around the SNP locus had significant effects, which partly explains why the artifact is independent of the array media. It may further suggest that improvement of future array design needs to consider the GC content and FL of the target sequence, for either SNPs or CNVs. However, further investigation requires more data, which is out of the scope of this current study.
Footnotes
Acknowledgments
This work was partly supported by an Oncology Scholarship from College of Human Medicine, Michigan State University. The author would like to thank the editor and one anonymous reviewer for their helpful comments.
Author Disclosure Statement
The authors declare that no competing financial interests exist.