
Abstract
Abstract
The rapid accumulation of whole-genome data has renewed interest in the study of genomic rearrangements. Comparative genomics, evolutionary biology, and cancer research all require models and algorithms to elucidate the mechanisms, history, and consequences of these rearrangements. However, even simple models lead to NP-hard problems, particularly in the area of phylogenetic analysis. Current approaches are limited to small collections of genomes and low-resolution data (typically a few hundred syntenic blocks). Moreover, whereas phylogenetic analyses from sequence data are deemed incomplete unless bootstrapping scores (a measure of confidence) are given for each tree edge, no equivalent to bootstrapping exists for rearrangement-based phylogenetic analysis. We describe a fast and accurate algorithm for rearrangement analysis that scales up, in both time and accuracy, to modern high-resolution genomic data. We also describe a novel approach to estimate the robustness of results—an equivalent to the bootstrapping analysis used in sequence-based phylogenetic reconstruction. We present the results of extensive testing on both simulated and real data showing that our algorithm returns very accurate results, while scaling linearly with the size of the genomes and cubically with their number. We also present extensive experimental results showing that our approach to robustness testing provides excellent estimates of confidence, which, moreover, can be tuned to trade off thresholds between false positives and false negatives. Together, these two novel approaches enable us to attack heretofore intractable problems, such as phylogenetic inference for high-resolution vertebrate genomes, as we demonstrate on a set of six vertebrate genomes with 8,380 syntenic blocks. A copy of the software is available on demand.
1. Introduction
In earlier work (Lin and Moret, 2008), we described a method for estimating very precisely the true evolutionary distance between two genomes under rearrangements in the absence of duplications and losses, when every genome shares the same collection of genes. While the limitation to identical gene content would be severe, whole-genome data is typically given in terms of syntenic blocks rather than genes; and syntenic blocks, can be selected to obey these limitations: they are shared among the genomes and are not duplicated. We show in this paper how our true distance estimator can be used to reconstruct highly accurate phylogenetic trees from high-resolution genomic data using simple distance methods.
A major drawback of phylogenetic reconstruction based on rearrangements has been the lack of any way to assess the robustness of the reconstructed edges. In phylogenetic analysis from sequence data, such an assessment is de rigueur and is carried out through a bootstrapping process, formally proposed in 1985 by Felsenstein (Felsenstein, 1985), in which replicates of the multiple sequence alignment are produced by random sampling with replacement of the columns, a tree is built from each replicate, and each edge of the original tree assigned a score that is simply the fraction of replicate trees that contain this same edge. While the interpretation of bootstrapping scores remains uncertain (Soltis and Soltis, 2003), the practice of providing such scores is nearly universal. However, the same bootstrapping process cannot be applied to rearrangement data, since a rearrangement is a single character. (Jackknifing, in which some taxa are dropped, remains viable, but the relatively small number of taxa in most analyses, together with the fact that dropping certain taxa can lead to poor reconstruction due to insufficient taxon sampling [Zwickl and Hillis, 2002], severely limit the power of the approach.)
In this article, we propose an entirely new approach to the assessment of the robustness of a reconstruction, in which we take advantage of the additive nature of true evolutionary distances. This approach is fast, uses exactly the same reconstruction algorithm as produced the original tree, allows the user to trade off sensitivity for specificity (not possible in the conventional approach to phylogenetic bootstrapping), and produces support values that correlate well with error measures.
2. Background
Rearrangement data was used in phylogenetic analysis 80 years ago by Sturtevant and Dobzhansky (1936). Blanchette et al. (1997) introduced the first algorithmic approach to the reconstruction of a phylogenetic tree from rearrangement data, BPAnalysis. The algorithm seeks the tree and internal genomes which together minimize the total number of breakpoints—adjacencies present in one genome, but absent in the other. Moret et al. (2001) reimplemented this approach in their GRAPPA tool and extended it to inversion distances—inversions are the best documented of the hypothesized mechanisms of genomic rearrangements. This work focused on unichromosomal genomes; to handle multichromosomal genomes, Bourque and Pevzner (2002) proposed MGR, based on GRAPPA's distance computations. Whereas BPAnalysis and GRAPPA search all trees and report the one with the best score (an approach that limits GRAPPA to trees of 15 taxa unless combined with the DCM approach [Tang and Moret, 2003], in which case it scales up to 1,000 taxa), MGR uses a heuristic sequential addition method to grow the tree one species at a time. The heuristic approach trades accuracy for scalability, yet MGR does not scale well—in particular, it cannot be used to infer a phylogeny from modern high-resolution data, as even just a few such genomes may require days or weeks of computation. Yet, to date, MGR (and its more recent derivative MGRA [Alekseyev and Pevzner, 2009]) had remained the only tool available for the analysis of multichromosomal genomic rearrangements. All such parsimony-based approaches must produce good approximations to the NP-hard problem of computing the rearrangement median of three genomes, which limits their scalability.
Distance-based methods, in contrast, run in time polynomial in the number and size of genomes. Moreover, methods like Neighbor-Joining (NJ) (Saitou and Nei, 1987) provably return the true tree when given true evolutionary distances. Their speed has long been a major attraction, but the distances that can be computed with sequence data are often far from the true evolutionary distances, particularly on datasets with markedly divergent genomes. Pairwise distances are often computed as edit distances, that is, as minimum-cost distances under the assumed model of evolution. However, even with detailed models, such an edit distance typically underestimates the true distance and that underestimation worsens as the true distance grows. The result is poor trees (Moret et al., 2002). The true evolutionary distance—the actual number of evolutionary events between the two genomes—is at once an abstraction and impossible to measure; however, it can be estimated using statistical techniques, something that has long been done with sequence data (Swofford et al., 1996).
Distance estimators have been used for rearrangement data. For unichromosomal genomes under inversions, transpositions, and inverted transpositions, Wang and Warnow (2001) showed how to estimate a true evolutionary distance from the breakpoint distance (the number of disrupted gene adjacencies), later deriving exact formulas (Wang, 2001). For unichromosomal genomes evolving under inversions only, an experimental approach was used by our group to derive the EDE estimate from the inversion edit distance (Moret et al., 2002), yielding greatly increased accuracy in tree estimation under both distance and parsimony methods.
For multichromosomal genomes, all the rearrangement operations can be modeled by a single operation called “Double-Cut-and-Join” or DCJ (Yancopoulos et al., 2005; Bergeron et al., 2006). One DCJ operation makes two cuts, which can be in the same chromosome or in two different chromosomes, producing four cut ends, and then rejoins the four cut ends (in three possible ways) to mimic different kinds of rearrangements. We have described a statistical method, using exact formulas, to estimate the true evolutionary distance between two genomes under the DCJ model (Lin and Moret, 2008), an estimator that we recently refined to include gene duplication and loss events (Lin et al., 2010).
Nonparametric bootstrapping has become the standard method used in phylogenetic analysis to assess the robustness of the reconstruction. In phylogenetic reconstruction, bootstrapping provides support values for branches (or clades) in the estimated tree. The classical bootstrapping method for sequence data by Felsenstein (1985) samples columns with replacement from a multiple sequence alignment to create a new alignment called the bootstrap replicate. Each replicate thus contains the same number of species and the same number of columns per species, but some columns in the original alignment may be duplicated and others omitted in the sampling process. The result is a shift in column bias, with some replicates possibly losing many significant characters and others losing possibly confusing ones. From each replicate a tree (the bootstrap tree) can be reconstructed using any of the available reconstruction techniques. The support value of a branch in the inferred tree is the proportion of the bootstrap trees that contain this branch. For sequence data, experiments suggest that the derived support values are good estimators of accuracy (Felsenstein and Kishino, 1993).
The agreement among the bootstrap trees is subject to very complex processes and cannot be directly understood as a statistical measure. Yet practitioners have found it very useful—and the absence of any equivalent measure for reconstructions based on rearrangement data has been a major problem. Small-scale attempts have been made to use a simple jackknife (leave-one-out), but the relatively small number of taxa in typical datasets limits the power of the test; Tang and his group have recently completed a study of a more elaborate strategy that leaves out a combination of both selected genomes and selected genes (Shi et al., 2010). For the most part, however, current phylogenetic work with rearrangement data has focused on comparing its results with trees produced from sequence data for the same organisms.
3. Phylogenetic Reconstruction and Accuracy Testing
For reconstruction, we use the distance-based Neighbor Joining (NJ) method. Given a matrix of pairwise distances between taxa, NJ reconstructs the phylogeny (including the internal branch lengths) by iteratively joining a closest pair of leaves according to a suitable metric, replacing the two leaves by a “cherry” (the pair of leaves connected to an internal node), computing distances from the cherry to all other leaves, and iterating until only three leaves remain. When the distance matrix is additive, NJ guarantees the reconstruction of the true tree (Saitou and Nei, 1987).
We study the accuracy of the reconstructed trees and their internal branch lengths through extensive simulations—conducted by generating several trees, simulating evolution on these trees, and using the leaf permutations as inputs to the reconstruction method. The reconstructed trees are compared with the “true” trees to test the accuracy of the method.
We use the Robinson-Foulds (RF) metric (Robinson and Foulds, 1981) to measure the topological accuracy of inferred trees. Every edge e in a leaf-labeled tree defines a bipartition on the leaves: removing e disconnects the tree and thus partitions the set of leaves. If T is the true tree, and T′ is the inferred tree, then the false positives are the bipartitions of T′ not present in T, and the false negatives are the bipartitions of T not in T′. Divide each count by n − 3, the number of internal edges in a binary tree on n leaves: the results are the false positive and false negative rates. The RF distance between two binary trees is the average of the number of false negatives and false positives; the RF error rate is the average of the false negative and false positive rates.
The accuracy of branch length estimation is measured by the average branch length error for each inferred tree: Σ|ei − ti|/Σti where ei and ti are the edge lengths of edge i in the inferred tree and true tree, respectively, and the summation is over all edges of the trees.
4. Bootstrapping for Rearrangement-Based Phylogenetic Reconstruction
The classical bootstrapping method cannot be applied directly to rearrangement data because the entire genome is a single character in the space of permutations. However, bootstrapping is just one of many possible tests of robustness or repeatability; we therefore design such a test for distance-based reconstructions that takes advantage of the unique characteristics of rearrangement data. The rationale behind our bootstrapping method is to introduce perturbations in the leaf genomes and to reconstruct bootstrap trees from the perturbed leaf genomes. (Note that sampling characters with replacement from leaf sequences, as is done with DNA sequence data, also results in “perturbed” sequences.)
Our method is based on the same two properties used in sequence-based bootstrapping. First, the perturbed data must remain a valid input for phylogenetic reconstruction. Therefore, we perturb the leaf genomes by applying random DCJ operations, thus ensuring that the new genomes remain valid inputs; the number of DCJ operations applied to each genome is chosen from a Gaussian distribution, so that the level of perturbation can vary from leaf to leaf. Second, the expected pairwise distance after perturbation must remain close to the distance between the corresponding pair of leaves before perturbation. In our case, if x DCJ operations are applied to leaf i to yield leaf i′ and y DCJ operations are applied to leaf j to yield leaf j′ (where i and j are in the input dataset and i′ and j′ in the replicate), and if x and y are not too large, then the expected distance between i′ and j′ is approximately (x + y) larger than the distance between i and j. To enforce this second property, we produce a distance matrix in which the distance between i′ and j′ is d(i′, j′) − (x + y), where d(i′, j′) is the estimated true distance between i′ and j′.
Our procedure produces new distance matrices on the full set of taxa; on each such matrix, it applies NJ to produce a bootstrap tree; and from these trees, it computes support values as in the sequence-based bootstrap.
5. Experimental Design
5.1. Testing phylogenetic reconstruction
Our simulation studies follow the standard procedure in phylogenetic reconstruction (Hillis and Huelsenbeck, 1995): we generate model trees under various parameter settings, then use each model tree to produce a number of “true trees” on which we evolve artificial genomes from the root down to the leaves (by performing randomly chosen DCJ operations on the current genome) to obtain datasets of leaf genomes for which we know the complete history. We then reconstruct trees and branch lengths for each dataset by computing a distance matrix using our DCJ-based true distance estimator and then using this matrix as input to NJ. We then compute Robinson-Foulds distances and error rates as well as branch-length errors.
A model tree consists of a rooted tree topology and corresponding branch lengths. The trees are generated by a three-step process. We first generate birth-death trees using the tree generator in the software R (R Development Core Team, 2009; with a birth rate of 0.001 and a death rate of 0), which simulates the development of a phylogenetic tree under a uniform, time-homogeneous birth-death process. The branch lengths in this tree are ultrametric, so, in the second step, the branch lengths are modified to eliminate the ultrametricity. Choosing a parameter c, for each branch we sample a number s uniformly from the interval [−c, +c] and multiply the original branch length by es (for the experiments in this paper, we set c = 2). Thus, each branch length is multiplied by a possibly different random number. Finally, for each branch we rescale its length to achieve a target diameter D for the model tree; each branch length now represents the expected number of rearrangements on that branch. From a single model tree, a set of trees is generated for simulation studies by retaining the same topology and varying the branch lengths by sampling, for each branch in the tree, from a Poisson distribution with a mean equal to that of the corresponding branch length in the model tree.
All experiments are conducted by varying three main parameters: the number of leaves, the number of genes, and the target diameter. The number of leaves in the trees simulated are 100 and 500, the number of genes are 5,000 and 10,000 and the target diameters range from 0.5n to 4n, where n is the number of genes. For each setting of the parameters, 100 model trees are generated and from each model tree 10 datasets are created. The error rates for RF and branch length shown in the next section are averages over these 1,000 trees.
We also test our reconstruction technique on a real dataset: genomes of 6 species from the Ensembl Mercator/Pecan alignments with 8,380 common markers. We selected these genomes for their size, to demonstrate the scalability of our approach, but also because, among vertebrate genomes, they are the best assembled: other vertebrate genomes in the alignment have anywhere from twice to ten times more contigs than the actual chromosomal number of the species.
5.2. Testing the bootstrapping method
To test our bootstrapping method, we generate datasets as described above, using 100 leaves, a diameter of 10,000, and genomes of size 5,000. From each inferred tree 100 bootstrap trees are generated. To test different amounts of perturbations, we use Gaussian distributions with means of 0.005n, 0.01n, 0.02n, 0.05n, 0.1n, 0.15n, and 0.2n and standard deviations of, respectively, 0.00125n, 0.0025n, 0.005n, 0.02, 0.04n, 0.06, and 0.08n, where n is the number of genes in the dataset. We average the results obtained from 100 such datasets for each set of parameters for the Gaussian distribution.
6. Results and Discussion
6.1. Simulation studies of the phylogenetic reconstruction
Figure 1 shows RF error rates for various trees. On the left are rates for trees with 100 and 500 species, with genomes of size 5,000 and target diameters ranging from 2,500 to 20,000. The error rates are below 10% in all but the oversaturated cases. On the right are rates for trees of 100 species, with genomes of size 5,000 and 10,000 and diameters varying from half the number of genes to four times that number. As expected, error rates are significantly reduced by an increase in the size of the genome—because the larger number of genes reduces the relative error in the estimated distances.
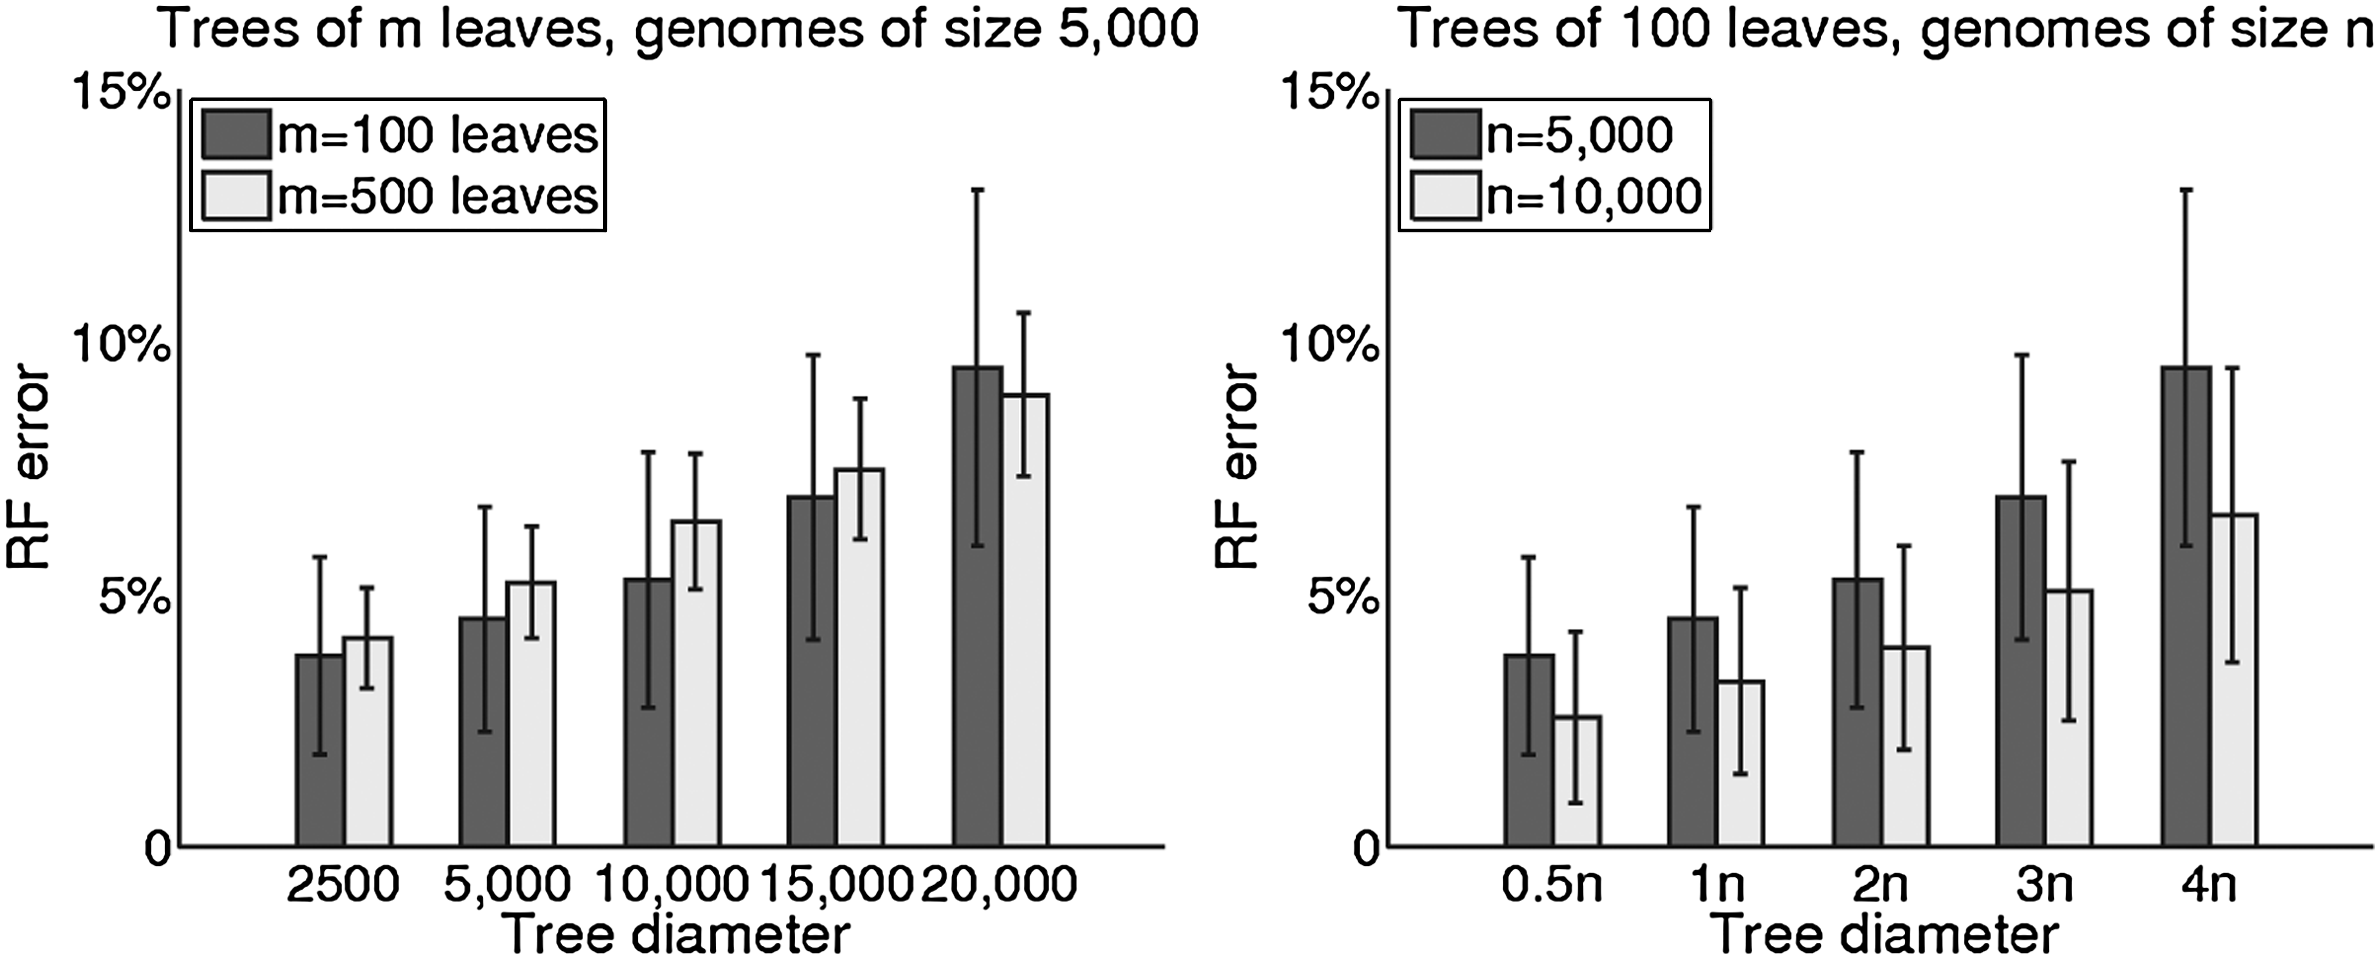
RF error rates on trees of 100 and 500 leaves with genomes of size 5,000
The corresponding average branch-length errors are shown in Figure 2. Interestingly, the average error in branch length grows more slowly that the RF error rate with increasing evolutionary diameters.

Average branch length error on trees of 100 and 500 leaves with genomes of size 5,000
Overall, these simulations (and many others not shown) confirm that the high precision of our distance estimator makes it possible to reconstruct accurate phylogenies with what is perhaps the simplest of all reconstruction methods, and certainly one of the fastest.
6.2. A dataset of high-resolution vertebrate genomes
Figure 3 shows the reconstructed phylogeny of 5 mammals and chicken, along with bootstrap scores for the 3 internal edges of the tree. Building this phylogeny and computing the bootstrap scores (using 100 replicates built with a 10% perturbation rate) took under a second of computing time on a desktop computer. Moreover, the tree is much as expected: the two edges on which the community agrees have perfect bootstrap support, while the more controversial edge creating a primate-carnivore clade has low support—low enough, by normal standards, to be considered untrustworthy. Many studies (Madsen et al., 2001; Murphy et al., 2001; Amrine-Madsen et al., 2003) and most current trees place primates in a clade with rodents rather than with carnivores, although a number of studies support the topology in our figure (Huttley et al., 2007; Wildman et al., 2007; Cannarozzi et al., 2007). Rearrangement data cannot be used at this early stage to settle the rodents vs. carnivores question, but it is encouraging to see that the reconstruction agrees with studies based on sequence data, both on well supported and on poorly supported edges.

Reconstructed phylogeny of man, rat, mouse, opossum, dog, and chicken (dotted edges indicate long branches not shown at scale).
The excellent scaling properties of our method and its support for bootstrapping mean that it is now possible to study the use of rearrangement data in phylogenetic reconstruction, so as to improve our understanding of the evolutionary processes at work, parameterize the model, and eventually make whole-genome rearrangement data into a source of information for systematics on par with today's sequence data.
6.3. Simulation studies of the bootstrapping method
Figure 4 shows the distribution of bootstrap scores for false positives (edges present in the inferred tree but not in the true tree) on the left and for true positives (edges that appear in both the inferred and the true trees) on the right, binned into three categories: well supported edges (with scores above 90%), poorly supported edges (with scores below 75%), and candidate edges in a “gray” zone of support (75–90). The percentages on the vertical axis indicate the distribution of false (on the left) or true (on the right) positives into these three bins. As expected, larger perturbations reduce the support for false positives, but they also reduce the support for true positives. However, the increase in the number of false positives that are placed in the “poorly supported” bin (below 75%) on the left is much more pronounced than the decrease in the number of true positives placed in the “well supported” bin (over 90%) on the right, indicating that perturbation rates as high as 15–20% remain quite usable.
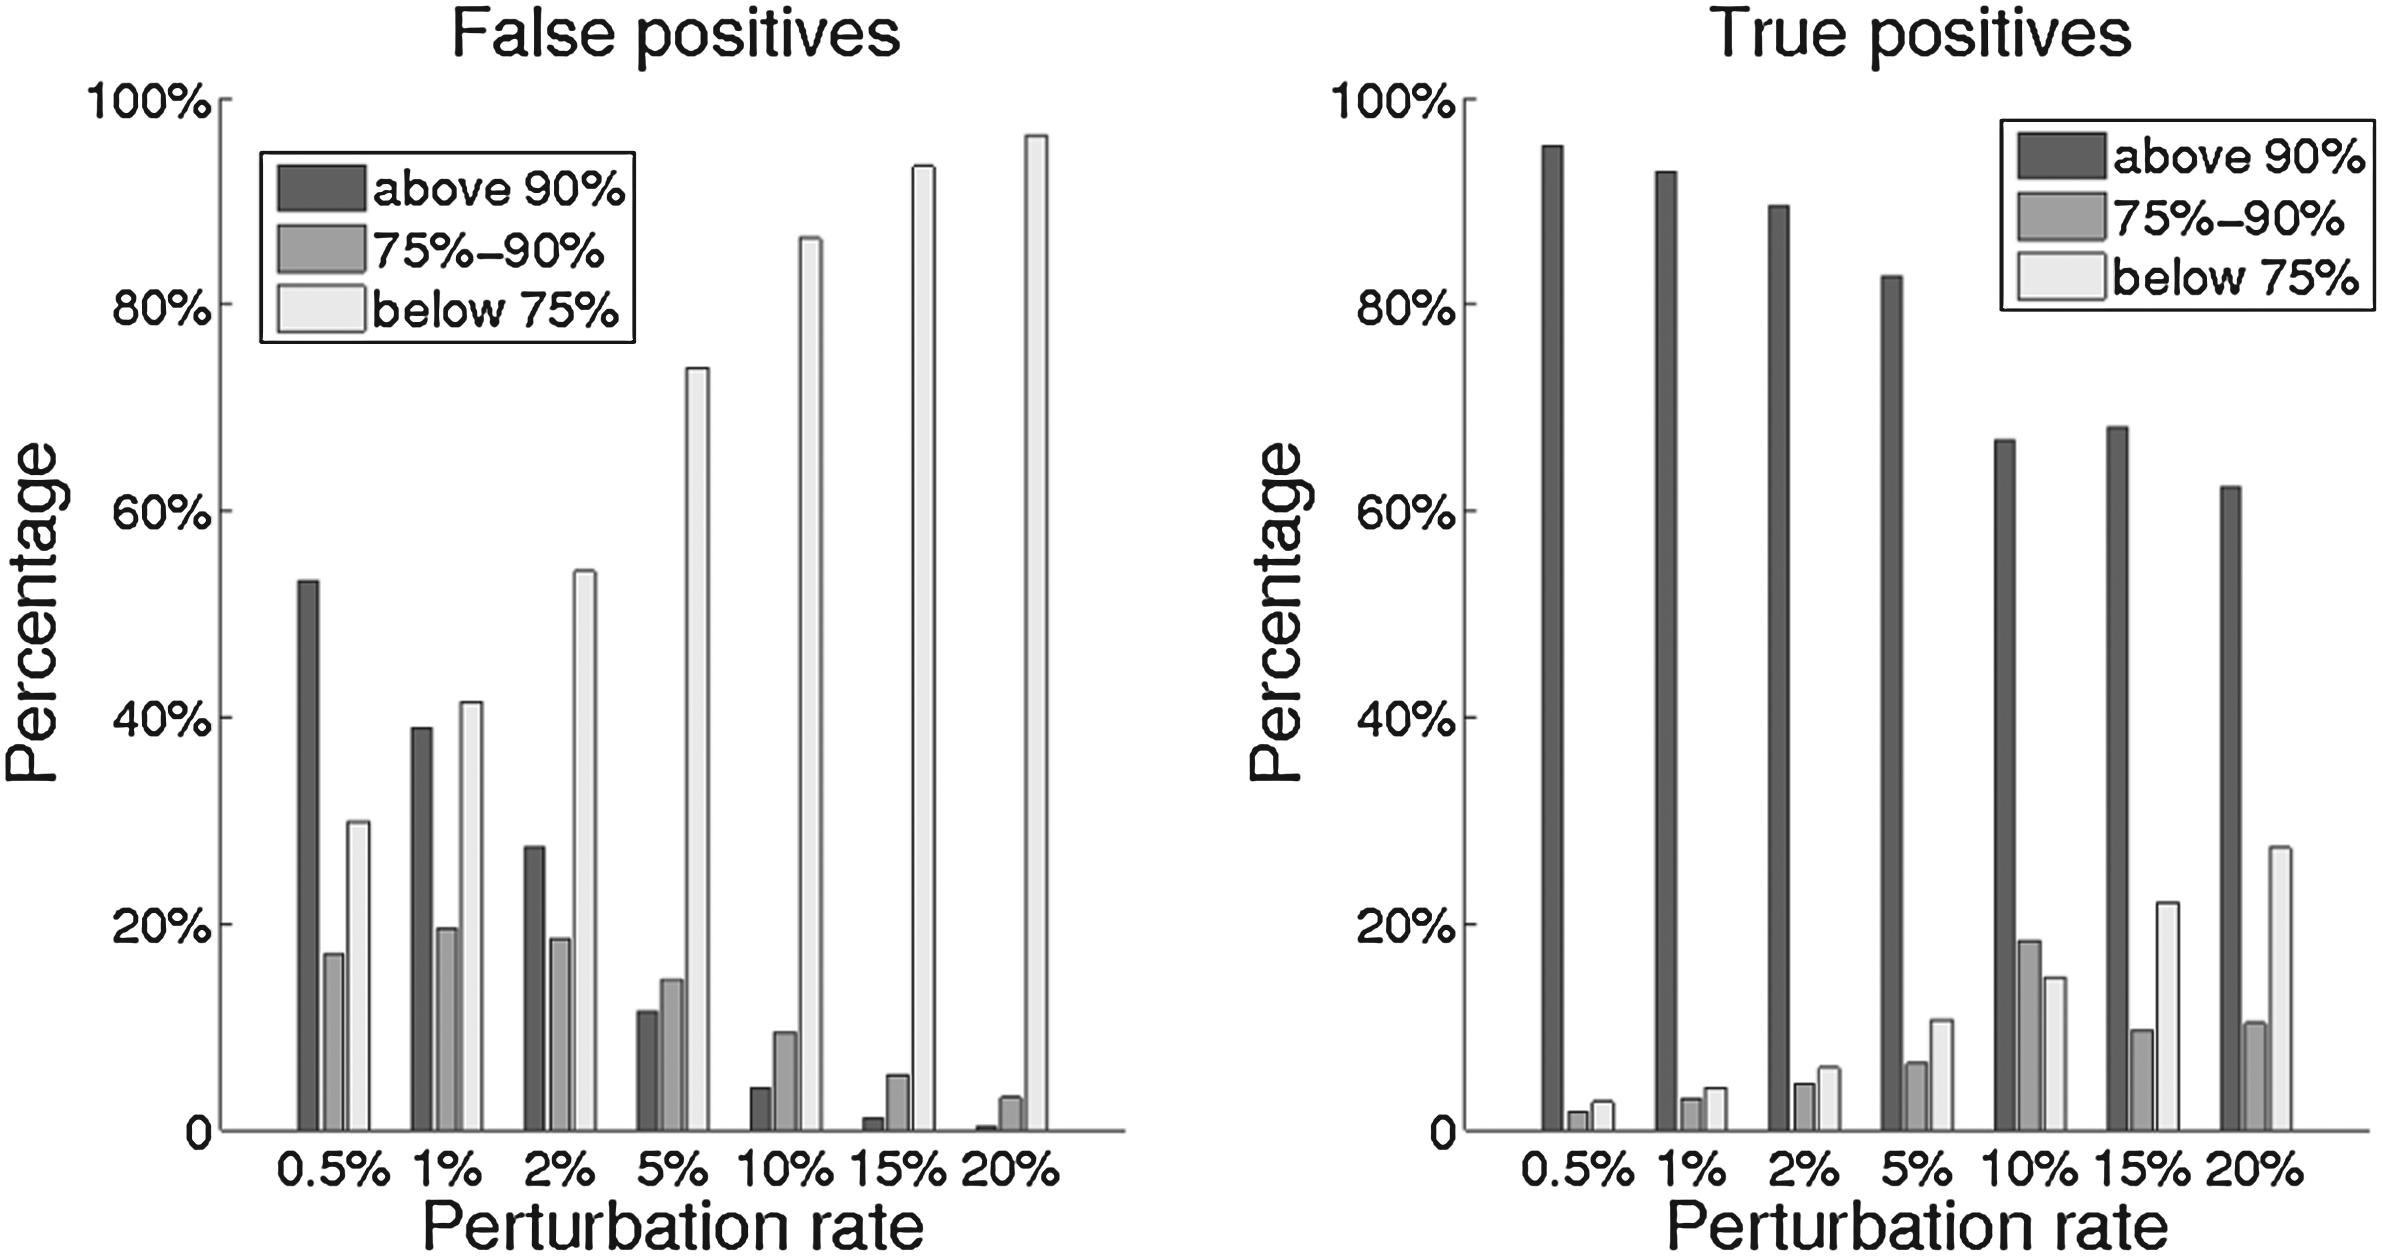
Distribution of bootstrap scores for false positives
The Receiver-Operator-Characteristic (ROC) curve in Figure 5 (left) clarifies the issue, showing that changing the level of perturbation simply traces a curve in the ROC space. In this plot, a point is a particular bootstrapping test, defined by its sensitivity and specificity; in the system of coordinates of our figure, therefore, a perfect test would yield a point at the upper left-hand corner of the diagram. Let E be the set of edges in the true tree. The set Tt defined for a threshold t consists of those edges in the inferred tree which are contained in more than t% of the bootstrap trees. Sensitivity is the proportion of true edges that are also in Tt, |Tt ∩ E|/|E|, while specificity is the proportion of edges in Tt that are true edges, |Tt ∩ E|/|Tt|. In our figure, each perturbation rate is represented by 6 points, obtained by selecting values of 95, 90, 85, 80, and 75 for the threshold t. The curve shows that larger perturbations are better at specificity but worse at sensitivity. To keep false positives really low and just lose a few true positives one can achieve a trade-off at around 10% perturbation rate.

ROC curve
Finally, the plot of bootstrapping scores vs. RF distances in Figure 5 (right) shows that trees with high average bootstrap scores are indeed very close to the true tree. That is, regardless of the choice of perturbation rate and its implications on the sensitivity, the average bootstrap score shows a negative correlation with the RF distance. (The data shown in Figure 5 is for a perturbation rate of 10%.)
7. Conclusion
We have described a very fast, distance-based, phylogeny reconstruction method for high-resolution rearrangement data and a matching bootstrapping procedure. Both take advantage of some of the unique characteristics of whole-genome rearrangement data, given in terms of syntenic blocks: the absence of duplicates, the equal content among all genomes, and, most importantly, the lack of both homoplasy and saturation in such data, especially when used with high-resolution data. Our simulations demonstrate the accuracy of the reconstruction method and the usefulness of the bootstrapping procedure, and a proof-of-concept application to a small collection of high-resolution vertebrate genomes yields results in line with current findings.
Our methods scale to data of very high resolution (tens of thousands of syntenic blocks) and, because of the very fast running times of distance methods, to large collections of genomes. Therefore, they can be used to study rearrangement data and deepen our understanding of the evolution of the genome, as well as to turn rearrangement data into a genuine source of phylogenetic information.
Footnotes
Acknowledgments
We thank Wei Xu for sharing the vertebrate data and Xiuwei Zhang for many helpful comments.
Disclosure Statement
No competing financial interests exist.