




Abstract
Abstract
1. Introduction
To date, the genomes of some 860 bacterial species are available, and 21% have at least two sequenced strains. Closely related genomes can be compared by means of different methods. Among them, alignments of whole genome DNA sequences, at the nucleotide level, allow the study of both coding and non-coding regions. Hayashi et al. (2001) compared the complete genomes of the enterohemorrhagic Escherichia coli O157:H7 Sakai strain and the E. coli K-12 MG1655 laboratory strain. Analysis of the alignment result showed that a sequence corresponding to about 80% of the genome length is highly conserved between the two E. coli strains. This sequence, termed backbone, is interrupted by several DNA fragments that are not conserved in the two strains and that are called variable segments. The backbone/variable segment structure is named segmentation or mosaic structure of bacterial genomes (Hayashi et al., 2001; Chiapello et al., 2005).
Determination and analysis of the segmentation are critical to study the molecular mechanisms implicated in the dynamics of bacterial genome evolution. It has been shown that segments from the backbone are enriched in functional DNA motifs and hence, are particularly relevant to infer them (Goto et al., 2007). In addition, sequences from the backbone may correspond, in a large part, to the common ancestral chromosome of the compared strains (Touchon et al., 2009). Variable segments that may correspond to strain specificities are often associated with DNA exchange and mobile elements such as transposons or prophages (Canchaya et al., 2004). They can be used to investigate biological issues dealing with bacterial physiology and pathogenicity (Prentice, 2004). The nature and origin of variable segments are diverse. They can be either strain specific or just too divergent to be identified as homologous. A detailed description of variable segment diversity can be found in Touzain et al. (2010). Determination of the backbone/variable segment structure directly influences all the subsequent analyses and thus needs to be obtained with accuracy.
Segmentation computation mainly relies on the alignment of complete genome sequences (Chiapello et al., 2005). Aligning sequences containing several million of nucleotides is a challenging task that requires to have specific algorithms. Moreover, besides the length of the sequences, the main difficulty comes from the fact that bacterial genomes evolve through various genetic mechanisms including point mutations, genetic rearrangements and horizontal gene transfers, thus generating extremely dynamic genomes, even in closely related bacteria.
At the beginning of the 2000s, Miller stressed the challenges as well as the difficulties to design specific algorithms to align complete genome sequences and the necessity to develop statistical methods to evaluate their reliability (Miller, 2001). To date, there are about 20 different software tools to compare and align genomes (Treangen and Messeguer, 2006). However, until now, most of the efforts have been focused on the design of fast and efficient algorithms, whereas less attention has been paid to statistically assess their consistency (Miller, 2001; Dubchak and Pachter, 2002). As a result, major problems still remain unsolved in complete genome alignment methods. Thus, for example, most of the algorithms yield a unique solution that is optimal regarding a specific algorithmic criterion whereas sub-optimal solutions, that could be biologically more relevant, are systematically ignored. Evidences of spurious alignments have also been reported (Prakash and Tompa, 2007). In addition, it has been shown that small variations in the setting of algorithm parameters can impact dramatically the alignment results (Chiapello et al., 2005). Such problems can lead to important differences between alignments produced by different algorithms (Margulies et al., 2007) and even by the same aligner (Chiapello et al., 2005).
Because complete genome aligners suffer from a lack of reliability and may produce non-robust alignments, it is critical to evaluate whether the segmentations that are derived from them are robust. There is only a limited number of studies aiming to assess the quality of genome segmentations. They are usually dedicated to evaluating the relevance of the elements that are assigned to conserved regions. Thus, for example, Prakash and Tompa (2007) developed a score to discriminate regions from the backbone that are well aligned from those that are suspiciously aligned. Swidan and Shamir (2009) proposed two measurements for quantitatively assessing the biological reliability of the backbone. One was based on the base conservation of each backbone fragment, and the other was rooted on the correspondence between gene positions and backbone boundaries. However, it is worth noting that all these approaches overlook the fact that the proposed segmentation could be non-robust.
Here we present a method to measure the robustness of segmentations obtained from the comparison of two closely related bacterial genomes. It is based on a simulation procedure that randomly perturbs the compared genomes. It allows the computation of two local scores of robustness, one at the nucleotide scale, and the other one at the segment scale. Our results show that the scores can be easily used to discriminate between robust and non-robust segmentations. Moreover, they are simple to implement and to interpret.
2. Methods
2.1. Segmentation determination
A segmentation is computed from the comparison of closely related genomes through a process that can be divided into four steps (Chiapello et al., 2005):
1. Alignment of the complete genome sequences. Specific algorithms called anchor-based aligners are generally used (Chiapello et al., 2005). They first identify all the highly conserved regions between the compared sequences. These regions are chained (i.e., they are sorted and some of them are selected to anchor the compared genomes together). The result is a succession of extremely conserved segments interrupted by more distant fragments called gaps. 2. Iteration of the anchor-based alignment on the gaps to extend the anchoring obtained in step 1. This step is optional. 3. “Last chance” local alignment. Local alignment methods are used on the remaining gaps to extend the complete genome alignment. This step is also optional. 4. Determination of segment boundaries. Anchored fragments and elements that are enough conserved to be aligned are joined together to form the backbone. The remaining gaps are considered as variable segments.
2.2. Simulation process
The robustness of a process corresponds to its capability of tolerating external and internal perturbations (Kitano, 2004). Applied to a computational method, the robustness can be defined as its ability to maintain stable results when either its parameters or input data are perturbed.
Segmentation determination is mainly based on complete genome alignment (step 1). As a result, a reliable approach to perturb segmentation computation consists in directly disturbing this crucial step. Our hypothesis is that if the alignment procedure is reliable, it will be relatively insensitive to moderate random perturbations of the aligned genomes. Especially, the modification of a subset of the conserved regions used to anchor the genome alignments should not induce major changes on the whole genome alignments.
Consequently, we decided to perturb these conserved regions. More precisely, to target these conserved regions, we used maximal exact matches (MEMs). MEMs correspond to exactly conserved sub-sequences that cannot be extended neither from their left nor from their right (Delcher et al., 1999).
We developed the following simulation procedure:
1. Retrieval of all the MEMs between the two compared genomes. Only the MEMs with a minimal length of 20 nucleotides, from both the direct and the reverse strand, are considered for perturbation, in order to avoid spurious matches (Guyon and Guénoche, 2008). 2. Random sampling of a proportion p of MEMs from the complete MEM list obtained in step 1. The value of p has to be set by the user. Both genomes are evenly perturbed with p/2 MEMs drawn from each genome. 3. Perturbation of the nucleotides corresponding to the MEMs selected in step 2. Three types of perturbations are used: (i) Deletions: a MEM sequence is simply deleted; (ii) Inversions: a MEM sequence is reverse-complemented and reinserted at the same position; and (iii) Double translocations: two MEM sequences are switched. Note that both genomes are perturbed in equal proportion. The different types of perturbations impact segmentations differently as illustrated in Figure 1, which shows the backbone coverage of the segmentations obtained when perturbing two Escherichia coli strains (K-12 and Sakai). This is not surprising because deletions only suppress MEM sequences whereas inversions and translocations can reveal new MEMs. Translocations also change MEM locations in the compared genomes, affecting differently the chaining step. The three types of perturbations were used in equal proportions. 4. Computation of a new segmentation with the perturbed genomes. Because this “perturbed segmentation” will be compared to the “original segmentation,” it is necessary to use the same method for the two segmentations (i.e., same complete genome aligner, same parameter setting). 5. Iteration of steps 2–4. The procedure is repeated N times to ensure the statistical reliability of the scores (defined in Subsection 2.3). 6. Computation of the robustness scores (see details in Subsection 2.3).
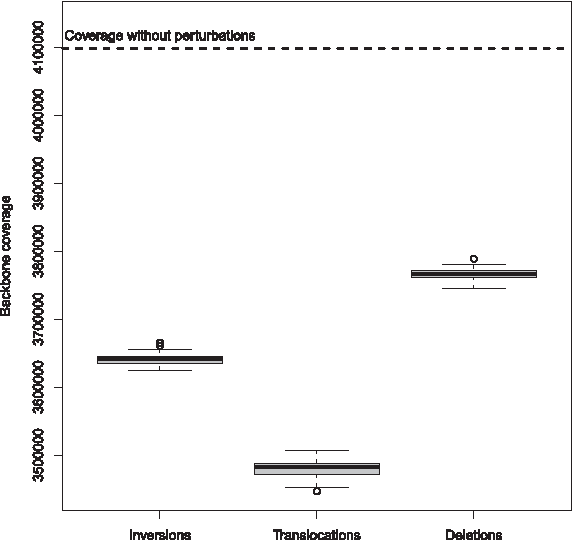
Impact of the three perturbation strategies (inversions, deletions and translocations) on the backbone coverage of the segmentation of Escherichia coli K-12 and Sakai strains obtained with MGA. In each case, perturbed genomes were obtained by applying one of the perturbation strategies on 10% of the MEMs. For each strategy, the experiment was repeated 100 times. The top horizontal dotted line provides the backbone coverage of the original segmentation (i.e., without perturbations).
2.3. Score definition
Robustness is measured from the evaluation of the differences between the original segmentation and those computed with the perturbed genomes. Two scores are derived: one focusing on the nucleotides and the other one on the segments.
The nucleotide score is computed for each nucleotide of the two compared genomes. Thus, if we consider the nucleotide i from one of the original genomes, either from a backbone or a variable segment of the original segmentation, the nucleotide score is defined as follows:
It is equal to the proportion of simulations in which the nucleotide i is assigned to a variable segment. Thus, Snuc varies between 0 and 1. If Snuc(i) is near 1, then i is likely to belong to a variable segment. Conversely, if Snuc(i) is near 0, i is likely to belong to a backbone segment.
The second score is called the segment score. Considering segment g from the original segmentation (i.e., the non-perturbed segmentation), the segment score is defined by:
where |g| denotes the number of nucleotides in segment g. It is equal to the average of the nucleotide scores of the nucleotides belonging to segment g. If Sseg(g) is close to 1 then the segment g is likely to be a robust variable segment.
2.4. Implementation
The anchor-based tool MUMmer (version 3) (Kurtz et al., 2004) was used for retrieving the MEMs from the compared genomes for the perturbation procedure. The complete simulation procedure and the score computations were performed with Perl (Perl 5.8.8). The source code is available upon request. Graphical analysis of the results was mainly done from the genome-browser MuGeN (version 20060919) (Hoebeke et al., 2003) and R (version 2.8.0).
2.5. Dataset
A high number of pairs of bacterial genomes retrieved from the MOSAIC database (Chiapello et al., 2005) were tested. Three representative pairs were selected for illustration purposes. They are shown in Table 1. The two Streptococcus pyogenes strains are very close, the Escherichia coli strains are moderately close, and the Pseudomonas syringae strains are distant. The genomic distance between these genomes was evaluated with the MUMi index (Deloger et al., 2009). Briefly, it is based on the evaluation of the cumulative size of maximal unique matches (MUMs) compared to the lengths of the compared genomes. MUMi varies between 0 and 1; the smaller the MUMi, the closer the compared genomes (Table 1).
Length, total genome length (in nucleotides); MUMi, MUMi index of the pair; #MEMs, number of MEMs of length higher than 20 bp shared by the pair.
Segmentations of these three pairs were computed using two different aligners, MGA (version 2) (Höhl et al., 2002) and MAUVE Aligner (version 1.2.3) (Darling et al., 2004). Parameter settings used for these two tools were those proposed by Chiapello et al. (2005, 2008). Table 2 summarizes the information concerning the obtained segmentations for the first strain of each pair.
These segmentations correspond to the first strain of the pairs of genomes presented in Table 1. #BS, number of backbone segments; #VS, number of variable segments; BL, cumulative length of the backbone; BC%, coverage of the backbone, i.e., ratio between the backbone length and the complete genome length in %.
3. Results
3.1. Calibration of the simulation process
In our method, two user-defined parameters have to be set: (1) the proportion p of MEMs to perturb and (2) the number N of simulations. When perturbing MEM positions in the compared genomes, we aim at maximizing the impact of perturbations in the segmentation computation procedure. In other words, we need to use a p high enough to perturb all the nucleotides belonging to a MEM at least once. However, if p is too high, some nucleotides will be systematically perturbed in all the N simulations and their score will be meaningless. As shown in Figure 2, when p ≤ 0.1 for N = 1000, almost no nucleotides are perturbed in all simulations for the three pairs of genomes. For higher values of p, the number of nucleotides that are systematically perturbed rapidly increases for the pairs P2 and P3. Consequently, we decided to set p = 0.1 for the three pairs of genomes. This analysis can be performed for any comparison of interest to select a specific value of p for each pair of genomes or, as done in this study, to determine a p value suitable for all the pairs.
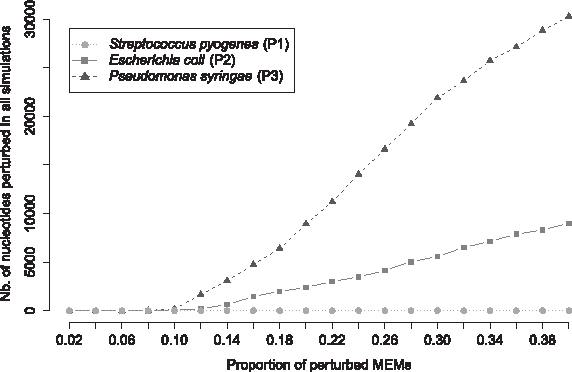
Selection of the proportion p of MEMs to be perturbed for the three pairs of genomes. Each curve gives the number of nucleotides that have been systematically perturbed in each simulation (N = 1000) with respect to the proportion p of perturbed MEMs. P1, S. pyogenes (circles), P2, E. coli (squares), and P3, P. syringae (triangles).
The computation of the scores is based on multiple simulations and requires a sufficient number N of simulations to be statistically reliable. In this work, we used N = 1000 that provided a good tradeoff between computation time and accuracy of the score.
3.2. Nucleotide score
Computation of the nucleotide scores was performed for the segmentations listed in Table 2. In each segmentation, we identified nucleotides whose score suggested that their assignment to a backbone or variable segment was highly sensitive to perturbations. To facilitate the analysis, we plotted the score for each nucleotide along the genome thus generating a score profile. Here we show different representative examples of score profiles and their interpretation.
The score profiles allow us to easily identify the robust regions. Thus, Figure 3A focuses on a region composed of a variable segment (in gray) surrounded by two backbone segments (in black), from the segmentation S3. It shows that nucleotides included in the variable segment have a score equal to 1 while those that belong to the backbone have a score around 0.1. The score profile at the boundaries of the segments is extremely sharp. This kind of profile is representative of globally robust regions. Variable segments are associated with high nucleotide scores, near 1, while nucleotides from backbone fragments have very low scores. Note that the scores of the nucleotides belonging to a robust backbone rarely reach 0 but generally vary around 0.1. This is due to the fact that most nucleotides of the backbone belong to MEMs and are therefore likely to be perturbed during the simulation process. Consequently, a nucleotide that is robustly assigned to the backbone has a score expected around the value of p. This does not mean that backbone segments are generally less robust than variable segments. The robustness score evaluates the difference between the original segmentation and the segmentations computed with the perturbed genomes. A robustly assigned nucleotide is expected to be identically assigned in the original segmentation and almost all perturbed segmentations. We suggest to consider that a nucleotide is robustly assigned if its assignment is identical in the original segmentation and in at least 90% of the simulations. Consequently, nucleotides of a robust variable segment would have scores above 0.9, and nucleotides of a robust backbone segment would have scores below p + 0.1 (0.2). Thus, the profile presented in Figure 3A suggests that this part of the segmentation of S3 is strongly robust.
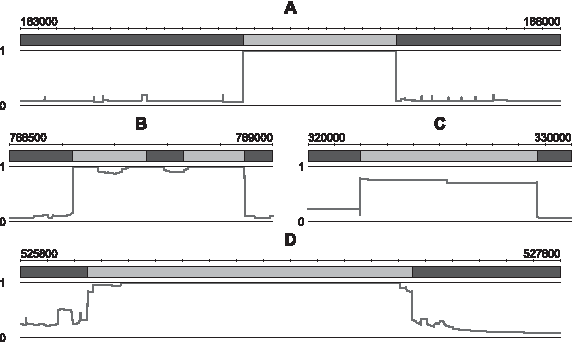
Representative examples of nucleotide score profiles. The nucleotide score is plotted below the original segmentation, in which the backbone and variable segments are represented in black and gray, respectively (see Table 2 for more details).
The nucleotide score profiles also facilitate the identification of non-robust regions. The segmentation portion displayed in Figure 3B is composed of three backbone segments and two variable segments. The nucleotides of the two surrounding backbone fragments (left and right) have a low score, around 0.1, and thus, are robustly assigned. Those from the two variable segments have score values almost equal to 1, suggesting that these two segments are robustly estimated too. The nucleotides of the backbone segment located between the two variable segments (in the middle) have scores near 1. This means that they are predicted in a variable segment in almost all the 1000 simulations. Consequently, this backbone fragment is absolutely not robust and should correspond to a variable segment. Figure 3C shows a part of the segmentation of S1. The scores of the nucleotides in this variable segment are rather low, with values around 0.8/0.7, which suggest that this variable segment is not robust. These two examples illustrate the shapes of score profiles that are obtained while considering non-robust regions. Obviously, several other situations of non-robust regions could be observed.
The nucleotide scores are precise enough to perform detailed analyses of the segmentation robustness focusing, for example, on the segment boundaries. Figure 3D shows a region composed of two backbone segments and one variable segment. Although the scores of the nucleotides of the variable segment are globally high, suggesting that this segment is robust, score profiles at the junctions of the segment are not as sharp as those plotted in Figure 3A. This implies that the nucleotides located at the boundaries of this segment are less robustly assigned than the others. Such a profile highlights the fact that determination of the junction positions between the segments cannot be always accurately determined.
3.3. Segment score
The segment score associates one score value to each segment of the original segmentation for both backbone and variable segments. Its goal is to facilitate the analysis of the global segmentation robustness.
Figure 4A displays the distribution of the segment score values obtained for the segmentation of S3. The distribution of the score values shows two distinct peaks, one for the variable segments (in gray) and one for the backbone segments (in black). Most of the variable segments have a score ranging from 0.9 to 1, and most of the backbone segments have a score ranging from 0 to 0.2. This suggests that most of the variable and backbone segments are robust. Thus, although there are few segments having intermediate score values, a rapid inspection of Figure 4A allows us to conclude that the segmentation S3 is globally robust.
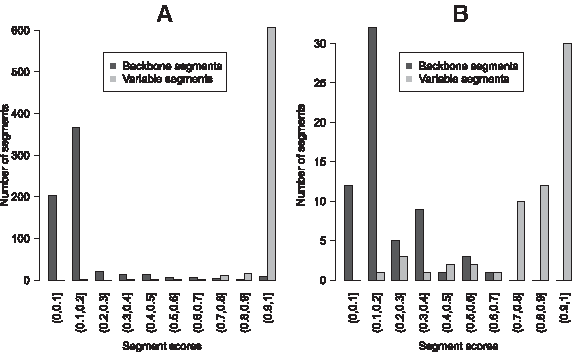
Distribution of segment score values.
This is clearly not the case for the segmentation S1 whose distributions of the backbone and variable segment scores are presented in Figure 4B. These distributions are more spread out and consequently are not well separable. Almost one third of the variable segments have a segment score value below 0.8 indicating that they are not robust. About 20% of backbone segments have a score above 0.3. This implies that they are also non-robust. Thus, examination of Figure 4B yields the conclusion that this segmentation is not globally robust.
The examples presented here clearly suggest that the segment score may be employed as an easy-to-use method to quickly evaluate the global robustness of segmentations.
3.4. Comparing segmentations from the robustness scores
Segmentation computation of a given pair of genomes using different aligners will give as many segmentations as there are aligners. Indeed, two segmentations of the same pair of genomes may yield significantly different results as shown in Table 2. In this subsection, we estimate whether or not our scores can be used to understand divergences between segmentations and can allow us to determine the best one. Comparison of the six segmentations listed in Table 2 allowed us to respond to these two queries. For each comparison, the first segmentation was computed with MGA and the second one with MAUVE. We analyzed the differences between these pairs of segmentations. To do so, we identified all the nucleotides that were assigned to the backbone in one of the segmentations while they were assigned to a variable segment in the other segmentation. Thus, we considered the two following distinct situations: (1) A nucleotide was assigned to a variable segment in the first segmentation (MGA) while it was assigned to the backbone in the second segmentation (MAUVE); (2) the reverse situation, a nucleotide was assigned to the backbone in the first segmentation while it was assigned to a variable segment in the second segmentation. For each comparison, we counted the number of nucleotides corresponding to situation 1 and 2. We also computed the average nucleotide score (see Subsection 2.3) over all nucleotides in each situation. This is summarized in Table 3.
#Nucleotides, number of nucleotides assigned by MGA to variable segments in the first segmentation but assigned by MAUVE to the backbone in the second segmentation (situation 1) and the converse situation (situation 2); Score, average nucleotide score, the score values of the nucleotides that were assigned to variable segments appear in bold.
From the score calculations, it is possible to identify segmentation errors. This is exemplified with S1 versus S2. Although S1 and S2 have almost the same number of segments, the cumulative backbone length of S2 is much higher than the one of S1 (Table 2). More than 226000 nucleotides are assigned to the backbone in S2 while they are assigned to variable segments in S1 (situation 1). Average nucleotide scores of these nucleotides indicate that the backbone assignment is more robust in S2 (average score of 0.068) than the variable segment assignment in S1 (average score of 0.755). Analysis of the non-robust variable segments of S1 revealed that these segments were associated with large overlapping MEMs. Indeed, when comparing very closely related genomes, long MEMs (>several kb) can overlap together. This induces problems in the chaining step of the alignment for MGA because its chaining algorithm discards overlapping MEMs (Höhl et al., 2002). Thus, comparing extremely close genomes with MGA might produce unexpected variable segments. Our method is able to detect this problem, assigning a low robustness to these variable segments and indicating that S2 is globally more robust than S1.
Although S4 (MAUVE) contains more segments than S3 (MGA), these segmentations have identical backbone coverage around 88% (Table 2) and thus, they are very similar. Segment score distributions of S3 and S4 reveal that these segmentations are globally robust (Fig. 4A). In this case, two similar segmentations produced by two distinct aligner tools are associated with a similar robustness score indicating that our method does not tend to favor particularly one algorithm over the other.
The robustness score is also relevant to compare the slight differences between S3 and S4. About 18000 nucleotides correspond to situation 1 and 25000 to situation 2, representing about 0.5% of the genome length in both cases (Table 3). Table 3 indicates that in both situations, variable segments are more robust, with average scores equal to 0.939 and 0.851, than backbone with average scores around 0.3. Consequently, for the nucleotides in situation 1, the assignment made by MGA (S3) is globally more robust than the one made by MAUVE (S4). Conversely, MAUVE seems to provide a more robust segmentation than MGA for the nucleotides in situation 2.
A robust segmentation does not necessary mean that it is biologically relevant. This principle is illustrated with S5 versus S6. There is a large difference between the backbone lengths of segmentations S5 and S6 (Table 2). Backbone of S6 is about 35% longer than the one of S5. However, Table 3 shows that in both situations, backbone segments have average scores less than 0.2 and variable segments have average scores greater than 0.9. This means that, in both situations, the two segmentations are robust. Consequently, from this result, it is not obvious to decide which segmentation is the best one. Investigation of these comparisons revealed that the dissimilarities were associated with rearranged regions between these genomes. Since MGA does not treat rearrangements, it systematically ignores rearranged regions and classifies them into variable segments yielding to robust, yet biologically not relevant, variable segments. It is important to note that our score is dedicated to evaluate how a segmentation is sensitive to perturbations on the original sequences. In this rather trivial example, MGA is incorrectly used, producing robust variable segments when considering conserved rearranged regions. This example shows that before computing segmentations, it is crucial to perfectly know the compared genomes and to clearly identify the limitations of the aligner tool used.
4. Discussion
For the first time, an attempt has been made to statistically assess the robustness of bacterial genome segmentations at different scales, from nucleotides to entire segments and even to the whole segmentation. The two proposed scores evaluate the robustness of a given segmentation that results from the comparison of a pair of genomes compared with a given aligner tool. They provide useful information on the studied segmentation, are easy to implement and their interpretation is intuitive. Their computation can be performed with any aligner tool and does not require any external data. We also have clearly shown that these scores are able to identify both robust and non-robust fractions of segmentations. Comparison of segmentations obtained with different aligner tools and their corresponding robustness scores provide fruitful information to identify inaccuracies.
The distance between the compared genomes is not a limitation for computing our scores. Indeed, although segmentations are usually computed on closely related genomes, the distance between the compared genomes can vary (see MUMi index in Table 1). This involves important variations in the number of MEMs that are retrieved between the sequences (see #MEMs in Table 1). However, we showed that our scores can be used in a wide range of distances between the compared genomes. As a consequence, our method can be extended to the comparison of bacterial genomes at the inter-species level, provided that the compared sequences are close enough to be aligned. Last, it is possible to adapt the method for the comparison of eukaryotic genomes, for example, by defining additional perturbation types such as duplications or transpositions, but with some limitations due to the computation time required to align such large sequences.
Although homologous regions are expected to belong to the backbone, some of them can be assigned to variable segments. Indeed, homologous regions are more or less diverged along the chromosomes. This implies that the most diverged ones can be either classified as backbone or as variable segments depending on the aligner tool used and on the parameter setting. Such regions are expected to show a low robustness.
The lack of robustness of a segmentation or a part of it can be due to different reasons. First, non-robust segments are often associated with repeated regions that are known to be often incorrectly treated by aligner tools (Dubchak et al., 2009). Problems can also arise from the chaining algorithm or from calibration of the parameters of the complete genome aligner. Indeed, variations of some parameter values, such as the minimal length of MEMs to retrieve, have an important impact on the alignment results (Chiapello et al., 2005). Last, computation of segmentations often requires the use of local alignment tools to investigate specific short regions. This step of the segmentation determination can also be at the origin of low robustness (Prakash and Tompa, 2007). The two scores proposed here do not determine directly the reason explaining the lack of robustness of a segmentation but they allow to easily identify the non-robust regions and hence, they facilitate investigations to determine the origin of this behavior.
The scores presented here can be used at a larger scale to compare and to categorize simultaneously several segmentations. They can be calculated for standalone comparisons (Hayashi et al., 2001), but they could also be directly integrated into databases that store numerous pre-computed complete genome comparisons such as xBASE (Chaudhuri et al., 2006) and MOSAIC (Chiapello et al., 2005, 2008) to provide an evaluation of the robustness of their contents. In this context, the development of a unique global segmentation score directly derived from the segment scores, and if possibly a statistical test to evaluate the significance of this latter should be useful.
Our scores raise many questions about genome structure, segmentation determination and alignment algorithms. Currently, the method is implemented only for pairwise comparisons at the intra-species level. However, further improvements are in progress to adapt the approach to multiple genome comparisons. The most challenging task is to determine the optimal number of MEMs to perturb by accounting for the combinatorial aspect that this process implies. Preliminary investigations showed that this issue can be addressed by using a subset of MEMs called “rare multiMEMs” corresponding to MEMs that are repeated a limited number of times between the compared genomes (Abouelhoda et al., 2008). Note that this combinatorial problem of repeated MEMs can also occur in pairwise comparisons when the compared genomes contain an exceptionally high number of repeats. It would be interesting to see whether this particular situation can be also addressed by using “rare multiMEMs.”
The originality of our method relies on the fact that we investigate the robustness of a segmentation rather than its biological relevance as done in other studies. Our scores are therefore complementary to other measures such as the number of backbone segments that disrupt orthologous genes proposed by Swidan and Shamir (2009) that could help to refine backbone boundaries, or the score of Prakash and Tompa (2007) to filter suspicious backbone fragments. They could even be used jointly to better assess the reliability of genome segmentations and to identify at best the different mistakes and uncertainties that arise from the computation of segmentations.
Footnotes
Acknowledgments

Disclosure Statement
No competing financial interests exist.