




Abstract
Abstract
1. Introduction
DNA barcoding is a classification problem rather than a clustering one since the classes (species) are predefined and do not have to be inferred from the data—but see Pons et al. (2006) for an application of clustering to barcoding. Barcoding assignment methods can be divided into similarity methods based on the match between the query sequence and the reference sequences such as BLAST search, phylogenetic approaches (Hebert et al., 2003; Elias et al., 2007), classification algorithms with no underlying biological models such as the nearest-neighbor method, and methods based on population genetics (Matz and Nielsen, 2005). Two Bayesian methods based on models have recently been developed. In the method of Munch et al. (2008a), species are assumed to evolve according to a phylogenetic model, while the within-species variation is not modeled. Conversely, in TheAssigner, the method of Abdo and Golding (2007), species are assumed to evolve independently, and the dependence between sequences within species is modeled using a classical population genetics model called the “coalescent.” The latter is a model for the genealogical tree of a random sample of genes drawn from a large panmictic population (Ewens, 2004; Kingman, 1982a,b; Tajima, 1983). Model-based barcoding methods raise various issues. Current methods assume that the data are mitochondrial and cannot cope with nuclear data. Moreover, their robustness to departures from model assumptions has been little studied.
The main objective of the present article is to study how to take account of nuclear data in coalescent-based classification and to study the robustness of this type of classification to departures from model assumptions. First, a coalescent-based classification for assigning individuals to species using mitochondrial data is developed (Section 3). Second, this method is extended to take account of nuclear data (Section 4). Third, the performance and robustness of coalescent-based classification are studied using simulated and real data sets (Sections 5 and 6). Finally, Section 7 provides a discussion. Supplementary Material is provided and is available online at www.liebertonline.com/cmb.
2. Bayesian classification
First we briefly review some basic material on Bayesian classification. In this method, individuals are assumed to belong to c classes. A data set y is available that includes measurements observed on reference individuals whose class is known. The objective is to predict the class
In Bayesian classification, a test individual is assigned to the class with the largest posterior probability of membership (Abdo and Golding, 2007; Munch et al., 2008a; Ripley, 1996). The assignment may be considered as ambiguous if the latter probability does not exceed some specified threshold. According to Bayes theorem, the posterior probability that a test individual belongs to class i is equal to P(z = i|y,x) = P(z = i,x|y)/P(x|y) = ri/Σ
k
r
k
, where:
In this equation, P(z = i|y) is the probability that the test individual belongs to class i given the reference data y prior to the knowledge of x and plays the role of a prior probability of membership. The probability P(x|y, z = i) is the conditional probability that an individual sampled in class i has data x. Bayesian classification is optimal for the 0—1 loss function (Ripley, 1996) and provides a measure of assignment confidence.
3. Species Assignment with Mitochondrial Data
We now apply Bayesian classification to DNA barcoding. In this section, the data consist of mitochondrial DNA sequences. The assumed demographic model is a set of isolated and panmictic species with a common ancestry at a given time in the past (i.e., the divergence time). This demographic model is the same as the one of Abdo and Golding (2007). The mitochondrial locus is assumed to evolve according to the coalescent model within each species independently. Following the standard coalescent, it is assumed that species sizes do not vary over time, that there is no migration between species and that all alleles are neutral. All individuals are assumed to be sampled at the same time and the species of any test individual is assumed to be represented in the reference data y. In this model, mutations occur on each ancestral lineage of species i according to a Poisson process with parameter θ i /2. The assumed mutation model is the infinitely many-sites model (ISM), in which a gene is considered as an infinitely long DNA sequence and each new mutant site is sampled uniformly and independently along the sequence (Ewens, 2004). Finally, it is assumed that at each site it is known which base is the mutant base or the ancestral base (see Section 7) and that there are no missing data or errors in the data.
The mutation parameters θ
i
are first assumed to be known. Then, under the assumption that species evolve independently, the probability P(x|y, z = i) in (1) is equal to:
where yi denotes the data of species i in the reference data base. This probability will be written for simplicity as P(x|yi) in what follows. Generally, it cannot be calculated explicitly under the ISM but it can be estimated as follows. It is equal to (De Iorio and Griffiths, 2004) (see Supplementary Material A at www.liebertonline.com/cmb):
where P0 is the probability of an unordered sample, n i is the number of genes in the sample of species i and ni(x) is the number of genes with sequence x in the sample of species i. The probabilities P0(x, y i ) and P0(y i ) can be estimated using importance sampling (IS) (De Iorio and Griffiths, 2004) (see Supplementary Material A at www.liebertonline.com/cmb). Note that the probability P0(y i ) needs to be estimated only once if there are several individuals to assign.
Mutation processes are generally unknown for most species and the vector θ of mutation parameters is thus usually not known. In this case, the posterior probabilities of membership can be estimated by plug-in, that is by assuming that θ is known and equal to an estimate
4. Species Assignment with Mitochondrial and Nuclear Data
Individuals are now assumed to be genotyped at l diploid nuclear loci in addition to the mitochondrial locus. The two sequences of an individual at a nuclear locus are assumed to be known (see Section 7). The genetic data of a test individual are denoted by
With independent loci, the quantity ri in (1) is equal to (Ripley, 1996):
where
where δj = 0 if the test individual is heterozygote at locus j and δj = 1 if the test individual is homozygote at locus j. In this equation,
5. Simulation Study
Simulations were carried out to assess the methods described above. In these simulations, one ancestral species split T generations ago into two new species with effective size Ne and mutation parameter θ. There were n reference individuals in each species. First sequences were simulated for a mitochondrial locus and a diploid nuclear locus to study the effect of adding nuclear data. Then to test the robustness of the methods developed, mitochondrial sequences were simulated assuming that species size varied over time or that each species was divided into several populations exchanging migrants. To mimic extreme sampling strategies that can be done in structured populations, we considered an “extended” sampling, in which the reference individuals were sampled in all populations for each new species, and a “clustered” sampling, in which all reference individuals were sampled from a single population in each new species. Details on these simulations are presented in Supplementary Material B at www.liebertonline.com/cmb.
The simulated data were analysed with the nearest-neighbor classification (1NN) and the developed Bayesian assigner (BA) (see Supplementary Material B at www.liebertonline.com/cmb). The 1NN method was used because it had been found to be efficient compared with other barcoding methods (Austerlitz et al., 2009) and it was expected to be robust since it was not based on a specific biological model. This method was implemented with bagging in order to obtain a measure of confidence for an assignment (Hastie et al., 2001) (see Supplementary Material B at www.liebertonline.com/cmb). Assignment performance was quantified using sensitivity and specificity (Munch et al., 2008a,b). Specificity is the fraction of non-ambiguous assignments (see Section 2) that are correct. Sensitivity is the fraction of all the assignments that are correct.
The simulations with nuclear data first showed that performances were the best for the combination of the mitochondrial and the nuclear data, intermediate for the mitochondrial data (Fig. 1), and the least good for the nuclear data alone (see Figs. S2 and S3 in Supplementary Material at www.liebertonline.com/cmb). The poor results for the nuclear data alone were probably due to the larger effective size we used for the nuclear locus, leading to smaller scaled divergence times T/Ne and thus lower levels of differentiation between the two new species. Nevertheless adding nuclear data clearly increased sensitivity (Fig. 1). This was mainly due to a reduction of the number of ambiguous assignments since specificity did not increase much (Fig. 1). Our simulations also showed that 1NN and BA had similar performances, except for the nuclear data alone for which 1NN had a low sensitivity (see Fig. S3 in Supplementary Material at www.liebertonline.com/cmb). However, we can note that BA had more ambiguous assignments than 1NN but made fewer errors among the non-ambiguous assignments (Fig. 1). Another important result was that the estimation of mutation parameters did not change the BA performance much (see Fig. S1 in Supplementary Material at www.liebertonline.com/cmb). Finally and as it was expected, increasing the values of θ, T or n improved the performance of both methods as in Austerlitz et al. (2009).

Effect of adding nuclear data on the performance of coalescent-based barcoding. Specificity is the fraction of non-ambiguous assignments that are correct. Sensitivity is the fraction of all the assignments that are correct. The probability threshold is the threshold used to decide if an assignment is ambiguous. 1NN and BA are the nearest-neighbor classification and the developed Bayesian assigner with a known value of θ. The subscripts m and mn denote the mitochondrial data and the combination of mitochondrial and nuclear data, respectively. Adding nuclear data increases sensitivity and reduces the ambiguity of assignments.
For past population size variations, the main results were that past expansions strongly increased specificity, sensitivity and the rate of non-ambiguous assignments, whereas past contractions had the opposite effect of decreasing specificity and sensitivity (Fig. 2). Our simulations also showed that past expansions affected both methods similarly, but 1NN always showed a slightly better performance than BA. On the contrary, it is interesting to note that the effect of past contractions was more pronounced for 1NN than for BA, resulting in much better performances for BA. Finally, the effect of past population size variations was found to be important for all the growth rate values we used and to be stronger for expansions than for contractions.

Robustness of coalescent-based barcoding to past population size changes and population structures. 1NN and BA are the nearest-neighbor classification and the developed Bayesian assigner with estimated mutation parameters. Results for past population size changes are presented on the first two lines, with Gf being the growth factor. A growth factor larger than one indicates a population expansion from divergence to present, whereas a growth factor smaller than one indicates a population decline. Results for population structures are presented on the last two lines, with Nm being the number of migrants exchanged between adjacent populations in one generation. BA appears robust since its performance is similar to the one of 1NN that is model-free.
The effect of population structure was more complex because it depended on the sampling strategy. Compared with the unstructured species results, a population structure with a weak migration mainly affected sensitivity and the rate of non-ambiguous assignments, that both increased for the “clustered” samples and decreased for the “extended” samples (Fig. 2). This result was unexpected as the population of origin of a test individual was represented by two individuals in the reference samples for the “extended” samples but not for the “clustered” samples. Finally, we note that population structure affected both methods similarly and that the effect of population structure became noticeable only when migration was weak enough.
6. Analysis of Real Data Sets
We chose to test our method on two different data sets that contained both differentiated and undifferentiated species. The first data set used came from the study of Hebert et al. (2004) on Astraptes species and consisted of mitochondrial sequences (CO1 locus). The second data set used came from the study of Elias et al. (2007) on Ithomiinae species and consisted of mitochondrial (CO1 locus) and nuclear data (EF1α locus). The data were analysed with 1NN, BA and TheAssigner (Abdo and Golding, 2007). The performance of each method was quantified using a leave-one-out analysis in which each haplotype was used as a test sequence after reducing its multiplicity by one in the reference data. Details on these data sets and their analyses are given in Supplementary Material C at www.liebertonline.com/cmb.
The results first showed that adding nuclear data reduced the ambiguity of the BA assignments (Fig. 3). The analyses also showed that no method had the highest specificity in all cases (Fig. 3). Moreover BA had a lower sensitivity than the other methods and thus assigned fewer individuals (Fig. 3), except for the nuclear Ithomiinae data alone (see Fig. S4 in Supplementary Material at www.liebertonline.com/cmb). Another result of our analyses was that some posterior probabilities of membership were sensitive to the choice of the ancestral bases (see Supplementary Material C at www.liebertonline.com/cmb). Finally a few conditional probabilities were estimated with the predictive method (see Supplementary Material A at www.liebertonline.com/cmb) and the corresponding estimates were close to the plug-in estimates.
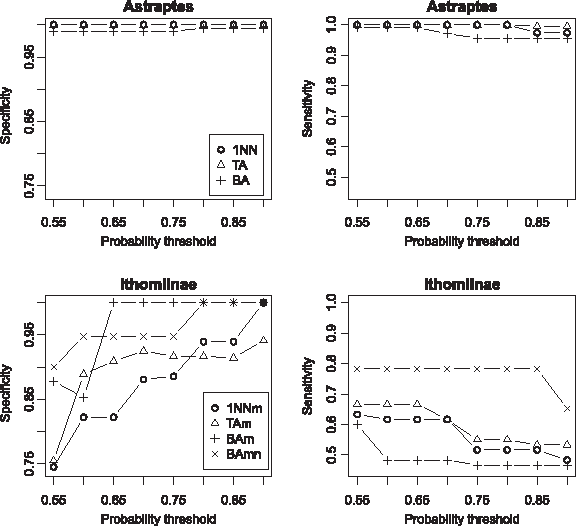
Performance of coalescent-based barcoding with real data. 1NN, TA, and BA are the nearest-neighbor classification, The Assigner, and the developed Bayesian assigner. The subscripts m and mn denote the mitochondrial data and the combination of mitochondrial and nuclear data. Adding nuclear data increases sensitivity and reduces the ambiguity of BA assignments. No method has the best specificity for both data sets.
7. Discussion
Classification inputs
Bayesian classification requires prior probabilities of membership. When these probabilities are not known, they may be estimated from the reference data provided that these data can be considered as a random sample among all the species considered (Ripley, 1996) or they may be fixed to 1/c.
The developed methods require the ancestral sequence of each locus. If this sequence is not known, it can be inferred from the data (Bahlo and Griffiths, 2000; Gascuel and Steel, 2010), or posterior probabilities of membership may be estimated using unrooted trees (Tavaré and Zeitouni, 2004; Bahlo and Griffiths, 2000). Moreover, many sequences from the barcoding reference database could be used as outgroups and thus greatly facilitate the inference of the ancestral sequence.
Finally, both alleles of an individual at a nuclear locus were assumed to be known. Current genotyping technologies are able to determine which two bases are present at each site of a nuclear locus but not the two sequences of the locus. It is a general problem for most nuclear sequence analysis methods, and statistical methods, known as phasing methods, can infer these two sequences from unphased data together with missing data (Scheet and Stephens, 2006).
Classification assumptions
The mutation model considered in this article was the ISM, a model that requires fewer computations than models with a finite number of sites. However, it assumes that a particular mutation can only occur once so that in particular there is no homoplasy. It is more adapted to situations where species are closely related, since the assumption of absence of homoplasy is more likely to be satisfied in this case. This does not seem to be a problem for DNA barcoding since species that are distantly related to a test individual can be discarded using simpler methods (Austerlitz et al., 2009; Munch et al., 2008b). In our study, classification methods were compared using data sets that were compatible with the ISM so that all the methods had the same amount of information. Species classification based on the ISM could be extended to account for different mutation rates for transitions and transversions.
The species of a test individual was assumed to be represented in the reference data. The conditional probabilities of an allele P(x|yi) can be used to check if this assumption is satisfied: low probabilities are an indication that this assumption may not be satisfied.
The developed methods are based on various simplifying assumptions. It would be interesting to relax some of these assumptions to improve classification performance. The program genetree can perform likelihood estimations with varying population size and population structures under the ISM (Bahlo and Griffiths, 2000). Divergence models and models that combine phylogenetic and population genetics models do not assume that species are independent (Matz and Nielsen, 2005; Pons et al., 2006).
Performance of the developed methods
The method developed to combine mitochondrial and nuclear informations appeared satisfactory. Adding nuclear data reduced the ambiguity of assignments in our analyses.
We showed that coalescent-based classification was robust to departures from demographic stability and panmixia and to designs that did not sample the within-species variation efficiently. It performed similarly to a model-free method (1NN) in the robustness study. Demographic expansion was found to increase the power of barcoding. This is an expected result, however, considering that speciation events are probably often associated with founder events followed by demographic expansions or selective sweeps on the mitochondria, it may highlight the reasons why DNA barcoding works so well with a limited sequence information.
Finally, no assignment method was found to be always the best in our analyses. Similar results were obtained by Austerlitz et al. (2009) when comparing phylogenetic and statistical methods. However, the developed Bayesian assigner generally appeared more cautious than the other methods in the sense that it assigned fewer individuals but made fewer errors among the assigned individuals.
Footnotes
Acknowledgments
We thank F. Austerlitz for helpful comments. This study was funded by the Agence Nationale de la Recherche (IFORA ANR-06-BDIV-014 and EMILE NT09-611697 projects).
Disclosure Statement
No competing financial interests exist.
References
Supplementary Material
Please find the following supplemental material available below.
For Open Access articles published under a Creative Commons License, all supplemental material carries the same license as the article it is associated with.
For non-Open Access articles published, all supplemental material carries a non-exclusive license, and permission requests for re-use of supplemental material or any part of supplemental material shall be sent directly to the copyright owner as specified in the copyright notice associated with the article.
