
Abstract
Abstract
Genome-wide linkage and association studies have demonstrated promise in identifying genetic factors that influence health and disease. An important challenge is to narrow down the set of candidate genes that are implicated by these analyses. Protein-protein interaction (PPI) networks are useful in extracting the functional relationships between known disease and candidate genes, based on the principle that products of genes implicated in similar diseases are likely to exhibit significant connectivity/proximity. Information flow–based methods are shown to be very effective in prioritizing candidate disease genes. In this article, we utilize the topology of PPI networks to infer functional information in the context of disease association. Our approach is based on the assumption that PPI networks are organized into recurrent schemes that underlie the mechanisms of cooperation among different proteins. We hypothesize that proteins associated with similar diseases would exhibit similar topological characteristics in PPI networks. Utilizing the location of a protein in the network with respect to other proteins (i.e., the “topological profile” of the proteins), we develop a novel measure to assess the topological similarity of proteins in a PPI network. We then use this measure to prioritize candidate disease genes based on the topological similarity of their products and the products of known disease genes. We test the resulting algorithm, V
1. Introduction
Despite their differences, all network-based disease gene prioritization algorithms are based on a unique principle: the association between proteins is correlated with their connectivity/proximity in the PPI network. However, recent research also reveals that networks are organized into recurrent network schemes that underlie the interaction patterns among proteins with different function (Pandey et al., 2007; Bebek and Yang, 2007). Based on this observation, we propose a topological similarity-based disease gene prioritization scheme in this article. For this purpose, we develop a measure of topological similarity among pairs of proteins in a PPI network and use the network similarity between seed and candidate proteins to infer the likelihood of disease association for the candidates.
We first discuss existing network-based disease gene prioritization approaches in Section 2. In Section 3, we present the algorithmic details of the proposed methods. Systematic experimental studies using an integrated human PPI network and the Online Mendelian Inheritance in Man (OMIM) database are presented in Section 4. These results show that the proposed algorithm, V
2. Background
In the last few years, many algorithms have been developed to utilize PPI networks in disease gene prioritization (Navlakha and Kingsford, 2010; Franke et al., 2006; Ideker and Sharan, 2008; Karni et al., 2009; Oti et al., 2006; Chen et al., 2009a; Köhler et al., 2008; Vanunu et al. 2010; Zhang et al., 2010; Wu et al., 2008; Missiuro et al., 2009; Aerts et al., 2006). These algorithms take as input a set of seed proteins (coded by genes known to be associated with the disease of interest or similar diseases), candidate proteins (coded by genes in the linkage interval for the disease of interest), and a network of interactions among human proteins. Subsequently, they use PPIs to infer the relationship between seed and candidate proteins and rank the candidate proteins according to these inferred relationships. The key ideas in network-based prioritization of disease genes are illustrated in Figure 1.
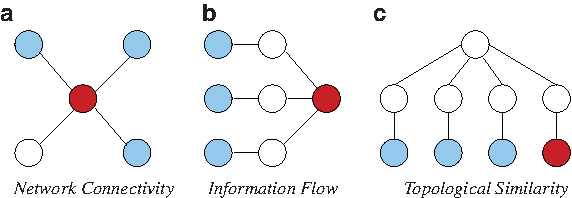
Key principles in network-based disease gene prioritization. Nodes and edges respectively represent proteins and interactions. Seed proteins (proteins known to be associated with the disease of interest) are shown in light blue, proteins that are implicated to be associated with the same disease by the respective principle are shown in dark red, other proteins are shown in white.
Network connectivity is useful in disease gene prioritization
Network-based analyses of diverse phenotypes demonstrate that products of genes that are implicated in similar diseases are clustered together into highly connected subnetworks in PPI networks (Goh et al., 2007; Rhodes and Chinnaiyan, 2005). Motivated by these observations, many studies search the PPI networks for interacting partners of known disease genes to narrow down the set of candidate genes implicated by genome-wide linkage analyses (Franke et al., 2006; Ideker and Sharan, 2008; Karni et al., 2009; Oti et al., 2006) (Fig. 1a). In one of the pioneering studies on network-based disease gene prioritization, Oti et al. (2006) identify potential disease genes by qualitatively investigating the interacting partners of the genes that are known to be associated with the disease of interest. Frank et al. (2006) extend this idea in a quantitative framework to score candidate genes based on the number of interactions between each candidate disease gene and known disease genes. These algorithms are also extended to take into account the information provided by the genes implicated in diseases similar to the disease of interest (Lage et al., 2007). Here, the similarity between diseases refers to the similarity in clinical classification of diseases.
Information flow based methods take into account indirect interactions
Methods that consider direct interactions between seed and candidate proteins do not utilize knowledge of PPIs to their full potential. In particular, they do not consider interactions among proteins that are not among the seed or candidate proteins, which might also indicate indirect functional relationships between candidate and seed proteins. For this reason, connectivity-based (“local”) methods are vulnerable to false negative and positive interactions (Pandey et al., 2010). Information flow–based (“global”) methods ground themselves on the notion that products of genes that have an important role in a disease are expected to exhibit significant network crosstalk to each other in terms of the aggregate strength of paths that connect the corresponding proteins (Fig. 1b). This approach is motivated by the following two observations: (i) multiple alternate paths between functionally associated proteins are often conserved through evolution, owing to their contribution to robustness against perturbations, as well as amplification of signals (Kelley and Ideker, 2005; Li et al., 2006); and (ii) consideration of alternate paths accounts for missing data and noise in PPI networks (Kelley et al., 2003; Koyutürk et al., 2006). Indeed, information flow–based models are also shown to be very effective in network-based functional annotation of proteins (Nabieva et al., 2005) and coexpression-based prioritization of proteomic targets (Bebek et al., 2010). These methods include random walk with restarts (Chen et al., 2009a; Köhler et al., 2008) and network propagation (Vanunu et al., 2010; Zhang et al., 2010), which significantly outperform connectivity-based methods (Navlakha and Kingsford, 2010).
Topological similarity indicates functional association
Recent research reveals that networks are organized into recurrent network schemas that underlie the interaction patterns among proteins with different function (Pandey et al., 2007; Bebek and Yang, 2007). A well-known network schema, for example, is a chain of membrane-bound receptors, protein kinases, and transcription factors, which serves as a high-level description of the backbone of cellular signaling. Dedicated mining algorithms identify more specific network schemes at a higher resolution, indicating that similar principles are used recurrently in interaction networks (Banks et al., 2008; Kirac and Özsoyoglu, 2008). Motivated by these observations, a new generation of network-based functional annotation algorithms exploit the topological similarity among proteins in the PPI network, based on the principle that proteins that interact with proteins of similar function are also likely to have similar functions (Bogdanov and Singh, 2010; Kirac et al., 2006; Kirac and Özsoyoglu, 2008). These algorithms are shown to outperform connectivity and information flow–based algorithms in annotation of biological function (Bogdanov and Singh, 2010; Kirac and Özsoyoglu, 2008). Inspired by these results, in this article, we develop a network-based disease gene prioritization algorithm that uses topological similarity to infer the relationship between seed and candidate proteins (Fig. 1c). Below, we further motivate this approach with an example from the systems biology of cancer.
Motivating example
While the APC gene has been identified to be one of the most important genes that play a role in the development of colorectal cancer, there are multiple proteins that work in parallel with Apc to create these cancers (Sjöblom et al., 2006; Wood et al., 2007). Although the actual mechanisms of selection are not clear, it is known that proteins which are not directly interacting with APC, and have similar functions in a cell—such as tumor suppressor genes PTEN (Marsh et al., 2008), TRP53 (Halberg et al., 2008), and p21 (Patel et al., 2010)—when mutated with APC, increase the tumor burden. In a recent study, Bebek et al., (2010) present a pipeline where bimodality of coexpresssion is used to prioritize proteomics targets identified in a mouse model of colorectal cancer. Some of the significant proteins identified are shown in Figure 2 in a PPI network. The identified targets HAPLN1, P2RX7 (colored purple in the figure) are linked to growth factor receptors (GFRs) (EGFR, TGFR1, FGFR1; colored blue in the figure), but not connected to each other. As seen in Figure 2, similarities of these two proteomic targets in their function and role in disease are also reflected in their relative topology with respect to APC and growth factors.
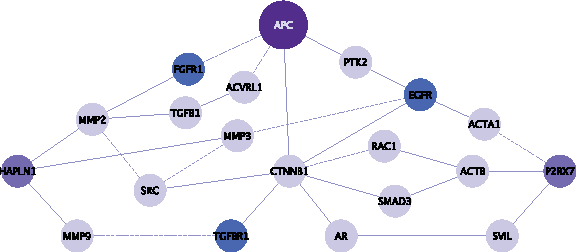
Motivating example for using topological similarity to prioritize candidate disease genes. Two PPI subnetworks connecting key cancer driver genes, APC-HAPLNI (p < 0.0068) and APC-P2RX7 (p < 0.0212), were found significant when bimodality of coexpression with proteomic targets were calculated. Darker nodes represent proteins coded by genes that carry “driver mutations.” Blue nodes represent growth factor receptors (GFRs). Although APC-HAPLNI and APC-P2RX7 do not directly interact or exhibit significant crosstalk with growth factors and products of driver genes, their relative locations with respect to these proteins exhibit similarities.
3. Methods
In this section, we first describe the disease gene prioritization problem within a formal framework. Subsequently, we formulate the concept of topological similarity of pairs of proteins in terms of their proximity to other proteins in the network. Finally, we discuss how topological similarity of proteins is used to prioritize candidate disease genes.
3.1. Disease gene prioritization problem
Let D denote a disease of interest, which is potentially associated with various genetic factors (e.g., sleep apnea, Alzhemier's disease, autism). Assume that a genome-wide association study (GWAS) using samples from control and affected populations is conducted, revealing a linkage interval that is significantly associated with D. Potentially, such a linkage interval will contain multiple genes, which are all candidates for being mechanistically associated with D (i.e., the mutation in a gene in the linkage interval might have a role in the manifestation of disease). This set of candidate genes, denoted
The aim of disease gene prioritization is to rank the genes in
In order to capture the association of the genes in
In this article, the reliability score is derived through a logistic regression model where a positive interaction dataset (MIPS Golden PPI interactions [Mewes et al., 2004]) and a negative interaction dataset (Negatome [Smialowski et al., 2010]) are used to train a model with three variables: (1) co-expression measurements for the corresponding genes derived from multiple sets of tissue microarray experiments (normal human tissues measured in the Human Body Index Transcriptional Profiling [GEO accession no. GSE7307] [Barrett et al., 2009]); (2) the proteins' small world clustering coefficient; and (3) the protein subcellular localization data of interacting partners (Sprenger et al., 2008). Co-expression values are used since co-regulated genes are more likely to interact with each other than are others (Sharan et al., 2005; Bebek and Yang, 2007). Alternatively, the network feature that we are extracting, the small world clustering coefficient, is a measure of connectedness. This coefficient shows how likely the neighbors (interacting peers) of a protein are neighbors of each other (Goldberg and Roth, 2003). We also incorporate the protein subcellular localization data into the logistic model, since this would eliminate interactions among proteins that are not biologically significant (Bebek and Yang, 2007). The logistic regression model is trained on randomly selected 1000 positive and negative training data sets for 100 times, and regression constants are determined to score each PPI.
Given
3.2. Topological similarity of proteins in a PPI network
Recent research shows that molecular networks are organized into functional interaction patterns that are used recurrently in different cellular processes (Pandey et al., 2007; Banks et al., 2008). In other words, proteins with similar function often interact with proteins that are also functionally similar to each other (Kirac and Özsoyoglu, 2008). Motivated by this observation, V
Topological profile of a protein
For a given protein
V
Random walk with restarts computes the proximity between a protein v and all other proteins in the network as follows: A random walk starts at v. At each step, if the random walk is at protein u, it either moves to an interacting partner t of u (i.e.,
Here
Note that the concept of topological profile introduced here is not to be confused by the gene closeness profile used by the CIPHER algorithm for disease gene prioritization (Wu et al., 2008). Here, topological profile is constructed using the proximity of a protein of interest to every other protein in the network. It is therefore a global signature of the location of the protein in the PPI network. In contrast, gene closeness profile is based only on the proximity of a protein of interest to proteins coded by known disease genes. Furthermore, the proposed algorithm is different from random walk–based prioritization algorithms in that these algorithms score candidate proteins directly based on random walk proximity to seed proteins (Köhler et al., 2008). In contrast, V
Topological similarity of two proteins
Let u and
where corr(X, Y) denotes the Pearson correlation coefficient of random variables X and Y. The idea behind this approach is that, if two proteins interact with similar proteins, or lay on similar locations with respect to hub proteins in the network, then their topological profiles will be correlated, which will be captured by ρ(βu, βv).
3.3. Using topological similarity to prioritize candidate genes
The core idea behind the proposed algorithm is that candidate genes whose products are topologically similar to the products of seed genes are likely to be associated with D. Based on this idea, we propose three schemes to prioritize candidate genes based on their topological similarity with seed genes. All of these schemes are implemented in V
Prioritization based on average topological similarity with seed genes (ATS)
For each
Prioritization based on topological similarity with average profile of seed genes (TSA)
Instead of computing the topological similarity for each seed gene separately, this approach first computes an average topological profile that is representative of the seed genes and computes the topological similarity of the candidate gene and this average topological profile. More precisely, the association score of
where
Prioritization based on topological similarity with representative profile of seed genes (TSR)
The random walk with restarts model can be easily extended to compute the proximity between a group of proteins and each protein in the network. This can be done by generalizing the random walk to one that makes frequent restarts at any of the proteins in the group. This is indeed the idea of disease gene prioritization using random walk with restarts (Köhler et al., 2008). This method is also useful for directly computing a representative topological profile for
if
Once α is computed using one of (3), (4), or (7), V
4. Results
In this section, we systematically evaluate the performance of V
4.1. Datasets
We test and compare the proposed methods on a comprehensive set of disease association data, using an integrated human PPI network in which interactions are associated with reliability scores. We describe these datasets in detail below.
Disease association data
The OMIM database provides a publicly accessible and comprehensive database of genotype-phenotype relationship in humans. We acquire disease-gene associations from OMIM and map the gene products known to be associated with disease to our PPI network. The dataset contains 1931 diseases with number of gene associations ranging from 1 to 25, average being only 1.31. Each gene v in the seed set
Human PPI network
In our experiments, we use the human PPI data obtained from NCBI Entrez Gene Database (Maglott et al., 2007). This database integrates interaction data from several other databases available, such as HPRD, BioGrid, and BIND. After the removal of nodes with no interactions, the final PPI network contains 8959 proteins and 33,528 interactions among these proteins. We assign reliability scores to these interactions using the methodology described in Section 2.1.
4.2. Experimental setting
In order to evaluate the performance of different methods in prioritizing disease-associated genes, we use leave-one-out cross-validation. For each gene u that is known to be associated with a disease D in our dataset, we conduct the following experiment:
• We remove u from the set of genes known to be associated with D. We call u the target gene for that experiment. The remaining set of genes associated with D becomes the seed set • We generate an artificial linkage interval, containing the target gene u with other 99 genes located nearest in terms of genomic distance. The genes in this artificial linkage interval (including u) compose the candidate set • We apply each prioritization algorithm to obtain a ranking of the genes in • We assess the quality of the ranking provided by each algorithm using the evaluation criteria described below.
Evaluation criteria
We first plot ROC (precision versus recall) curves, by varying the threshold on the rank of a gene to be considered a “predicted disease gene.” Precision is defined as the fraction of true disease genes among all genes ranked above the particular threshold, whereas recall is defined as the fraction of true disease genes identified (ranked above the threshold) among all known disease genes. Note that, this is a conservative measure for this experimental set-up since there exists only one true positive (the target gene) for each experiment. For this reason, we also compare these methods in terms of the average rank of the target gene among 100 candidates, computed across all disease-gene pairs in our experiments. Clearly, lower average rank indicates better performance. Finally, we report the percentage of true disease genes that are ranked as one of the genes in the top 1% (practically, the top gene) and also in the top 5% among all candidates.
4.3. Performance evaluation
Performance of methods implemented in Vavien and the effect of restart parameter
We compare the three different algorithms (ATS, TSA, and TSR) implemented in V

The performance of the three prioritization algorithms implemented in
Performance of Vavien compared to existing algorithms
We also evaluate the performance of V • Random walk with restarts: This algorithm prioritizes candidate genes based on their proximity to seed genes, using a random walk with restarts model (i.e., α is set to • Network propagation: This algorithm is very similar to random walk with restarts, with one key difference. In network propagation, the stochastic matrix in (1) is replaced with a flow matrix in which both the incoming and outgoing flow to a protein is normalized (i.e., • Information flow with statistical correction: Based on the observation that the performance of information flow–based algorithms (including random walk with restarts and network propagation) depend on network degree, this algorithm applies statistical correction to the random walk–based association scores based on a reference model that takes into account the degree distribution of the PPI network (Erten and Koyutürk, 2010). • Genomic Data Fusion (E
While software implementing network propagation (P
The ROC curves for the four existing methods and V

ROC curves comparing the performance of the proposed method with existing information-flow based algorithms.
V
Effect of network degree
Information flow based algorithms are previously shown to be biased with respect to the degree of the target genes (Erten and Koyutürk, 2010). In other words, these methods work poorly in identifying loosely connected disease genes. Previous efforts reduce this bias to a certain extent by introducing several statistical correction schemes (Erten and Koyutürk, 2010). Motivated by these observations, we here investigate the effect of the bias introduced by degree distribution on the performance of different algorithms. The results of these experiments are shown in Figure 5. In this figure, the change on the performance (average rank of the target gene) of different methods is plotted with respect to the degree of the target gene. As clearly seen, V

Relation between the degree of target disease gene and its corresponding rank among 100 candidates for
Detailed comparison of specific disease genes identified by each algorithm
As argued in the previous sections, information flow–based proximity and topological similarity capture different aspects of the relationship between functional association and network topology. Consequently, we expect that the proposed topological similarity and information flow–based algorithms will be successful in identifying different disease-associated genes. In order to investigate whether this is the case, we compare target genes that are correctly identified as the true disease gene by each algorithm. These results are shown by a Venn diagram in Figure 6. In this figure, each value represents the number of true disease genes that are ranked first among 100 candidates by the corresponding algorithm(s). Among 1,996 disease-gene associations, V
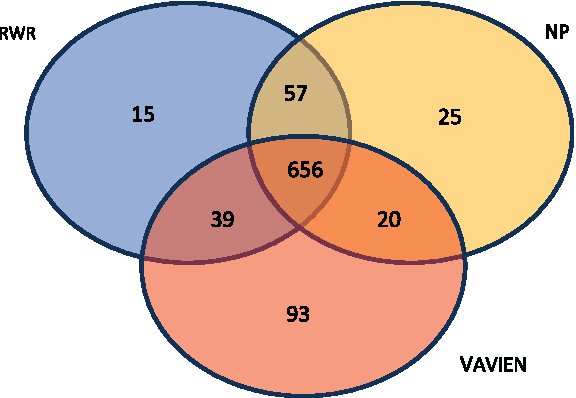
Venn diagram comparing the true disease genes ranked by each method as the most likely candidate. The sets labeled RWR, NP, and
Effect of missing and noisy interaction data on the performance of Vavien
As a final test, we investigate the effect of bias in the interaction data on the performance of V

The effect of noise and missing interaction data on the performance of different approaches. In
It is evident in the Figure 7 that all three methods are quite robust to false positives and false negatives in interaction data, without a sharp decline in performance for up to 50% of artificial bias introduced. The percentage of correct guesses decreases in all three methods for both of the tests. However, contrary to our expectation, the average rank of target gene does not show significant change for random walk with restarts and network propagation algorithms, as missing interactions are introduced (Fig. 7a). The underlying reason for this behavior might actually be their tendency to favor highly connected genes. Recall that these algorithms rank genes with high-degree very well, while they show relatively poor performance for low-degree genes. Since removal of interactions disconnect the network, low-degree proteins, which are already loosely connected, are affected more by missing interactions. Furthermore, the number of proteins with degree 0 (singletons) goes up as more interactions are removed (since most of the proteins are loosely connected in the original network). Consequently, if the target gene has a higher degree than most of the other candidate genes in the original network, many false candidates have a proximity score of 0 after removal of interactions. On the other hand, if the target gene is loosely connected, the performance of these algorithms is not affected since they also perform less favorably on such genes. Consequently, the average rank of the target gene does not increase as one would expect. However, this is not the case for rewiring experiments. In those experiments, degree distribution is preserved, and disconnected subgraphs are much less likely to be introduced in the network.
5. Conclusion
In this article, we present an algorithm, called V
Footnotes
Acknowledgments
We would like to thank Vishal Patel, Rob Ewing, and Mark R. Chance (Case Western Reserve University) for many useful discussions. We would also like to note the contribution of anonymous reviewers whose queries and suggestions have helped improve this article significantly. This work was supported, in part, by the NSF (CAREER Award CCF-0953195), the Choose Ohio First Scholarship, and the National Institutes of Health (grants P30-CA043703, UL1-RR024989, and R01- HL106798).
Disclosure Statement
No competing financial interests exist.
1
From va-et-vient (Fr.); an electrical circuit in which multiple switches in different locations perform identical tasks (e.g., control lighting in a stairwell from either end).