
Abstract
Abstract
The differential analysis of genes between microarrays from several experimental conditions or treatments routinely estimates which genes change significantly between groups. As genes are never regulated individually, observed behavior may be a consequence of changes in other genes. Existing approaches like co-expression analysis aim to resolve such patterns from a wide range of experiments. The knowledge of such a background set of experiments can be used to compute expected gene behavior based on known links. It is particularly interesting to detect previously unseen specific effects in other experiments. Here, a new method to spot genes deviating from expected behavior (PAttern DEviation SCOring—Padesco) is devised. It uses linear regression models learned from a background set to arrive at gene specific prediction accuracy distributions. For a given experiment, it is then decided whether each gene is predicted better or worse than expected. This provides a novel way to estimate the experiment specificity of each gene. We propose a validation procedure to estimate the detection of such specific candidates and show that these can be identified with an average accuracy of about 85%.
1. Introduction
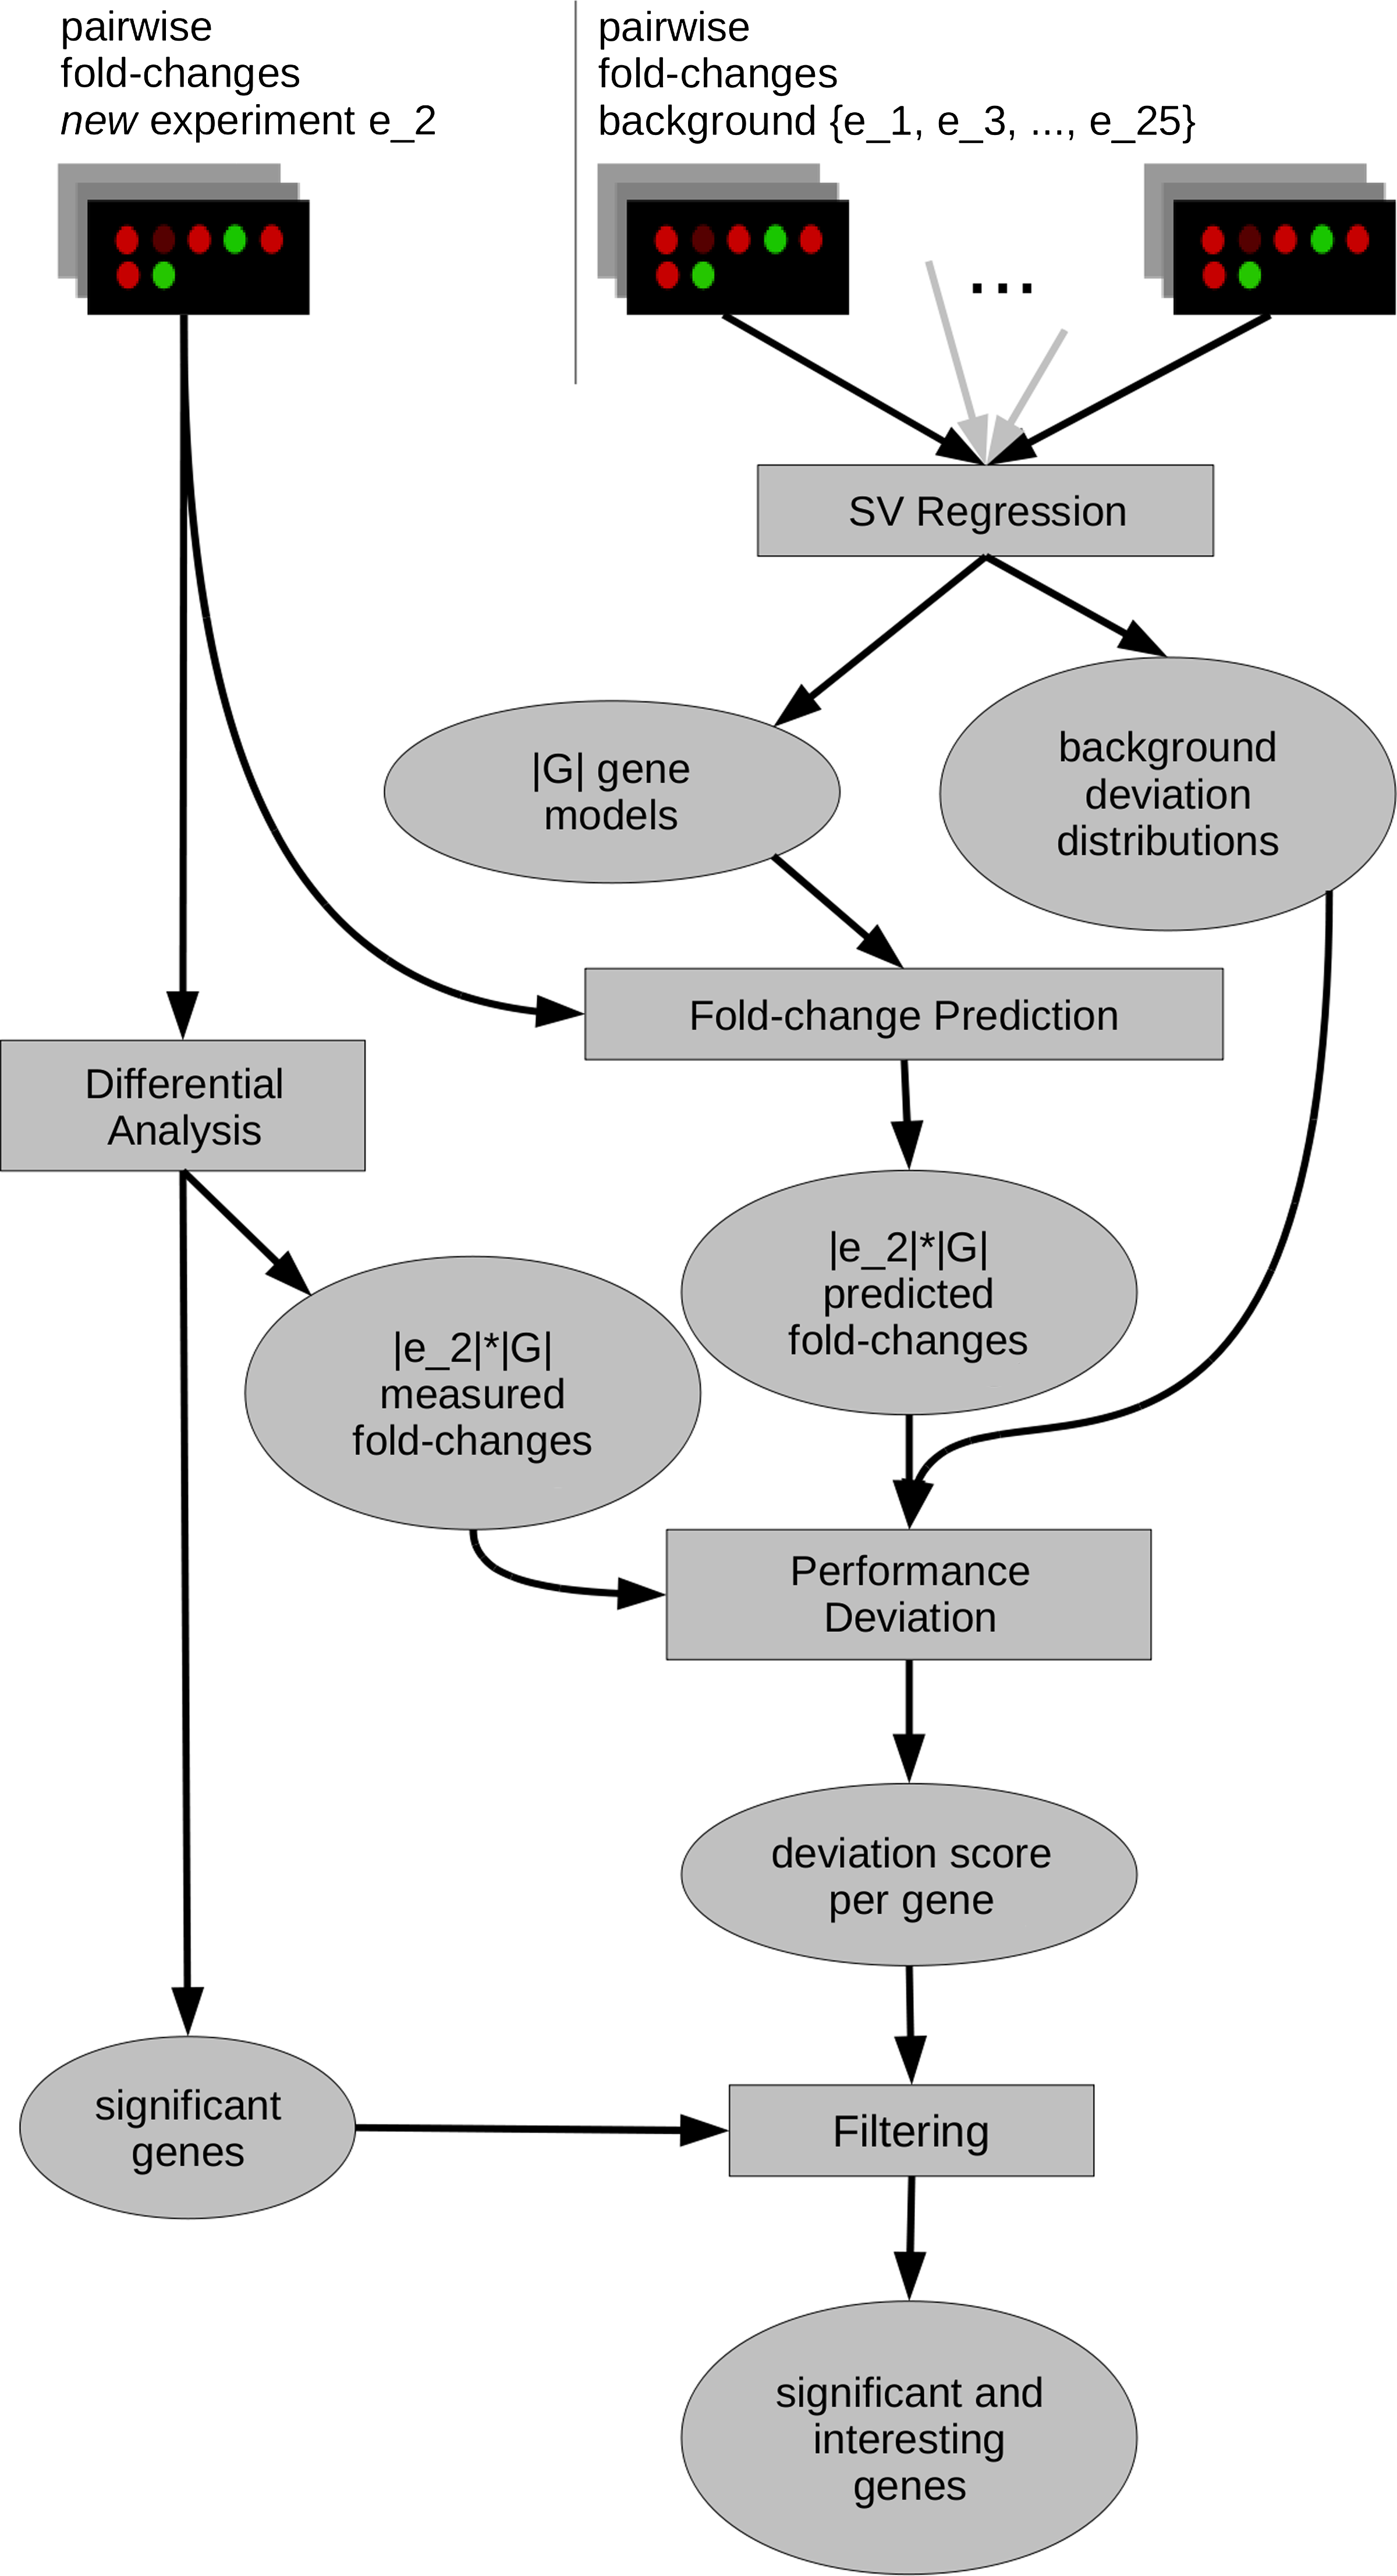
Basic structure of Padesco. A matrix F (Fig. 2) of gene expression fold-changes (fcs) is computed. A leave-one-out cross validation (LOOCV) is performed for each gene and omitting each experiment once resulting in |G|*|E| models. For a new experiment e, g's fcs are predicted with the model for (g,e) and compared to the measured fcs (residual scoring). Based on the LOOCV a deviation score (padscore) is derived. It enables deviation filtering of significant genes.
1.1. Related work
Padesco is a natural extension to co-expression approaches like Eisen et al. (1998), Rhodes et al. (2002), Lee et al. (2004), or Ucar et al., (2007) as well as residual scoring schemes like Kostka and Spang (2004) and Prieto et al. (2006). Co-expression aims to construct gene sets by clustering, or construction of co-regulated gene sets across many samples. Our trained patterns are similar, yet not identical to these previously derived co-expression patterns. Mentionable differences are the use of fold-changes rather than raw measurements and our predictivity criterion. The idea that a gene can be predicted from other genes and the prediction error may model condition-specific changes is a concept previously applied as residual scoring (Kostka and Spang, 2004; Prieto et al., 2006). To achieve meaningful residual scores, these approaches must be applied on homogeneous training data like a certain disease subtype. These scoring schemes fail on very heterogeneous experiment data. Padesco aims to bridge the gap between mere co-regulation detection and residual scoring. For heterogeneous training sets, a background sensitive view on differential experiment results is provided. The most common framework for both residual scoring and differential analysis is provided by BioConductor (Gentleman et al., 2004). In general, identified sets of differentially expressed genes maximize sample discrimination. Such markers, or gene signatures, are promising targets for further analysis. Veer et al. (2002), for instance, used gene expression profiling to identify transcription signatures for breast cancer prognosis classification. Gene expression profiles have been used by Rhodes et al. (2002) to reveal pathway dysregulation in prostate cancer. Comprehensive resources like GEO (Gene Expression Omnibus [Edgar et al., 2002]) enable the analysis of co-expression across many experiments. The comparison can for instance be quantified by measures of reproducibility in-between experiments (Garrett-Mayer et al., 2008). Padesco's linear models are loosely related to those used for imputation of missing values (IMV). Here, either data from single (Hastie et al., 1999) or multiple experiments (Hu et al., 2006) is used. To our knowledge fold-change predictions have not been applied so far. SVR has been previously used by Kim et al. (2005) for IMV.
2. Methods
2.1. Data sets
Padesco is trained on a set of experiments compiled by Lee et al. (2004). It consists of 3924 microarrays from 60 human data sets. These sets comprise 62.2 million expression measurements. They consist of at least 10 and up to 255 samples. Genes are filtered for a minimum amount of variance across samples. We restrict the data set to Affymetrix array platforms (HG-U95A, HG-U95Av2, HU6800, HuGeneFl, HG-U133A, and HG-U133comb). There is no direct necessity for a comparability of absolute expression levels since our method works on fold-changes. We restrict to a subset G of 4117 genes which occur in more than 50% of all experiments and contain at least 75% valid (i.e., non-missing) measurements. Twenty-five experiments with a total of p = 1437 microarrays fulfill this constraint. We obtain a matrix of fold-changes F by sampling p pairs of arrays (Fig. 2) from the space of all possible pairs within experiments (see Section 2.5).
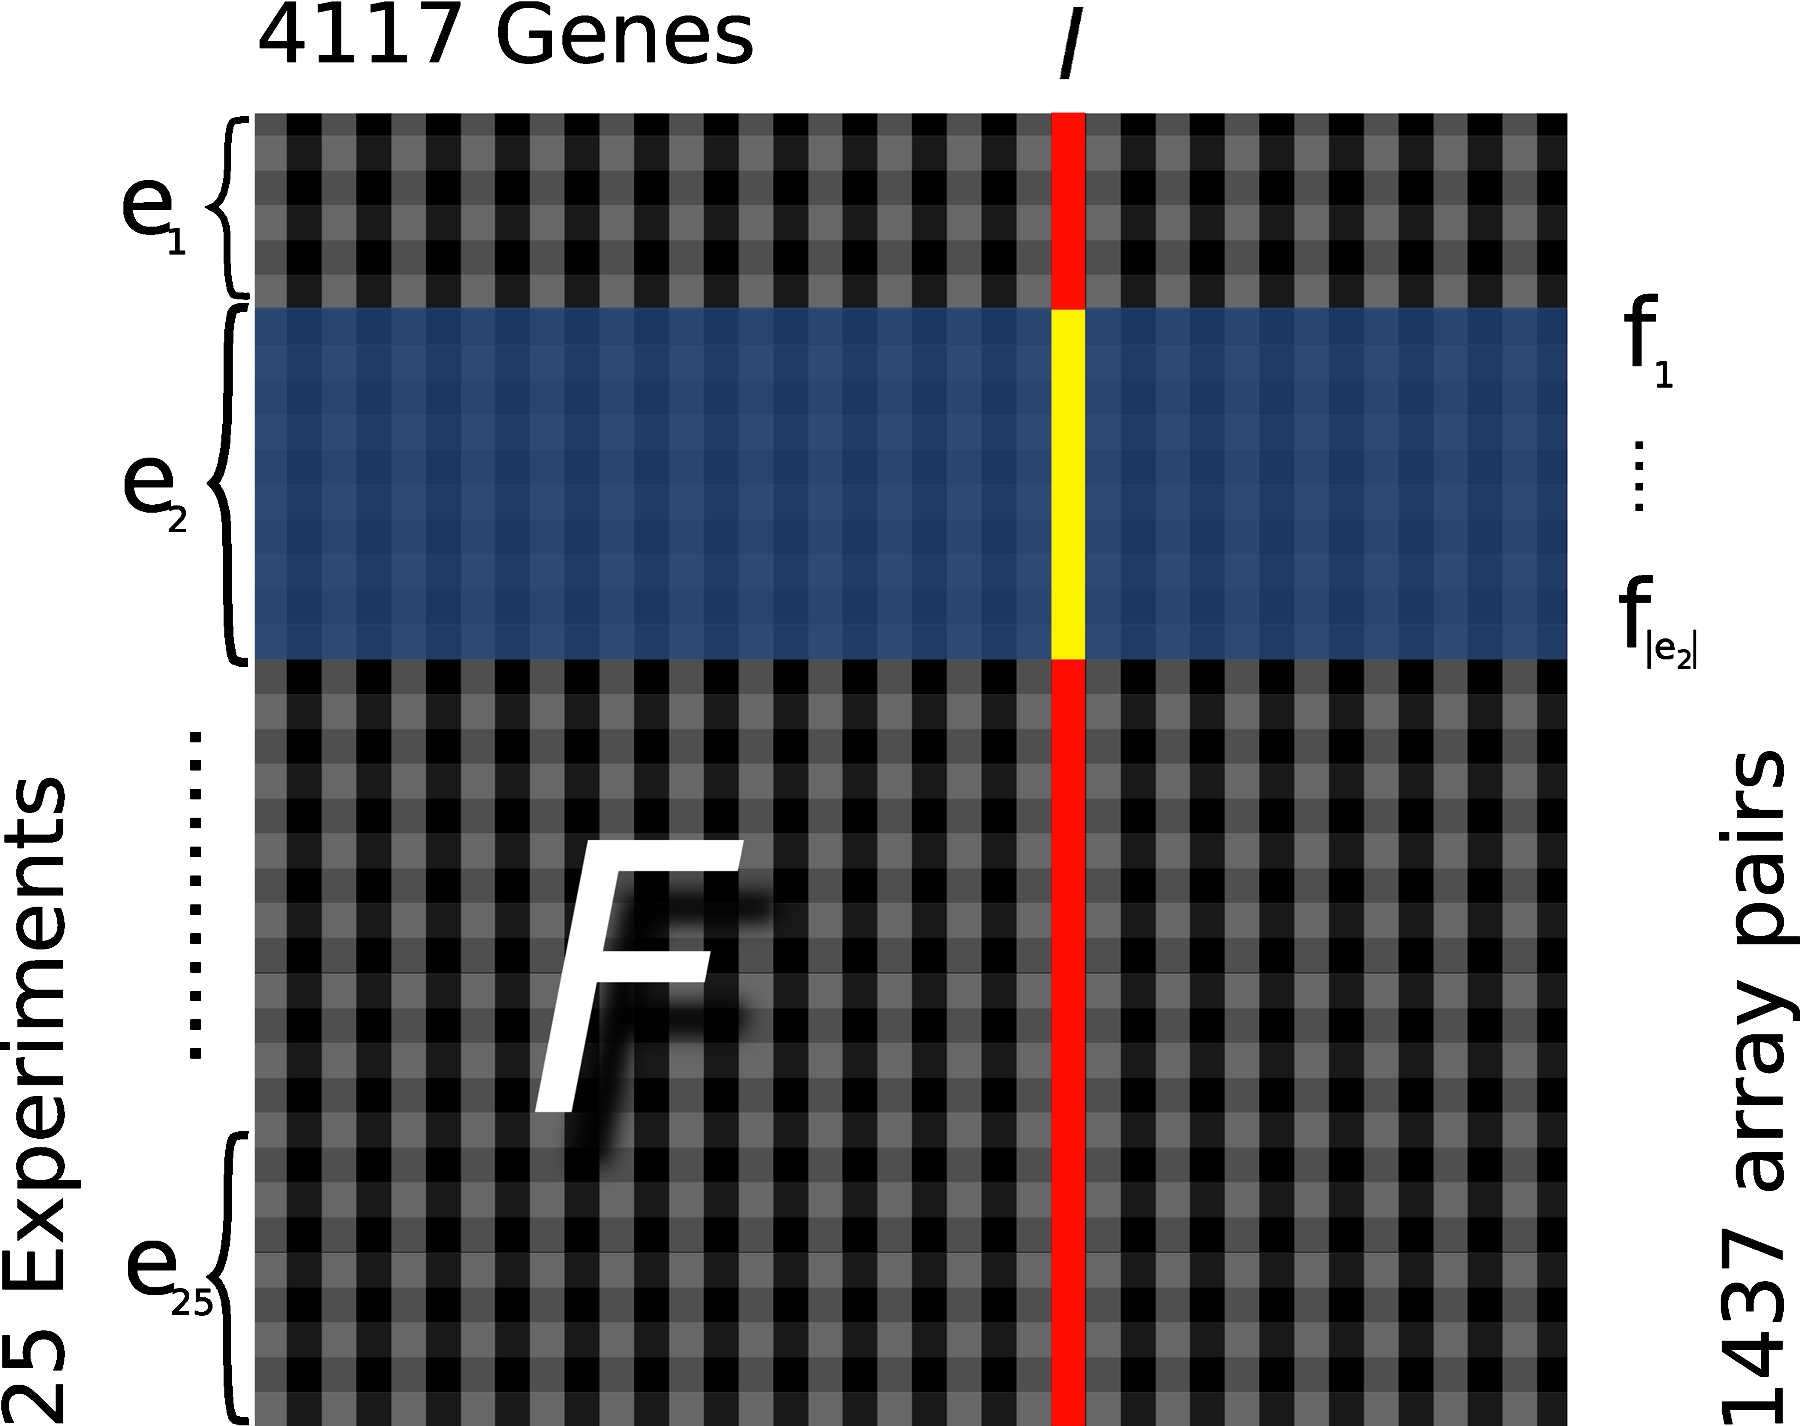
Schematic view of the fold-change (fc) matrix F. R
For 13 selected experiments, we combine arrays into sample groups (e.g., tumor vs. normal samples). This is required for differential expression analysis (see Section 2.3) that compare the expression of genes between different sample groups. Some experiments, for instance time course measurements, cannot be subdivided into sample groups but are used as background experiments. Overall, 62 sample groups have been analyzed. Comparisons are performed as one sample group versus the others from the same experiment (i.e., one comparison is performed for experiments with n = 2 sample groups and n comparisons otherwise). We thus conducted 59 comparisons in total.
2.2. Basic protocol
Padesco uses a two step approach for the selection of candidate genes from expression measurements. Prior to the application of Padesco, expression patterns must be trained on a background set bs of experiments (see Section 2.1). We apply SVR to train one model for each gene using bs (see Sections 2.4 and 2.5). Predicted labels are within-experiment fold-changes of this gene. Training features are the fold-changes of all other genes. For a new experiment (not contained in bs), Padesco selects genes by two consecutive filter steps. First, the measured genes are analyzed for differential expression (see Section 2.3) based on Wilcoxon's rank sum test (Wilcoxon, 1945). In general, any differential expression approach can be applied as Padesco does not rely on a particular method. The novel second filter step is based on an analysis of the trained regression models. Here we discard genes that conform to the patterns learned from the background experiments. We analyze the gene prediction errors using residual scoring (see Section 2.7) by comparing its predicted against the observed fold-changes. We then assess its pattern conformance in terms of the distribution of its residuals across the LOOCV as described below. We show our basic work flow in Figure 1.
To arrive at a background distribution of errors for each gene, we perform a leave-one-out cross-validation omitting each experiment once. Each fold induces |G| models. The prediction performance can thus be evaluated independently for each gene in each experiment. The background-training set for an (experiment e, gene g)-pair contains all but this experiment using the gene as dependent variable. Once trained, the application of Padesco involves only one prediction per gene using the model trained on all known experiments.
2.3. Differential analysis
We apply a common differential microarray analysis setup as primary filter step. Different experimental sample groups are compared by the Wilcoxon rank sum statistic. For a given gene, a p-value is computed for each sample group comparison as measure of significance of the differential expression. P-values are corrected for multiple testing using the procedure of Benjamini and Hochberg (1995). In this primary filter step, we assume genes as differentially expressed if they exhibit significance-level α of 0.01.
2.4. Support vector regression
Padesco is based on the training of predictive regression models using SVR (Vapnik, 1998; Smola and Schölkopf, 1998) (see Section 2.5). We focus Support Vector Machines (SVMs), which have acquired general acceptance for microarray applications and have been used for a wide range of tasks (Vapnik, 1998; Schölkopf and Smola, 2001), in particular, array and tissue classification (Furey et al., 2000; Chen et al., 2007), They have been shown to yield very competitive results for applications in molecular biology (Schölkopf et al., 2004). In their most common formulation, SVMs work on a set D of real-valued vectors with associated labels
2.5. Model building
We derive SVR models to predict gene expression fold-changes. A model to predict the fold-change of a gene is trained on fold-changes of the other (n −1) genes in a CV setting skipping an experiment at a time. Here, the linear kernel enables the immediate training on data sets containing missing values. We additionally examined an orthogonal coding scheme (Wang et al., 2006)—0-imputation and average-imputation—but neither increased the average performance of the method. Since imputation methods may introduce additional errors, we omit instances carrying missing values (mis) as a label from both prediction and training. Raw data is represented as a matrix D of expression values
By adding a constant c, small expression values up to an estimated noise level will not lead to extreme fold-changes. The value of c was screened similar to SVR hyper-parameters during the initial parameter screening and thus set to 50. In a LOOCV, models are trained for the prediction of fold-changes of a gene g in an experiment e. For target gene g with associated label l(g), the training is done using pairwise fold-change vectors of arrays within the same experiment. The induced fold-changes
2.6. Fold-change prediction
We now simulate the real-world setting: the experiment e has never been seen during training, and we like to do a prediction for a gene of interest g. First, we calculate the fold-changes for all genes among all t pairs in this particular experiment. This corresponds to a vector
2.7. Scoring performance deviation
We now have a measured fold-change vector
We also compute a discretized version of
We now know how well a gene performs in a single experiment. Yet, we cannot say whether this is more or less than we expected. To arrive at a deviation of known patterns we compute the empirical distribution Dg of all
In order to be retained by Padesco genes must simultaneously satisfy the significance level of differential expression in a specific sample group given by a certain α-level as well as a minimum padscore. These genes are referred to as specific. Remaining unspecific genes are significantly regulated, but could be predicted by the SVR models.
2.8. Permutation test for the evaluation of Padesco
Gold standards on the experiment-specific expression of genes are not available. We use a permutation test to simulate genes deviating from their common behavior. By copying (spiking) the expression values from a significant gene g+ to an insignificant gene g- within an experiment e, we force genes to violate their common behavior and trivially become significant. We have two choices in parameters here. First, we can choose a z-score level tz for significance. Second, we can choose a padscore level tp to select interesting genes. The following permutation test selects these thresholds and estimates the associated performance for spike-in controls. We sample from the significant genes, and spike into the insignificant genes. We then recompute the padscore for the previously insignificant gene. This process is repeated s times where s is the number of significant genes. SPIKE denotes the set of spiked genes. After all repeats have been computed, we obtain sensitivity = tp/(tp + fn) and precision = tp/(tp + fp) and repeat the evaluation for all possible thresholds tz and tp in the experiment. A gene g's recomputed padscore p determines whether it is tp, fn or fp based on these thresholds (Table 1).
A threshold on z-score (tz) and padscore (tp) is chosen. After spiking (see Section 2.8) a gene g's recomputed padscore p determines its type.
3. Results
3.1. Evaluation of expression fold-change predictions
We use the uncentered correlation to measure how well the regression models can predict expression fold-changes of gene g in experiment e. The prediction performance is significantly better than random for the majority of genes: the uncentered correlation achieved an average value of ρu = 0.7 in our experiment. 91% of the predictions exhibit a ρu >0. After discretization we achieve an AUC of 81% on 15.7% cases with a fold-change of more than two. We argue that the remaining specific candidates that cannot be predicted well are particularly interesting because they exhibit an experiment-specific expression that could not be learned from the training data.
3.2. Prediction of fold-changes for individual genes
Gene signatures, i.e. sets of genes that are differentially regulated between different cellular states are frequently published along with microarray experiments. Such signatures are expected to, for example, yield diagnostic markers that could help to differentiate between healthy and sick individuals. Here, we examine a gene signature that has been compiled by Armstrong et al. (2002) to distinguish a particular chromosomal translocation involving the MLL (mixed-lineage leukemia) gene from the regular ALL (acute lymphoblastic leukemia) genotype. The MLL translocation is significant as it frequently leads to an early relapse after chemotherapy. In Figure 3, we compare our predictions against the experimentally determined expression fold-changes for this gene signature. For all genes, the direction of differential expression can be correctly derived from our predictions, although the values of the measured fold-changes are not reproduced exactly. Similar results have been obtained for other published signatures.
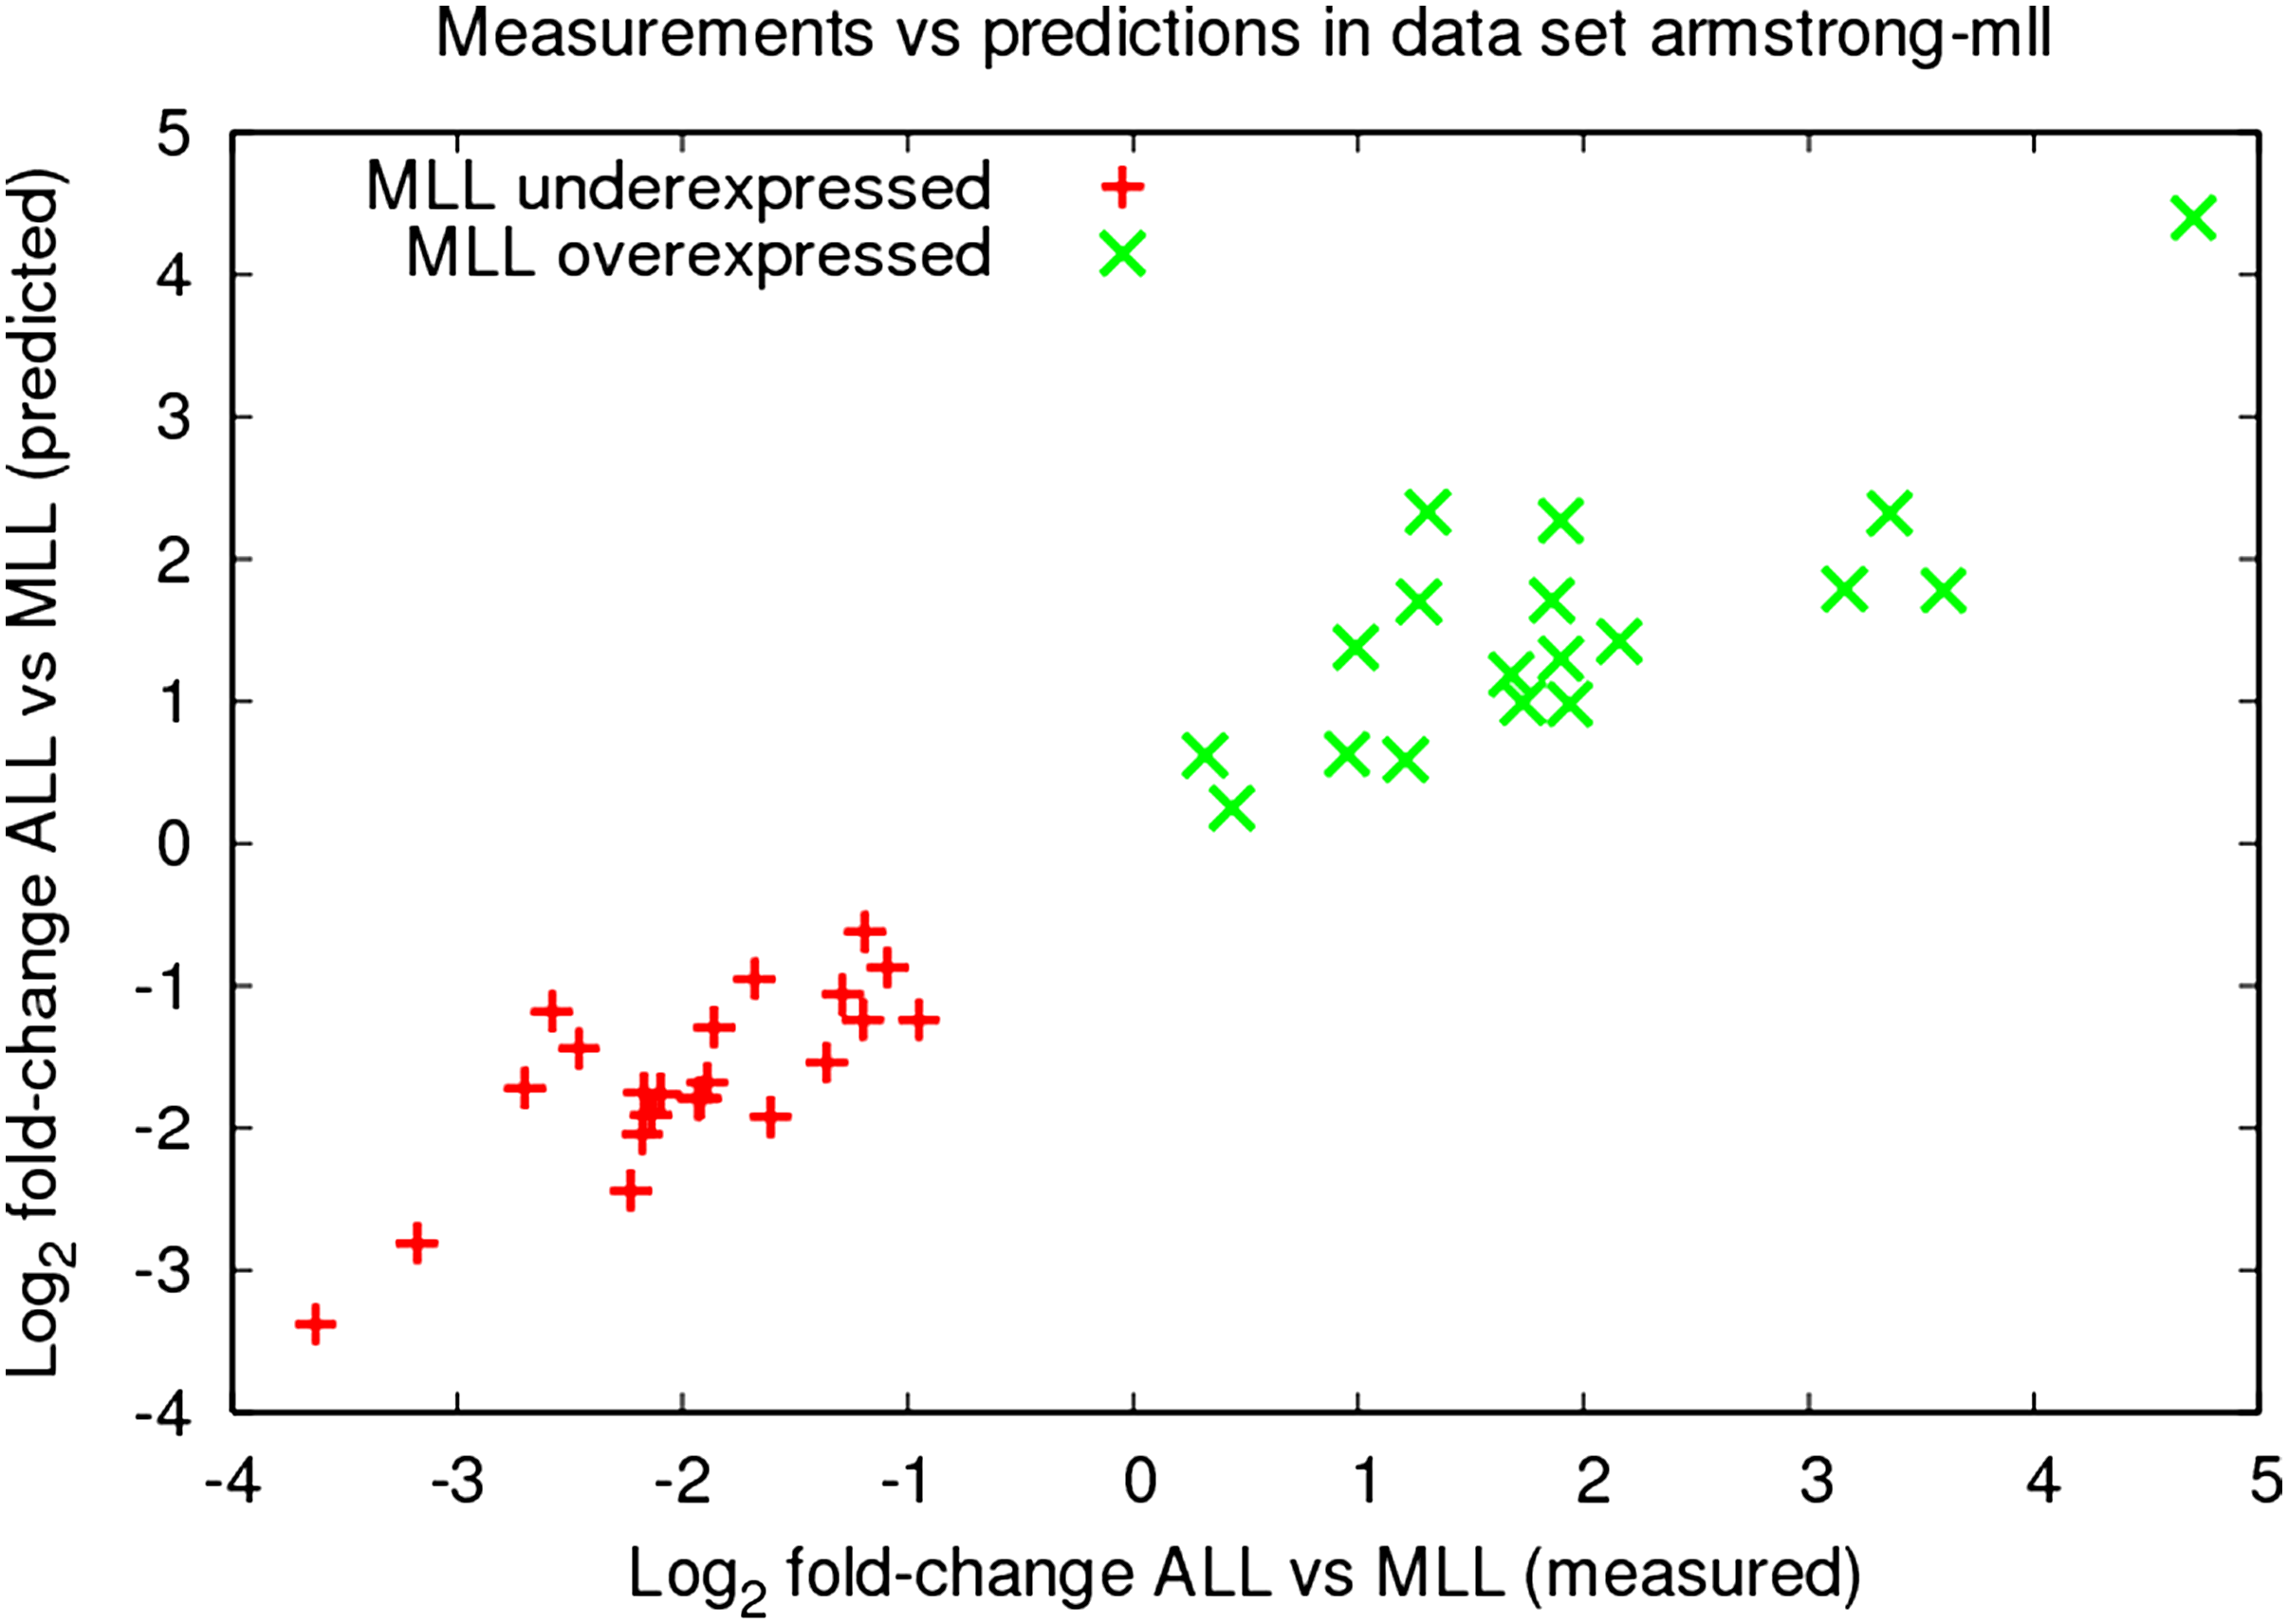
Scatter plot of predicted versus measured fold-changes. Microarray studies frequently derive gene signatures, i.e. sets of differentially expressed genes discriminating between experimental conditions. Gene signatures can be predicted well by our SVR models, as shown here for a gene signature distinguishing ALL and MLL leukemic genotypes published along with the data set of armstrong-mll ([Armstrong et al., 2002]). For every gene, our SVR models predict expression changes between ALL and MLL correctly, although the precise values of the measured fold-changes are not reproduced exactly. A gene is depicted as a single point, i.e. as average of all fold-changes of the given gene (see Section 2.5) over the array-pairs comparing the conditions ALL and MLL.
3.3. Permutation test based evaluation
Padesco filters genes based on a standard differential expression z-score (Wilcoxon test, see Section 2.3) and a novel padscore (see Section 2.7) indicating experiment-specific expression. This second score indicates whether genes can be predicted less well than expected from the training (background) set of experiments. They are selected due to their padscore since they do not conform to their trained patterns. Cutoffs on the two scores are required for the selection of specific candidate genes that exhibit differential as well as experiment specific expression. The permutation test introduced in Section 2.8 generates artificial pattern deviations through spiked genes. As shown in Figure 4, at a padscore cutoff of 2.0 specific candidates are accurately detected (85% precision). The precision increases for differentially expressed genes (z >3). Based on the evaluation we picked a padscore threshold of 2.0 and a z-score threshold of 3.0 to receive a moderate number of candidates exhibiting a high precision. Thereby, we selected some 250 specific candidates.
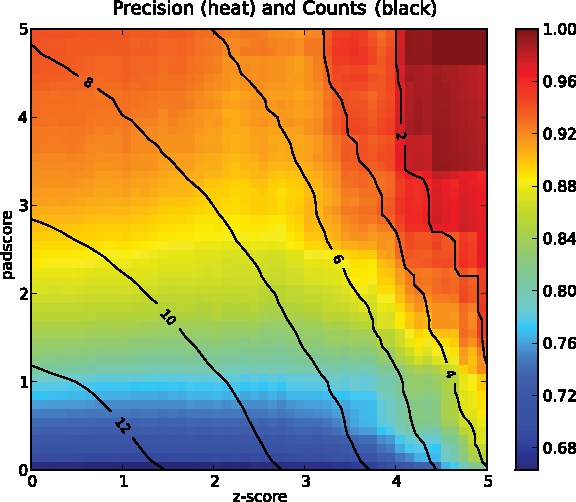
Precision (percent, colormap) versus number of detected genes (log base 2, contour). As gold standards are not available, we estimate the performance of specific candidate gene detection by a permutation test. This test evaluates how well known spike-in controls can be recovered by Padesco for arbitrary z-score (differential expression) and padscore (experiment specific expression) thresholds. Specific candidate genes can be reliably identified (85% precision) using a padscore above 1.5 even if they exhibit only moderate levels of differential expression (z-score <4). By combined z-score and padscore thresholds candidate gene lists can efficiently be reduced for follow-up studies. Analyzed here are 59 condition comparisons from 13 experiments. At the chosen padscore (2.0) and z-score (3.0) thresholds, some 250 specific candidates (contour) are detected by Padesco.
3.4. Specific candidates
In this section, we discuss sample results in two experiments that examine prostate cancer (Singh et al., 2002; Welsh et al., 2001) and one study on leukemia (Armstrong et al., 2002). As a further example, we provide results from a Toxoplasma gondii infection study (see Fig. 5) by Chaussabel et al. (2003). Padesco does not aim to whole relevant pathways but allows to focus on a small subset of interesting genes for further analysis. Vogelstein and Kinzler (2004) discuss key pathways which are likely to be disturbed to promote cancer in almost any cell type. Development of cancer is strongly coupled to the perturbation of one or more such pathways. The interleukin 2 pathway has been shown to be deregulated in many cancer types and was also described to be involved in prostate cancer. IL2RB dimerization with the α-subunit leads to a higher affinity towards interleukin-2. IL-2 treatment was previously shown to lead to reduced prostate tumor growth in rats (Hautmann et al., 1999; Moody et al., 1994). Another cancer therapy using IL-2 has been developed by Otter et al. (2008).
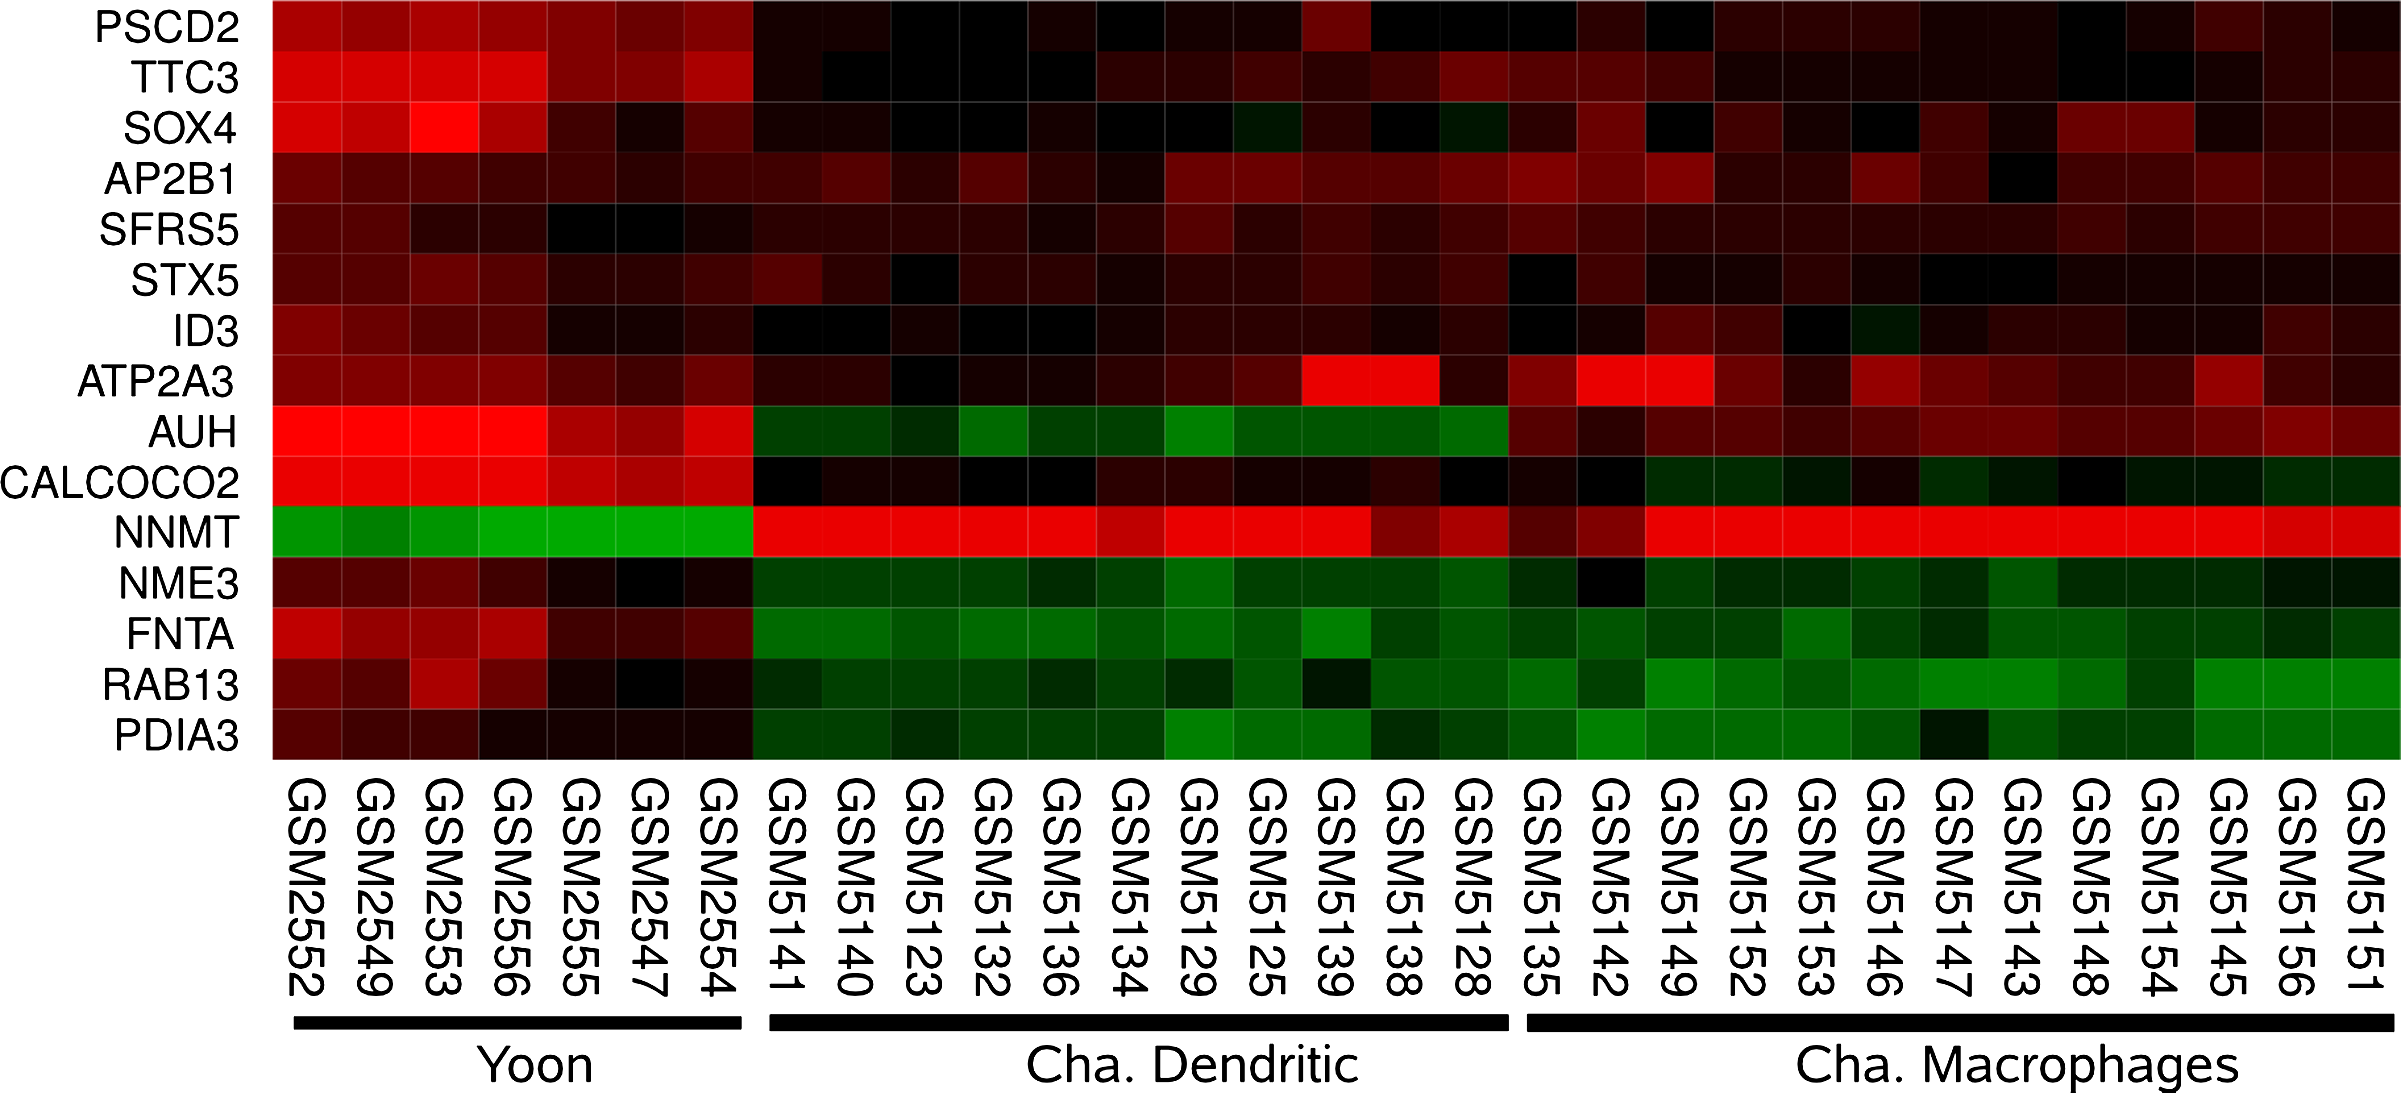
Common regulation and experiment deviation. The heat map shows a cluster of genes which are usually correlated (pairwise Pearson's Correlation above 0.8, “yoon-p53 (Yoon)” [Yoon et al., 2002] is given as reference). Here, AUH with a padscore of 5.09 is detected as interesting in “chaussabel-parasite (Cha)” [Chaussabel et al., 2003].
Eicosanoids are known to interact with immune messengers like interleukins. In the first experiment by Welsh et al. (2001), tumor samples were compared against normal and HUVEC (Human Umbilical Vein Endothelial Cells) samples, where 27 genes have been detected as differentially expressed. For an initial screening of functional significance we apply a gene ontology over-representation analysis (DAVID [Dennis et al., 2003; Huang et al., 2009]) on the differentially expressed genes (i.e., without padscore filter). As for Welsh et al. (2001), a screening for significance (Benjamini-Hochberg corrected scores, α = 0.01) shows no significant enrichment, yet 3 genes (IPR, EPR3R, and CYT450J) are found to belong to the eicosanoid metabolism (p = 0.08). With padscore filter, Interleukin 2 receptor β (IL2RB) is the only gene found to be interesting in this experiment. Padesco reported an unusual expression of IL2RB in the tumor samples, which could explain the decoupling of eicosanoid pathway members from IL2RB regulation.
The second examined experiment on prostate cancer is described in Singh et al. (2002). Here, 60 differentially expressed genes were identified. DAVID analysis shows no significant over-representation. After Padesco-filtering, 4 genes remain that we discuss below. HCK (padscore = 7.2), an src related tyrosin kinase, is most interesting in terms of the padscore. Smith et al. (2001) describes its association with gpl130 and the formation of a complex with IL-6R which promotes high affinity binding of IL-6. In prostate cancer, IL-6 is a key protein. It has been suggested to contribute to prostate cancer progression towards an androgen-independent state. We observe MGC17330 (PIK3IP1, padscore = 2.6) to be the second padscore relevant gene. It is a negative regulator of PI3K. Src kinases are upstream mediators for the PI3K signaling pathway with important roles in proliferation, migration and survival. It is described to be a tumor suppressor in heptacellular carcinomas (Fabregat, 2009). It shows only a weak positive fold-change in this experiment which may explain why it fails as a suppressor here. Mutations within the PI3K pathway have been described by Vogelstein and Kinzler (2004) to be involved in a number of tumor types. The third gene found is ATP2B1 (PMCA1, padscore = 2.6). It is a Ca2+ ATPase subunit. An unusual reduction in gene expression can be observed in our data. This reduction is discussed by Roderick and Cook (2008). Ca2+ pumps are likely to provide good therapeutic targets for anticancer drug development as suggested by Monteith et al. (2007) and Roderick and Cook (2008). They emphasize the role of Ca2+ (intracellular calcium) in the life-and-death decisions of the cell such that disturbed control of Ca2+ may lead to an inappropriate cell fate. The fourth candidate—C2orf3 (padscore = 2.03)—has also been identified of an approach of Hong et al. (2008). They analyzed three prostate cancer sets, but since more than a hundred genes are identified and C2orf3 is no top-ranking gene, this candidate has not been subject to further discussion. The transcription repressor binds GC-rich sequences of the epidermal growth factor receptor, beta-actin and calcium-dependent protease promoters.
Slightly below the padscore threshold STK38 (padscore = 1.84) has been described to exhibit cancer specific alternative splicing variants (Lee et al., 2003). In Rozanov et al. (2008), it is suggested as a part of the downstream network of MT1-MMP, a key regulator linked to tumorgenesis and metastasis. Similarly, CPD (padscore = 1.47) is a metallo carboxypeptidase family enzyme. It is described to have shown lower levels of gene expression in colon carcinomas. We observe a similar downregulation in our data. The well-known PSMA (or PSA) also exposes carboxypeptidase activity associated with increased invasiveness of prostate cancer (Ghosh et al., 2005). Similarily, GTF2B/TFIIB (padscore = 1.46), the general transcription factor 2B, plays a major role in the transcription of eukaryotic genes. Minucci and Pelicci (2006) suggested Histone deacetylases (HDACs) as promising targets in cancer therapy, partly due to their DNA binding capabilities. GTF2B/TFIIB exhibits auto-acetyltransferase function regulated by acetylation, while acetylation also impairs activities of enzymes involved in DNA metabolism and repair. DNA repair is a key mechanism which has to be bypassed to allow for tumor development due to Vogelstein and Kinzler, (2004). With padscore of 1.11, KLF6 is predicted only slightly worse than usually, yet with a much smaller offset than HCK. The Krueppel-like factor 6 is a well-known tumor suppressor gene.
The third data set by Armstrong et al. (2002) compares ALL to MLL. We can recover most specific genes originally published (some are filtered due to our criteria among all integrated experiments). An interesting exeption is LGALS1, which shows considerable expression in both the MLL and the AML samples, but not in ALL. Using a clustering procedure, Armstrong et al. (2002) describe it to be MLL specific. Our top candidate here does not meet the padscore = 2 requirement, yet RhoA (padscore = 1.99) is involved in cytokinesis and has been described as both pathogen target as well as regulator of oncogenensis (Burridge and Wennerberg, 2004).
Ordonez-Moran et al. (2008) associates RhoA with colon carcinoma (not in our background set). A second gene, ETS1 (padscore = 1.86) belongs to the familiy of ETS transcription factors and has been shown to regulate telomerase activity at gene transcription level. It constitutes a well-known oncogene with potential effects on telomer stability. In Yeoh et al. (2002), BCR-ABL samples 2 genes exhibit an extreme padscore of 4.8 and 5.9: PHLDA2 and PSMA6. While PSMA6 has recently been suggested as a new prognostic marker in acute monocytic leukemia (Chen et al., 2009), PHLDA2 (pleckstrin homolog-like domain family member 2) is located in a region considered to be an important tumor supressor gene region. The top gene among the identified candidates in the prostate cancer subtype of Butte et al. (2000) is SLC30A3 (padscore = 6.81), a zinc transfer transporter from the solute carrier family (prostate tissue in general shows an increased zinc content—around 10-fold higher than other tissues). SLC30A3 has been suggested to be a member of the apoptotic pathway in Ackland et al. (2007). Usually, SLC30A3 lowers intracellular zinc concentrations by mediating zinc efflux. Mouse TRAMP models suggest that both too high and too low zinc uptake have drastic effects on prostate tumor sizes thus this candidate's dysregulation could be crucial for tumor tissue. Prasad et al. (2010) even argue that an optimal zinc level is crucial as a protective instance against cancer development. DOOST (padscore = 8.53) is involved in the metabolism of glycoproteins and has been suggested to mediate processes associated with cell-adhesion or invasion (Hasegawa et al., 2002) and has been frequently described in the context of gastric cancer which was not yet included in our background set of experiments. Chaussabel et al. (2003) analyze diverse parasite infections on human macrophages and dendritic cells. We find CCR1 to be the most prominent gene (padscore = 9.29) in the Toxoplasma infection subgroup. Mice lacking this chemokine receptor CCR1 have shown dramatically increased mortality after Toxomplasma gondii infection (Khan et al., 2001).
4. Discussion
Genes are not regulated individually (Lee et al., 2004; Ucar et al., 2007). Frequently, patterns of co- or anti-regulation can be observed, such that the up-regulation of a gene A is a good hint that another gene B will also be up-regulated while a third gene C will rather be down-regulated. The disruption of such patterns pinpoints genes with experiment-specific expressions. We call such genes specific candidates in contrast to the remaining unspecific candidates that exhibit only generic expression patterns. Padesco detects specific candidates by analyzing fold-change based co-expression patterns with SVR models trained on a background set of microarray experiments. After training, we select specific candidate genes via a two stage filter. The first filter step is a routine analysis of differential expression (significant genes). A novel second filter selects genes that show deviations from generic expression patterns predictable by linear models (interesting genes).
In order to avoid the predictions of false specific candidates, Padesco depends on a good prediction performance of the underlying SVR models. The prediction performance can be evaluated rigorously, as the prediction target experiment is excluded from training in a LOOCV setting, where all conditions of particular experiments are left out. This not only excludes condition specific but also experiment specific biases. We examined 4117 genes across 25 experiments consisting of 1437 individual microarrays. Predictions by Padesco are better than expected by chance in 91% of the cases. It has been suggested that gene signatures rarely help to identify the involved biological processes or the causal regulatory mechanisms (Segal et al., 2004). Hirsch et al. (2010) further argued that gene signatures frequently do not represent specific attributes of the measured biological conditions. We analyzed gene signatures published together with the corresponding microarray experiments. These signatures were selected by the authors of the corresponding studies to discriminate between experimental conditions (sample groups). We found that expression changes for genes in signatures are predicted well by our SVR models trained on other, unrelated experiments. An example is the signature distinguishing ALL and MLL (Armstrong et al., 2002). Although the ALL/AML signature certainly provides discriminating marker genes, it does not capture experiment specific expression patterns according to Padesco.
The extent of differential expression alone does not indicate experiment specific involvement of genes. Based on the prediction performance, we identified specific candidates genes that exhibit experiment specific expression (i.e., expression changes that cannot be explained—predicted—by our models). This analysis is related to co-expression studies and complements differential expression analysis. It enables us to focus on concise candidate lists for follow-up studies that consist of experiment-specific candidates only. We screened for filter thresholds and estimated Padesco's performance from permutation tests, as comprehensive gold standards for the experiment specific expression of genes are not available. This newly devised simulation approach suggests that specific candidates are identified reliably by Padesco (>85% precision at padscore >1.5) even if they show only marginal levels of differential expression. On the other hand, more than 90% of the genes selected by differential expression alone exhibit only generic expression patterns and could thus be excluded from further studies. Specific candidates are likely to represent characteristic features of the corresponding experimental conditions.
We evaluated Padesco selected genes for two data sets on prostate cancer. Besides interesting new candidates, we found several genes with a known involvement in the disease. Some of them, such as IL-2RB, have already been reported as promising drug targets. We demonstrated that such examples are more difficult to detect by differential expression analysis alone. Instead, differential expression tends to pick up genes that act similarly in other, biologically unrelated experiments. Thus, in combination with differential expression analysis, Padesco is a promising protocol for the detection and analysis of particularly distinctive features of microarray experiments.