
Abstract
Abstract
This article presents a new graph-based algorithm for identifying branched metabolic pathways in multi-genome scale metabolic data. The term branched is used to refer to metabolic pathways between compounds that consist of multiple pathways that interact biochemically. A branched pathway may produce a target compound through a combination of linear pathways that split compounds into smaller ones, work in parallel with many compounds, and join compounds into larger ones. While branched metabolic pathways predominate in metabolic networks, most previous work has focused on identifying linear metabolic pathways. The ability to automatically identify branched pathways is important in applications that require a deeper understanding of metabolism, such as metabolic engineering and drug target identification. The algorithm presented in this article utilizes explicit atom tracking to identify linear metabolic pathways and then merges them together into branched metabolic pathways. We provide results on several well-characterized metabolic pathways that demonstrate that the new merging approach can efficiently find biologically relevant branched metabolic pathways.
1. Introduction
The central problem in computational metabolic path finding is the following: given a start and target compound, find and return biologically relevant or realistic pathways of enzymatic reactions that produce the target compound from the start compound. Previous work in this area has primarily focused on finding linear sequences of reactions between start and target compounds (Planes and Beasley, 2008). However, more complex metabolic pathways, termed branched pathways, are dominant in metabolic networks and provide a more complete picture of metabolic processes (Michal, 1999; Pitkänen et al., 2009). Branched pathways consist of multiple pathways that interact biochemically. For example, a start compound may be split into smaller compounds which, in parallel, undergo several different chemical reactions. The resulting products can then combine to form the target compound. A diagram of a generic branched metabolic pathway is depicted in Figure 1. The identification of branched pathways enables the analysis of metabolic processes with a more comprehensive perspective as compared to the limited picture provided by linear pathways.
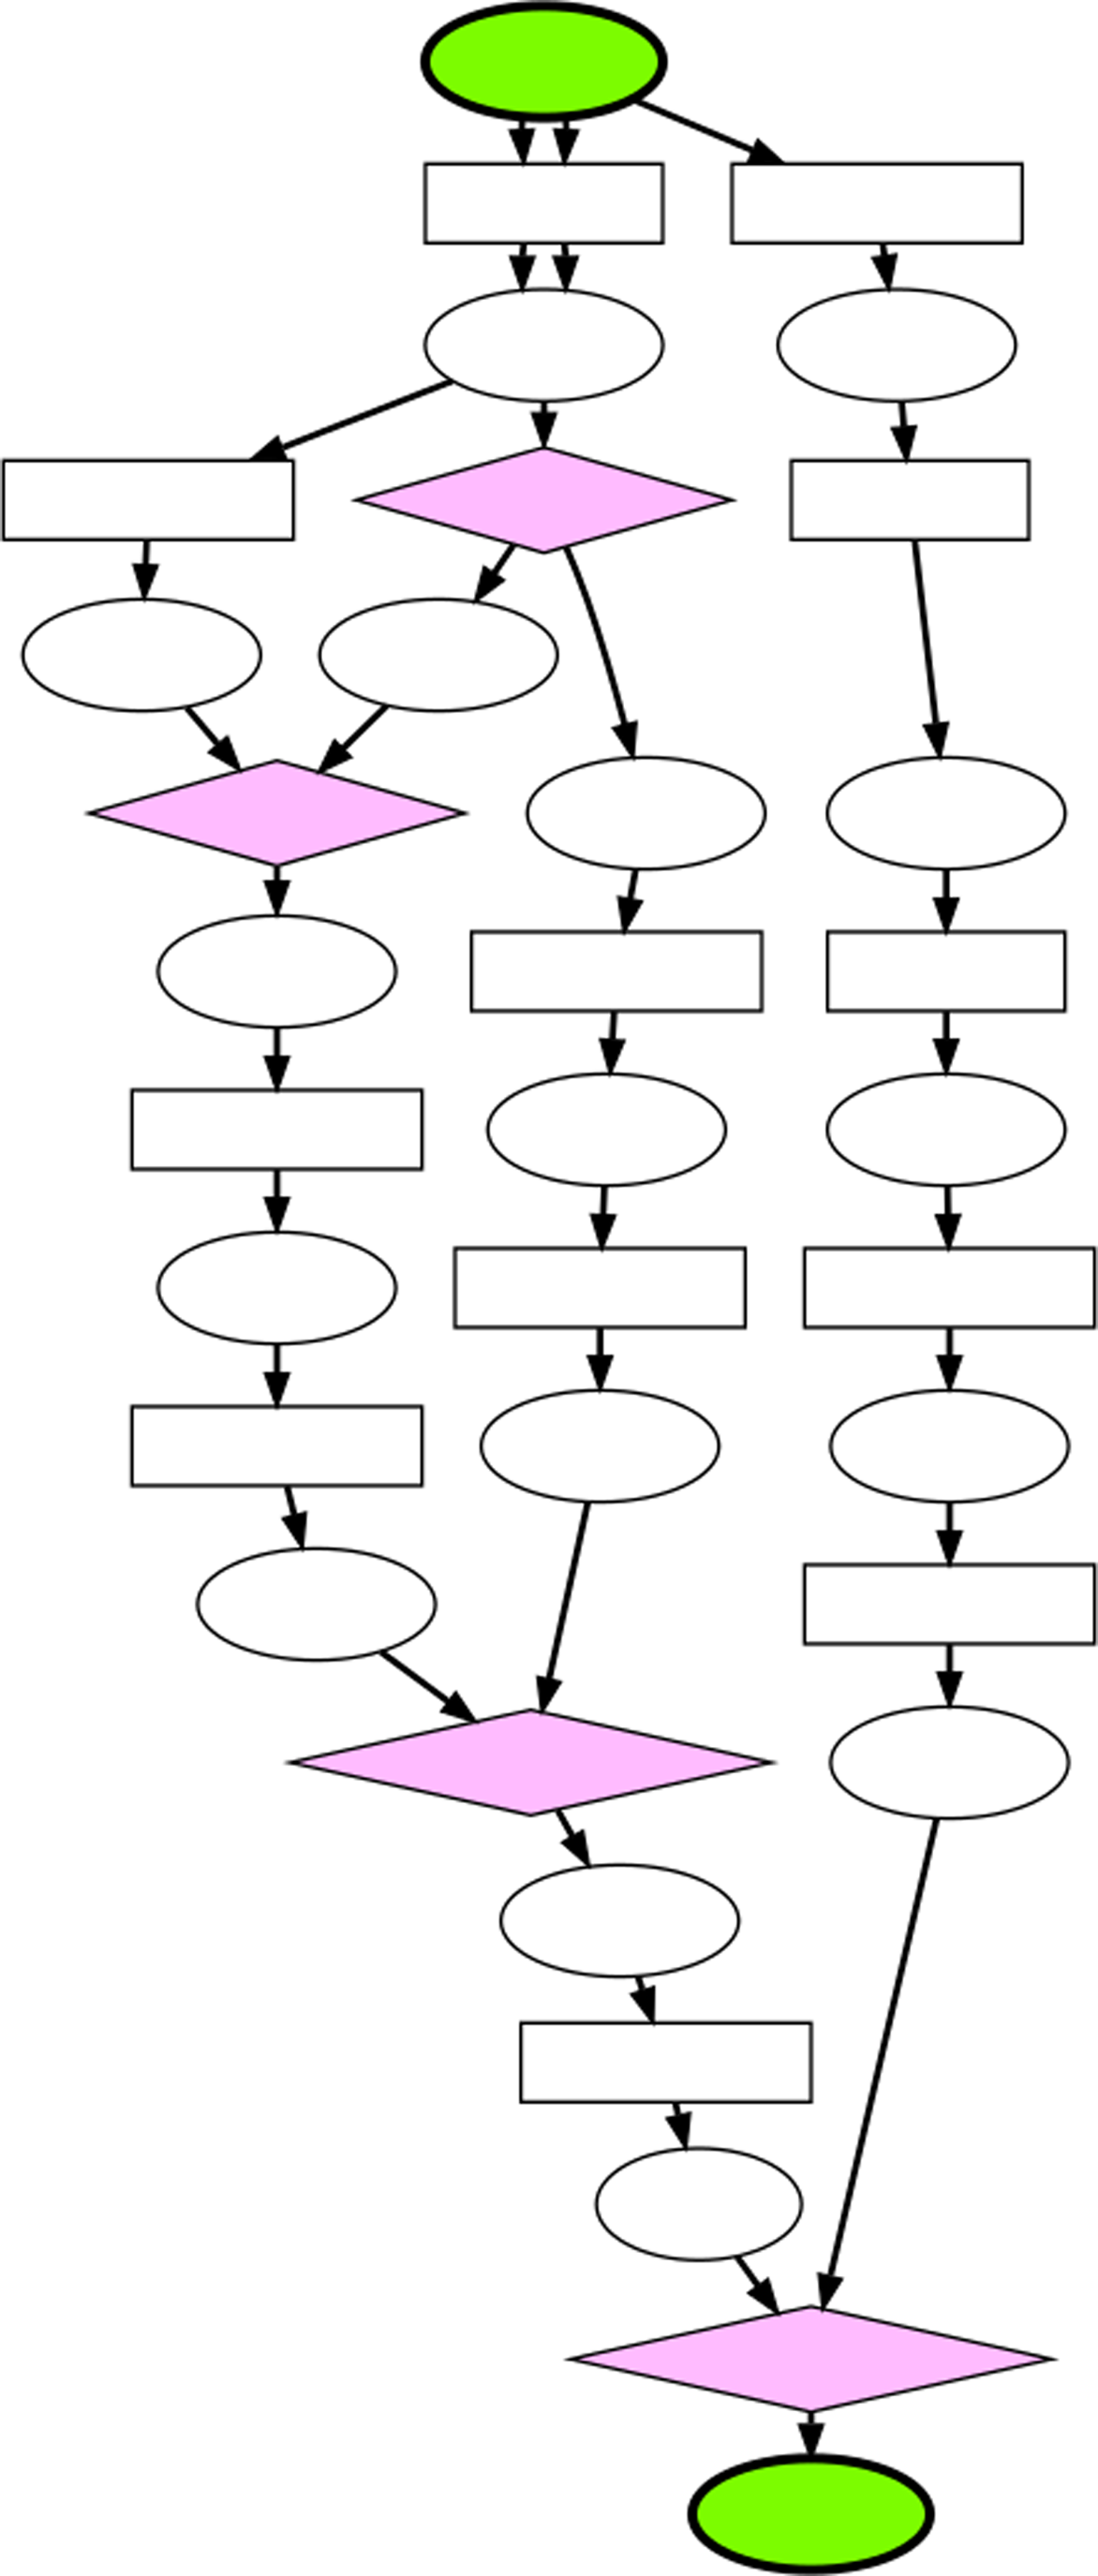
A generic depiction of a branched metabolic pathway. The green nodes represent the start and target compounds, the ellipses represent compounds, the boxes represent reactions along linear pathways that compose the branched pathway, and the pink diamonds represent the reactions that occur at branch points. Each edge represents one molecule of each compound, and the arrows indicate the direction of the reactions. In this example, three molecules of the start compound are required to produce one molecule of the target compound.
The main contribution of this article is a novel graph-based algorithm for identifying branched metabolic pathways by using atom tracking information to merge linear pathways. The merging approach of the presented algorithm is different from previous graph-based approaches, which start from a single linear pathway and then find new linear pathways to attach as branches (Pitkänen et al., 2009; Heath et al., 2010). The results demonstrate that the new algorithm is able to efficiently find different network topologies in multi-genome scale data obtained from KEGG. This article is an extended version of Heath et al. (2011).
The article proceeds as follows: Section 2 describes the relevant previous work in the area of graph-based metabolic path finding; Section 3 describes how our new algorithm merges linear pathways to find branched pathways; Section 4 contains the results for five well-characterized branched metabolic pathways; Section 5 concludes the article.
The full result pathways can be found at www.kavrakilab.org/data/bpatm-jcb-2011-supp. Additionally, a web server for our metabolic path finding methods is located at http://metabolicpaths.kavrakilab.org.
2. Previous Work
2.1. Graph-based models for finding metabolic pathways
Graphs provide a well-studied computational model for identifying biologically relevant pathways in metabolic networks (Deville et al., 2003). Graph-based metabolic path finding algorithms complement stoichiometric approaches, as they focus on different aspects of modeling and understanding metabolism (Planes and Beasley, 2008; Faust et al., 2009; de Figueiredo et al., 2009). Stoichiometric models are typically utilized for modeling specific organisms or metabolic systems (Gombert and Nielsen, 2000). Most stoichiometric models are based on the steady-state assumption and therefore require explicit labeling of internal and external compounds (Kauffman et al., 2003). This can be a disadvantage as there are feasible biochemical pathways that do not obey the steady-state assumption and/or a compound that labeled as internal could easily be provided as an external compound (Planes and Beasley, 2008). However, both types of models are important for gaining insights into metabolic networks.
Graph-based methods have suffered from the disadvantage of finding pathways with spurious connections (Arita, 2004). Several approaches have been developed to try to overcome this problem, such as removing certain currency metabolites from the graph (Wagner and Fell, 2001; Gerlee et al., 2009; Ranganathan and Maranas, 2010), adding weights based on the degree of the nodes (Croes et al., 2006; Faust et al., 2009), or using measures of structural similarity between compounds (McShan et al., 2003; Rahman et al., 2005). We build on work that utilizes atom-mapping data, an approach more closely related to the underlying biochemistry (Arita, 2003, 2004). Atom-mapping data provides a systematic way of understanding a biochemical reaction by providing a specific mapping between each atom in the input compounds of a reaction to an atom in the output compounds. In the last few years, the availability of atom-mapping data has been steadily increasing, with one of the primary sources being the KEGG RPAIR database (Kanehisa et al., 2006; Kotera et al., 2004).
Previous work has mainly used atom-mapping data for finding metabolic pathways by only allowing connections through reactions where at least one atom is being transfered from input to output compound (Faust et al., 2009; Mithani et al., 2009), or only returning pathways that conserve at least one atom, typically carbon (Arita, 2003, 2004; Blum and Kohlbacher, 2008b,a). However, there are often instances where it is biochemically relevant to find pathways which conserve a high percentage of atoms from start to target compounds (Boyer and Viari, 2003; Pitkänen et al., 2009). Finding atom conserving pathways allow graph-based algorithms to account for the compounds that provide the atoms in the target compound, without having to use full stoichiometric constraints. The algorithm presented in this article is based on our earlier work that finds atom conserving pathways by explicitly tracking multiple atoms in metabolic networks (Heath et al., 2010).
2.2. Foundation for the presented work
The algorithm presented in this article utilizes a graph-based structure that incorporates atom-mapping data called an atom-mapping graph, Gam, whose design is based on the observation that the same atom-mapping pattern between two compounds often appears in multiple reactions (Arita, 2003). Gam is a directed bipartite graph containing compound nodes and mapping nodes. The compound nodes have unique identifiers for both the compound as well as its atoms. The compound nodes are connected by directed edges to mapping nodes that explicitly specify, via the unique identifiers, what atoms from the input compound become the atoms in the output compound. Each atom-mapping only maps the atoms between a pair of compounds and so the mapping nodes in Gam only have one input edge and one output edge connected to two different compound nodes, while the compound nodes have a degree equal to the number of mappings they participate in. Since the same atom-mapping can occur in many different reactions, a correspondence is stored between the mapping nodes and the reactions in which they occur. A more detailed description of the construction of Gam can be found in Heath et al. (2010).
Previously, we developed and validated an algorithm for identifying the k shortest linear pathways in Gam that conserve at least a given number of atoms between desired start and target compounds (Heath et al., 2010). This problem has been shown to be PSPACE-complete in the general case and NP-complete when a compound can only be used once in a pathway (Boyer and Viari, 2003). Previously unnamed, we will call the linear path finding algorithm from Heath et al. (2010) LPAT, for Linear Pathfinding with Atom Tracking. Based on LPAT, we also developed and validated a graph-based algorithm for identifying branched metabolic pathways. Also previously unnamed, we will call the branched path finding algorithm from Heath et al. (2010) BPAT-S, for Branched Pathfinding using Atom Tracking and Seed pathways. The first step of BPAT-S uses LPAT to obtain a set of linear pathways between the desired start and target compounds. BPAT-S then annotates and stores the linear pathways with information about the specific reactions and compounds through which atoms are lost or gained. These annotated linear pathways are called seed pathways and indexed for efficient processing and attachment of branches. The branches are identified by calling LPAT to find linear pathways between compounds through which atoms are lost to compounds through which atoms are gained. These linear branches are then attached to the seed pathway to give rise to branched pathways, which are ranked first by the number of atoms they conserve and then by the total number of reactions they contain. In our previous study, we demonstrated that BPAT-S can find and return branched pathways that correspond to known branched pathways (Heath et al., 2010).
To the best of our knowledge, the only other comparable algorithm in the literature is the ReTrace algorithm (Pitkänen et al., 2009). The approach taken by ReTrace is similar to that of BPAT-S, but is based on pathways that only conserve one atom. In this article, we present a novel algorithm that takes a significantly different approach from BPAT-S or ReTrace by merging linear pathways to form branched pathways. We provide results on five different metabolic pathways that demonstrate both the strengths and weaknesses of BPAT-S, ReTrace and the presented algorithm, BPAT-M.
3. BPAT-M: Branched Pathfinding by Merging Linear Pathways
This section describes a new algorithm, Branched Pathfinding using Atom Tracking and Merging (BPAT-M), for finding branched pathways by merging linear pathways returned by LPAT. BPAT-M utilizes the observation that a significant portion of time is spent finding the branches in BPAT-S, but these branches may already be contained in the set of linear pathways found by LPAT. This redundancy is eliminated in BPAT-M by carefully inventorying the linear pathways. BPAT-M takes advantage of the fact that linear pathways can only be merged together if the pathways do not have overlapping atoms in their target compounds. The atom tracking information from the linear pathways provided by LPAT are processed by BPAT-M to construct three data structures Q, C, and M. These data structures enable the efficient merging of linear pathways to find branched pathways. The construction of Q, C and M is described in Section 3.1. Then, Section 3.2 describes Algorithm 1, BPAT-M Search, which harnesses the extensive indexing of linear pathways contained in Q, M, and C to find and return n branched pathways ranked first by the number of atoms conserved and second by the number of reactions.
BPAT-M Search
3.1. Construction of Q, C, and M from target atom markings (TAMs)
A target atom marking (TAM) of a linear pathway is a set of indices corresponding to the specific atoms in the target compound that have been conserved from the start compound. Typically, the number of TAMs found is much less than the theoretical maximum number due to the biochemical nature of the pathways. On the left of Figure 2, there are three linear pathways from α-
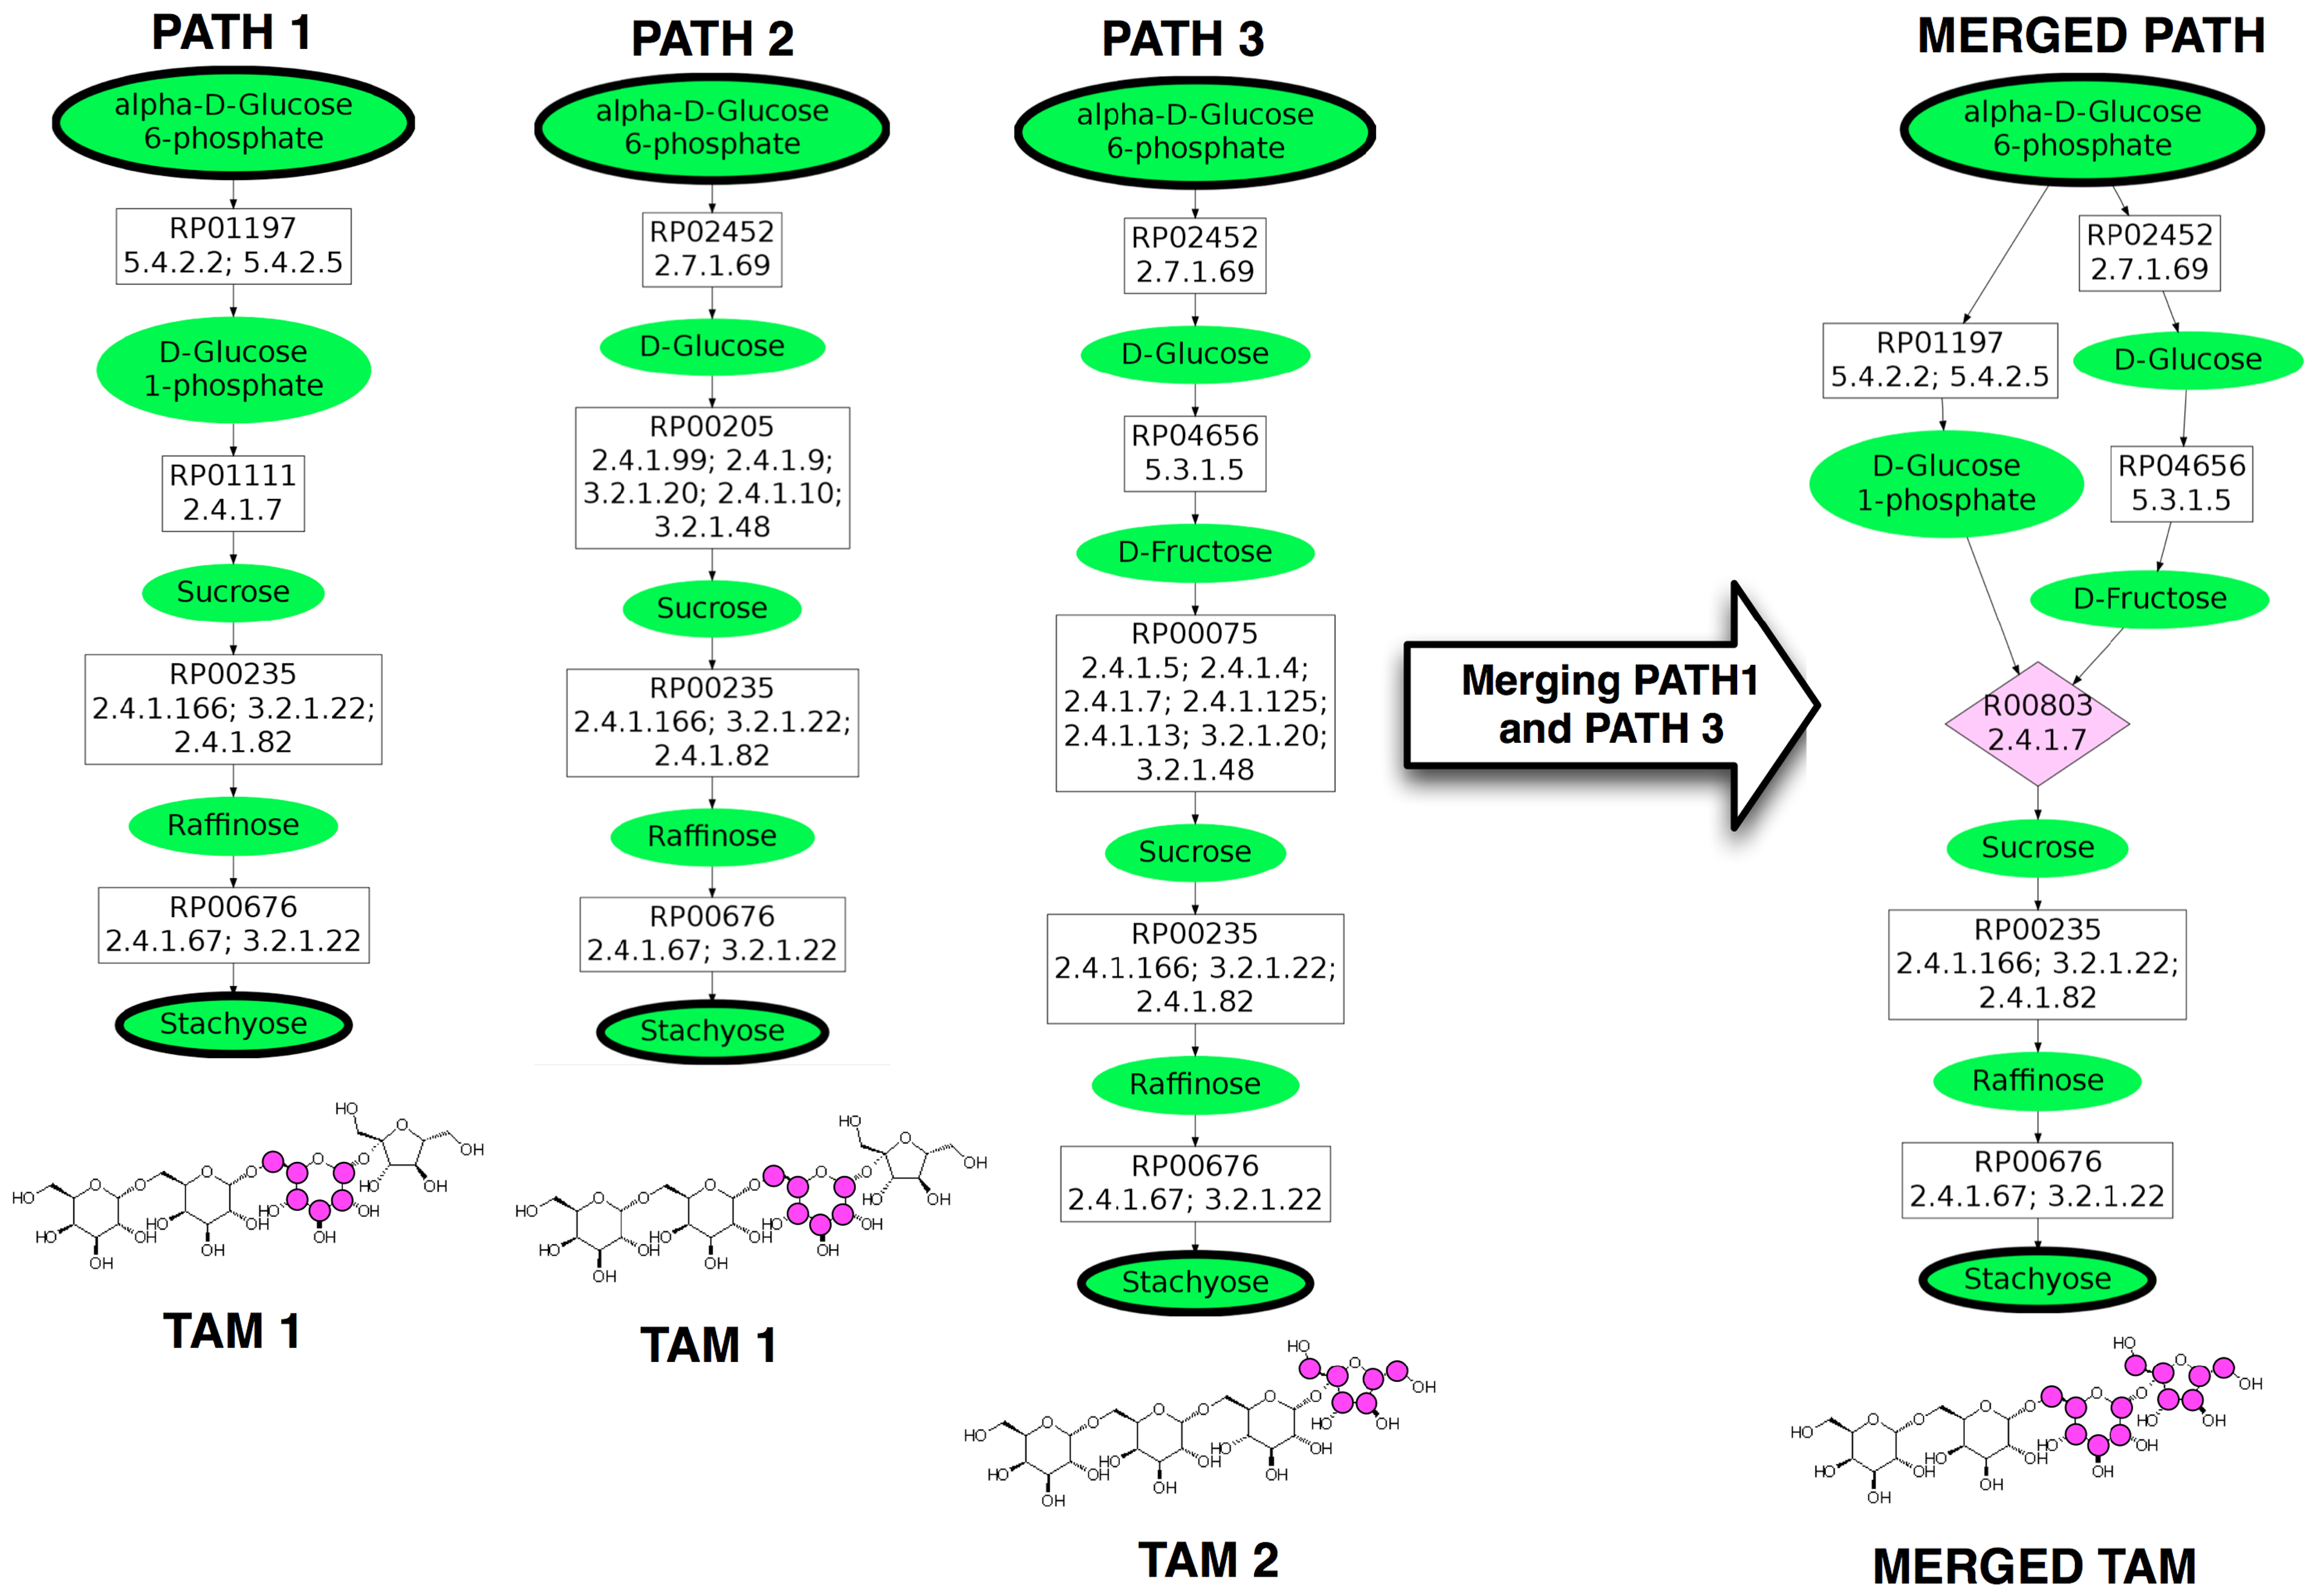
Three linear pathways from α-
The ability to use the TAMs to quickly determine if pathways are not mergeable motivates the construction of the data structure, Q, which maps a TAM to a list of linear pathways containing that TAM. For a particular TAM, t, this means that Q[t] returns all linear pathways whose TAM is equal to t, sorted by their length. For example, using the pathways depicted in Figure 2, Q[TAM 1] would return the pathways labeled PATH 1 and PATH 2. After Q is constructed, all disjoint combinations of the TAMs from the linear pathways are computed and stored in a list C. For example, for the hypothetical TAMs, t1 = {0, 1, 2}, t2 = {0, 1}, t3 = {2, 3} and t4 = {4, 5}, C would contain {t1, t4}, {t2, t3, t4}, {t2, t3}, {t2, t4} and {t3, t4} as all disjoint combinations. C is then sorted in decreasing order by the total size of the combination. In this example, {t2, t3, t4} would be first entry in C because it is of size six. Sorting C this way is important because the goal is to find pathways that conserve a larger number of atoms. For each combination
Once potentially mergeable linear pathways have been identified using Q and C, they must be further compared to see if they can be merged through a common reaction r. The data structure M is constructed to store the results of comparing pairs of linear pathways for mergeability, thus the comparison is only performed once. M maps all pairs of mergeable linear pathways to a tuple containing r and the number of mapping nodes from the target compound that r occurs. M is constructed by first identifying all pairs of pathways, p1 and p2, with disjoint TAMs. The mapping nodes of p1 and p2 are compared starting from the target compound. This comparison identifies the position, m, of the mapping nodes closest to the target compound that differs between the two pathways. Only the position m is considered because if merging two paths results in a larger TAM, they must share a common reaction at this point. It is possible that two paths may also interact closer to the start compound, but this is currently not considered by the algorithm because it does not impact the TAM. In Figure 2, the comparison between PATH 1 and PATH 3 would identify RP01111 and RP00075 as the different mapping nodes closest to the target compound and m would be 2, using zero-based indexing. The final step is to look up the reactions that are associated with the two mapping nodes at m and determine if the mapping nodes share a common reaction that can be used to merge the two pathways. If there is no common reaction, then the pathways are not mergeable. In the case of PATH 1 and PATH 3 in Figure 2, both RP01111 and RP00075 are found in the reaction R00803 (EC Number 2.4.1.7) in KEGG. The right side of Figure 2 depicts PATH 1 and PATH 3 merged by R00803. This information about the mergeability of PATH 1 and PATH 3 in Figure 2 would then be stored as M[PATH1, PATH3] = (R00803, 2).
3.2. Finding branched pathways using Q, C, and M
After processing and indexing the linear pathways to construct Q, C, and M, these data structures are given as input to Algorithm 1 along with the number of branched pathways to return, n, and a fixed beam width, w, which can be used to bound the search. Algorithm 1 then returns the final result of BPAT-M, the top n branched pathways found ranked first by the number of atoms conserved and then by the number of reactions. Despite reducing the number of linear pathways combinations that need to be tested, the number of such combinations sometimes remains quite large. Therefore, the algorithm performs a beam search with a fixed beam width, w, which is provided by the user. The heuristic used for the beam search is discussed in more detail later in the section, and its usage means that BPAT-M does not guarantee finding the optimal combination. However, the results demonstrate that the search performs well in practice.
Algorithm 1 works by taking each combination of TAMs
A merge point is always valid if pl has not been merged with another pathway in the IBP at the same mapping node it would use to merge with the new pathway, pq. However, if pl has been previously merged at the same point with another pathway in the IBP, the merge point with pq can still be valid if the reaction in the merge point of pq and pl is the same reaction used previously and the substrate compound in pq is not contained in the other pathways. Otherwise, the merge point is invalid. As an example, there could be a reaction r that takes the substrate compounds a, b, and c. If two pathways, p1 and p2 were merged together through r, with p1 containing a and p2 containing b, there are two possibilities for a third pathway p3, that is potentially mergeable with p1 at r. If p3 contains c, then the merge point is still valid and the resulting branched pathway would contain p1, p2 and p3 merged through r. However, if p3 contained b, then the merge point is invalid, as p2 has already been merged through b. By checking for validity, merging multiple pathways through the same reaction is handled in a general way and only limited by the substrates used in the reaction.
In Algorithm 1, if the merge point is valid, pq is merged with the IBP and the resulting branched pathway is stored as another IBP (line 17). Therefore, each IBP gives rise to a number of new IBPs equal to the number of pq that have valid merge points with the IBP. This means that there is a theoretical combinatorial explosion of IBPs for each Ci and we have observed that very large numbers of IBPs can be generated in practice. This resulted in the introduction of the beam width, w, to limit the number of combinations generated. After adding the pathways for each TAM, only the top w IBPs, sorted by number of atoms conserved and the sum of the length of the linear pathways, are carried over for each subsequent TAM (lines 18–19). Since the pathways are first ranked by the number of atoms they conserve and C is sorted by the size of each combination, the search can terminate when n pathways have been found and the next combination to try is smaller than the TAM of the nth pathway (lines 3–5).
The final way in which the time and/or space required by BPAT-M is reduced is by limiting the number of pathways that are kept for each TAM in Q. This is done by sorting the pathways by length and only keeping a user specified number of the shortest pathways for each TAM. Future work is needed to investigate the impact of these parameters and develop easier ways for users to understand and select the proper limitations for their application. Our results demonstrate that even with the heuristic limits, BPAT-M performs well in practice.
4. Results
We present results from BPAT-M, BPAT-S, and ReTrace (v1.03) on five representative, biologically interesting, test cases for branched pathways. The target compounds are stachyose, erythromycin, cephalosporin C, inosine monophosphate (IMP), and lycopene. The starting compound for all of the pathways is α-
4.1. Experimental setup
All KEGG data used in the following experiments was downloaded on February 5, 2011, containing 12,457 RPAIR entries and 8,406 REACTION entries. Each RPAIR entry contains an atom-mapping between a pair of compounds. The chemical structure of the compounds and a list of associated reactions are also contained in each RPAIR entry. For the experiments in this article, only carbon atoms were tracked, but the algorithms are able to handle any atom type that are included in the RPAIR data. For BPAT-M and BPAT-S, the KEGG RPAIR data is processed to obtain a universal index for each atom in each compound. The universal index is obtained for most of the compounds by using the indices of the compound structure data in each RPAIR entry. However, there are sometimes inconsistencies between the indices for the same compound in different RPAIR entries. If this is the case, an attempt is made to obtain the universal indices by using the compound structure in the KEGG LIGAND database. This is done by first checking whether there exists an isomorphism between the structure data found in the RPAIR entry and the data found in the LIGAND database. If there exists only one isomorphism, the compound's atoms are indexed using the structure from the LIGAND database. If there is more than one isomorphism, the RMSD is calculated between the two structures using the isomorphism mapping. If the RMSD is equal to zero, that isomorphism is used to index the atoms. Otherwise, the RPAIR is removed from the data set. Finally, any RPAIRs which consist of an atom-mapping where the atom types being mapped do not match are discarded. This processing removed 116 RPAIR entries, resulting in a Gam constructed from 12,341 RPAIR entries involving 6,159 compounds and providing atom-mappings for 7,782 reactions from more than 1,500 organisms. In the results presented in this article the full Gam was used, but subgraphs of Gam corresponding to particular organisms, reactions or compounds of interest can easily be created and searched.
Additionally, reversibility information was obtained from XML representations of the KEGG metabolic pathway maps, distributed in the KEGG Markup Language (KGML). A reaction is considered irreversible if it is consistently labeled as such across all of the KEGG metabolic pathway maps. Otherwise, the reaction is considered reversible. The processing of the KGML pathway maps resulted in 4,360 reactions being labeled irreversible. Once the reaction direction is determined, this information is then used to label RPAIR entries reversible or irreversible, which is used in the construction of Gam. For each RPAIR entry, all associated reactions have to be checked for directionality. If all of the reactions are irreversible and consistent in the labeling of the compounds as substrates and products, then the RPAIR entry is considered irreversible. Otherwise, the entry is labeled as reversible. This resulted in 3,698 reactions and 5,420 RPAIR entries considered irreversible. The reversibility information was also provided as input to ReTrace.
The implementation of BPAT-M was done in Java using the Chemical Development Kit (Steinbeck et al., 2006) and the Java Universal Network/Graph Framework (http://jung.sourceforge.net/). All result figures are drawn using Graphviz (www.research.att.com/sw/tools/graphviz/). All experiments were run on the Shared University Grid at Rice (SUG@R), using a single core from a 2.83-Hz Intel Xeon E5440 with access to 16 GB of RAM for each pathway.
4.2. BPAT-M results
The BPAT-M searches all used the same parameter values: n was 100, w was 500, and each entry in Q was limited to the 2,000 shortest pathways. Since BPAT-M begins with a search by LPAT, the value for k given to LPAT must also be specified. The value of k is typically set quite high because the k corresponds to the value given to Eppstein's k-shortest path algorithm in LPAT, which returns cycles. However, pathways with cycles are typically undesirable and removed, returning only the simple paths for use in the branched pathway finding. For these experiments, k was set to 1,000,000. In the branched pathway figures, the ellipses are compounds, with the start and target compounds highlighted in green; the boxes are mapping nodes that correspond to RPAIRs; and the pink diamonds contain the KEGG ID and EC numbers for reactions. Each edge in the pathway figures correspond to one molecule of the compound being used as a substrate or product of the reaction. The mapping nodes also contain EC numbers for the reactions that are associated with the RPAIR. Since pathways returned are often quite large and not always very readable on paper, the full pathway figures can be found at our website for better viewing (see www.kavrakilab.org/data/bpatm-jcb-2011-supp).
4.2.1. α-d -Glucose 6-phosphate to stachyose
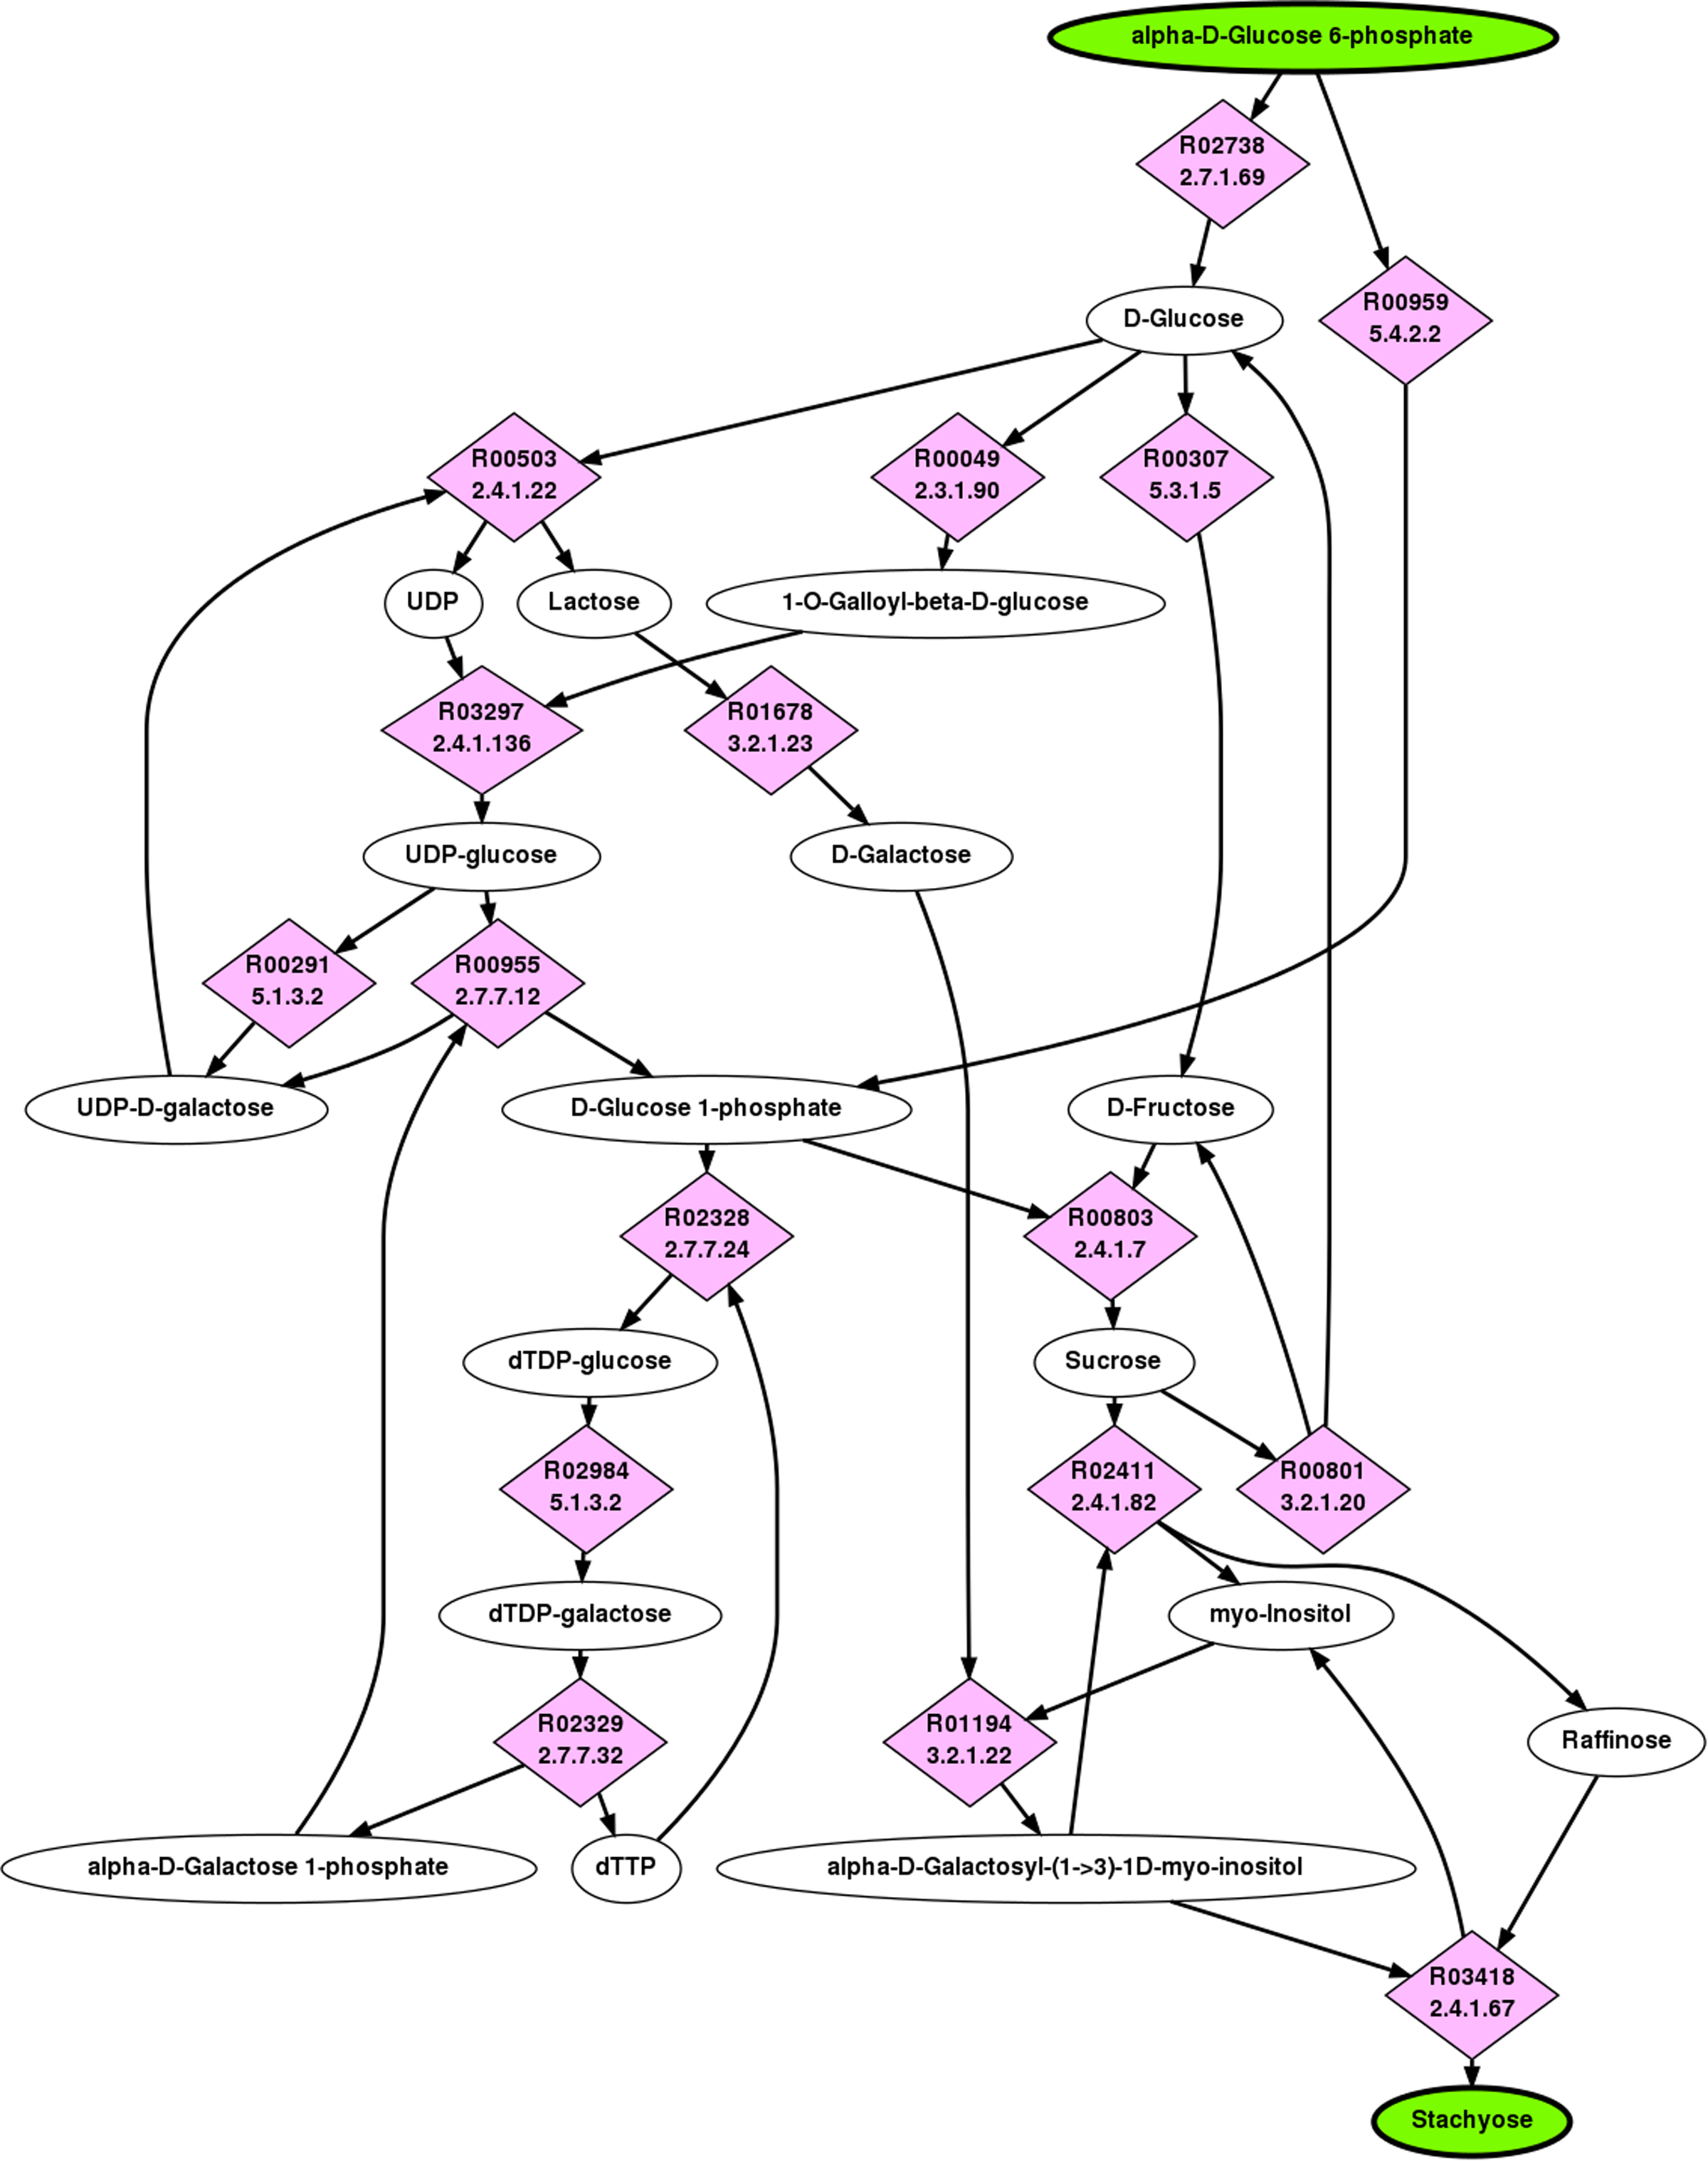
Stachyose is part of the raffinose family oligosaccharides (RFOs), which are found in many plant species (Sprenger and Keller, 2000). Starting from G6P, the stachyose pathway has three major branching points. The first is in making sucrose, typically from some form of fructose and glucose, the second and third is the addition of galactose, provided by α-
The top ranking pathway returned by BPAT-M is depicted in Figure 3. The initial LPAT search was given as input to conserve at least three carbons, which returned 10,760 linear pathways. The linear pathways contained 15 different TAMs, resulting in 908 mutually exclusive combinations. The top ranking pathway found by BPAT-M closely corresponds to the known stachyose biosynthesis pathway. While the pathway used to produce sucrose may vary in different organisms, the top ten returned pathways for BPAT-M also varied by the reaction and pathways leading to sucrose.
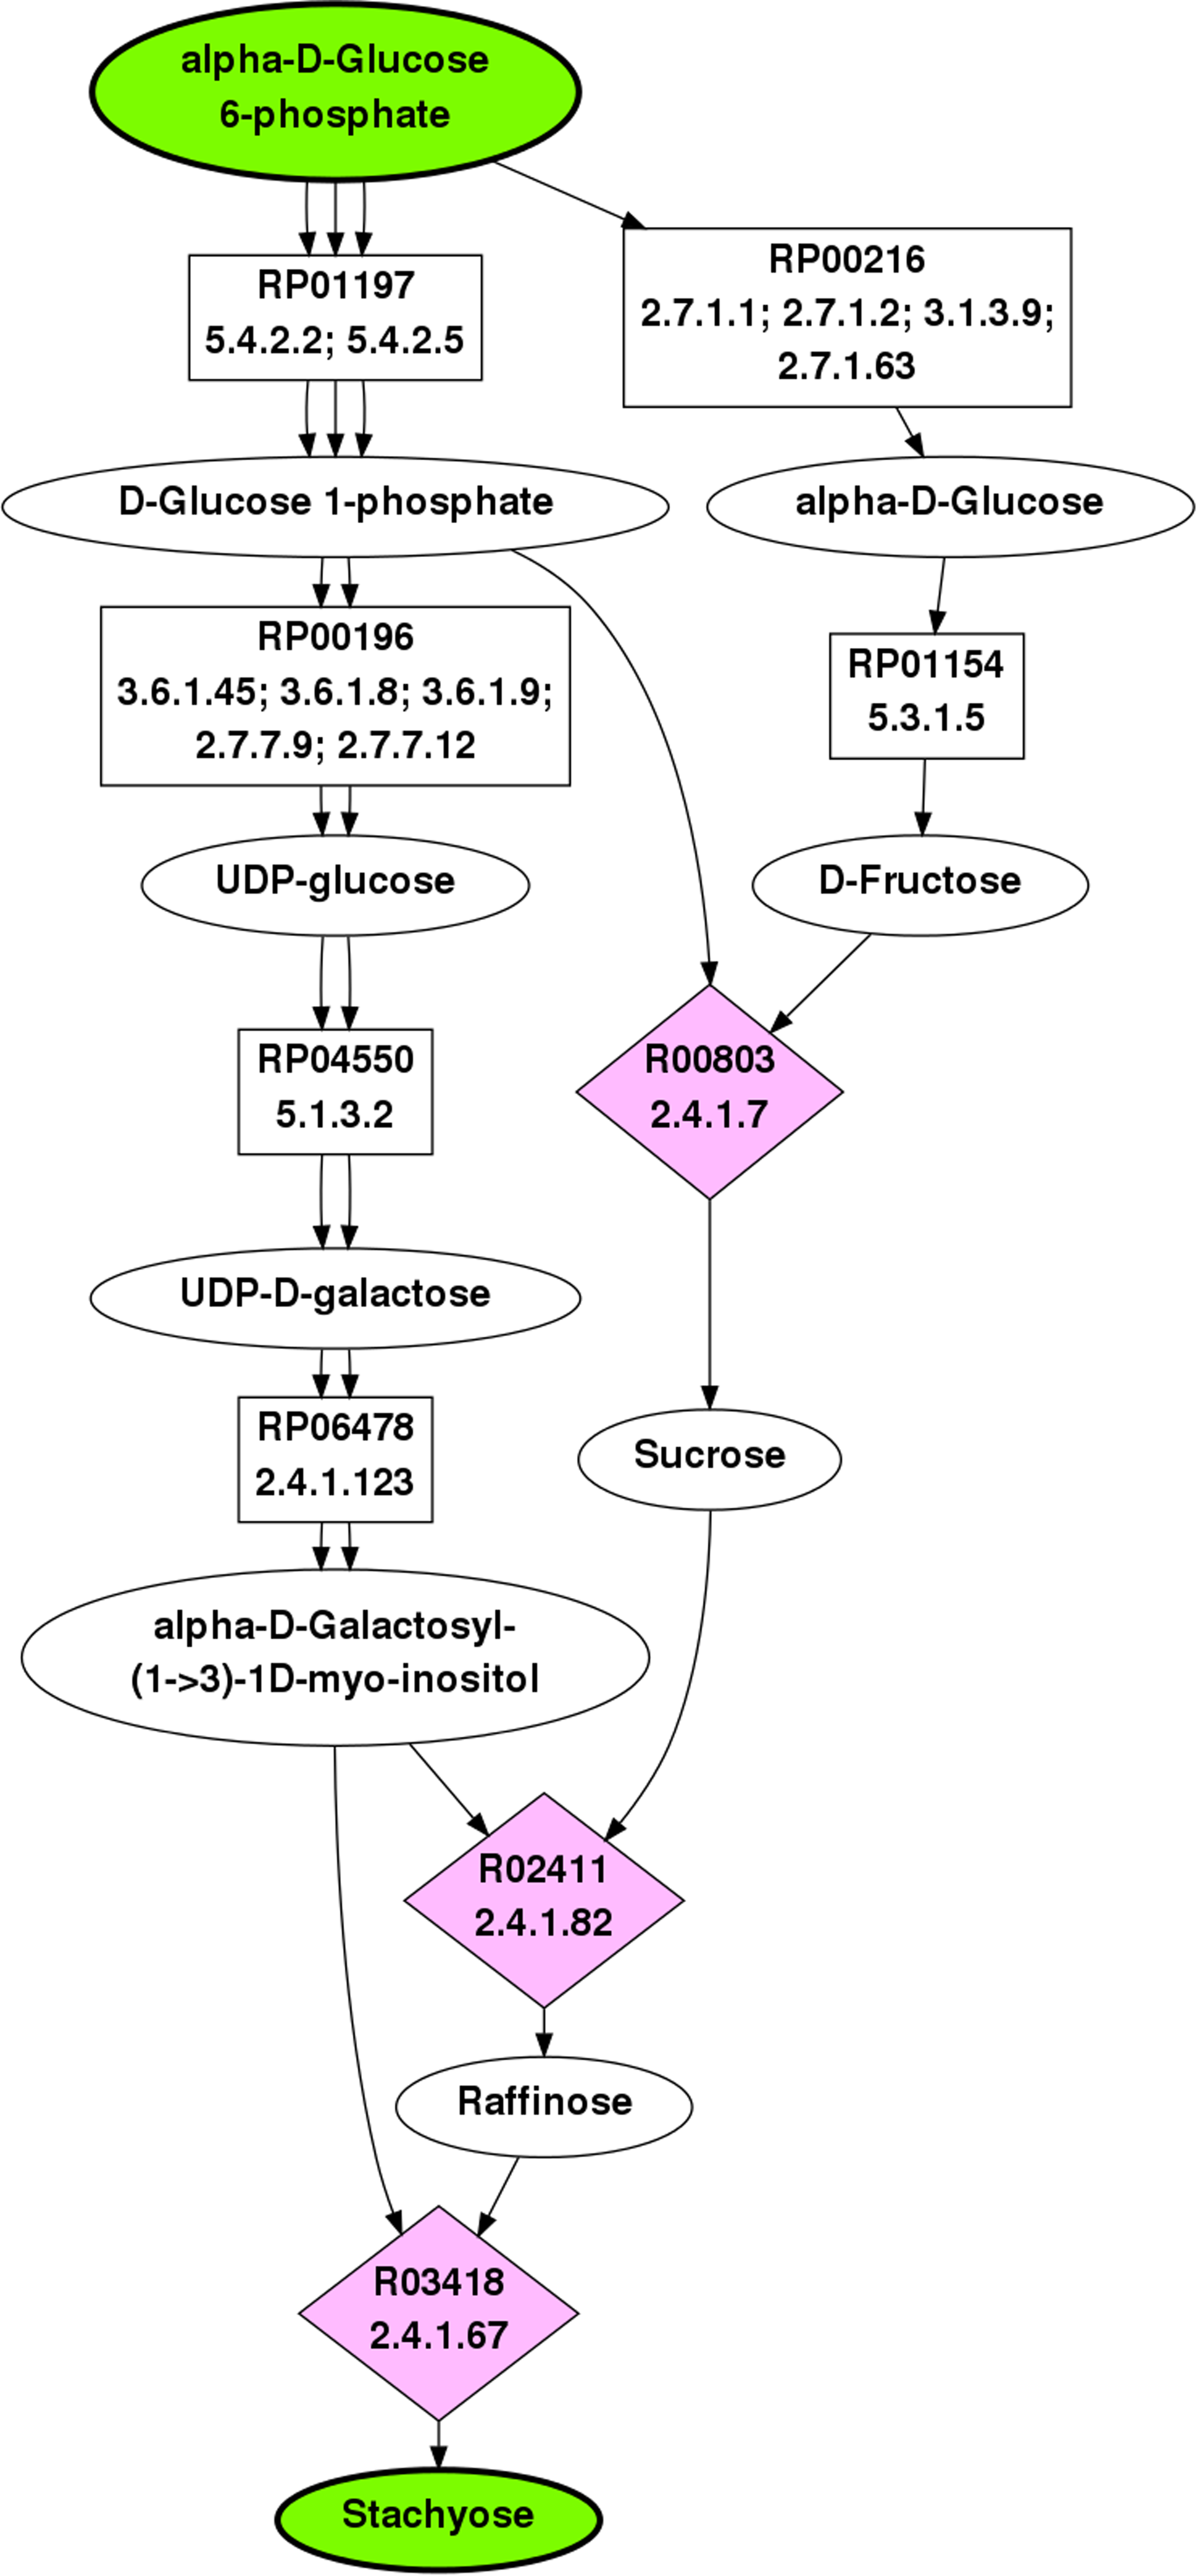
Top ranked pathway from G6P to Stachyose as found by BPAT-M. The ellipses are compounds, with the start and target compounds highlighted in green, the boxes are mapping nodes that correspond to RPAIRs, and the pink diamonds contain the KEGG ID and EC numbers for reactions. Each edge in the pathway figures correspond to one molecule of the compound being used as a substrate or product of the reaction. This pathway uses four molecules of G6P to produce one molecule of stachyose.
4.2.2. α-d -Glucose 6-phosphate to erythromycin
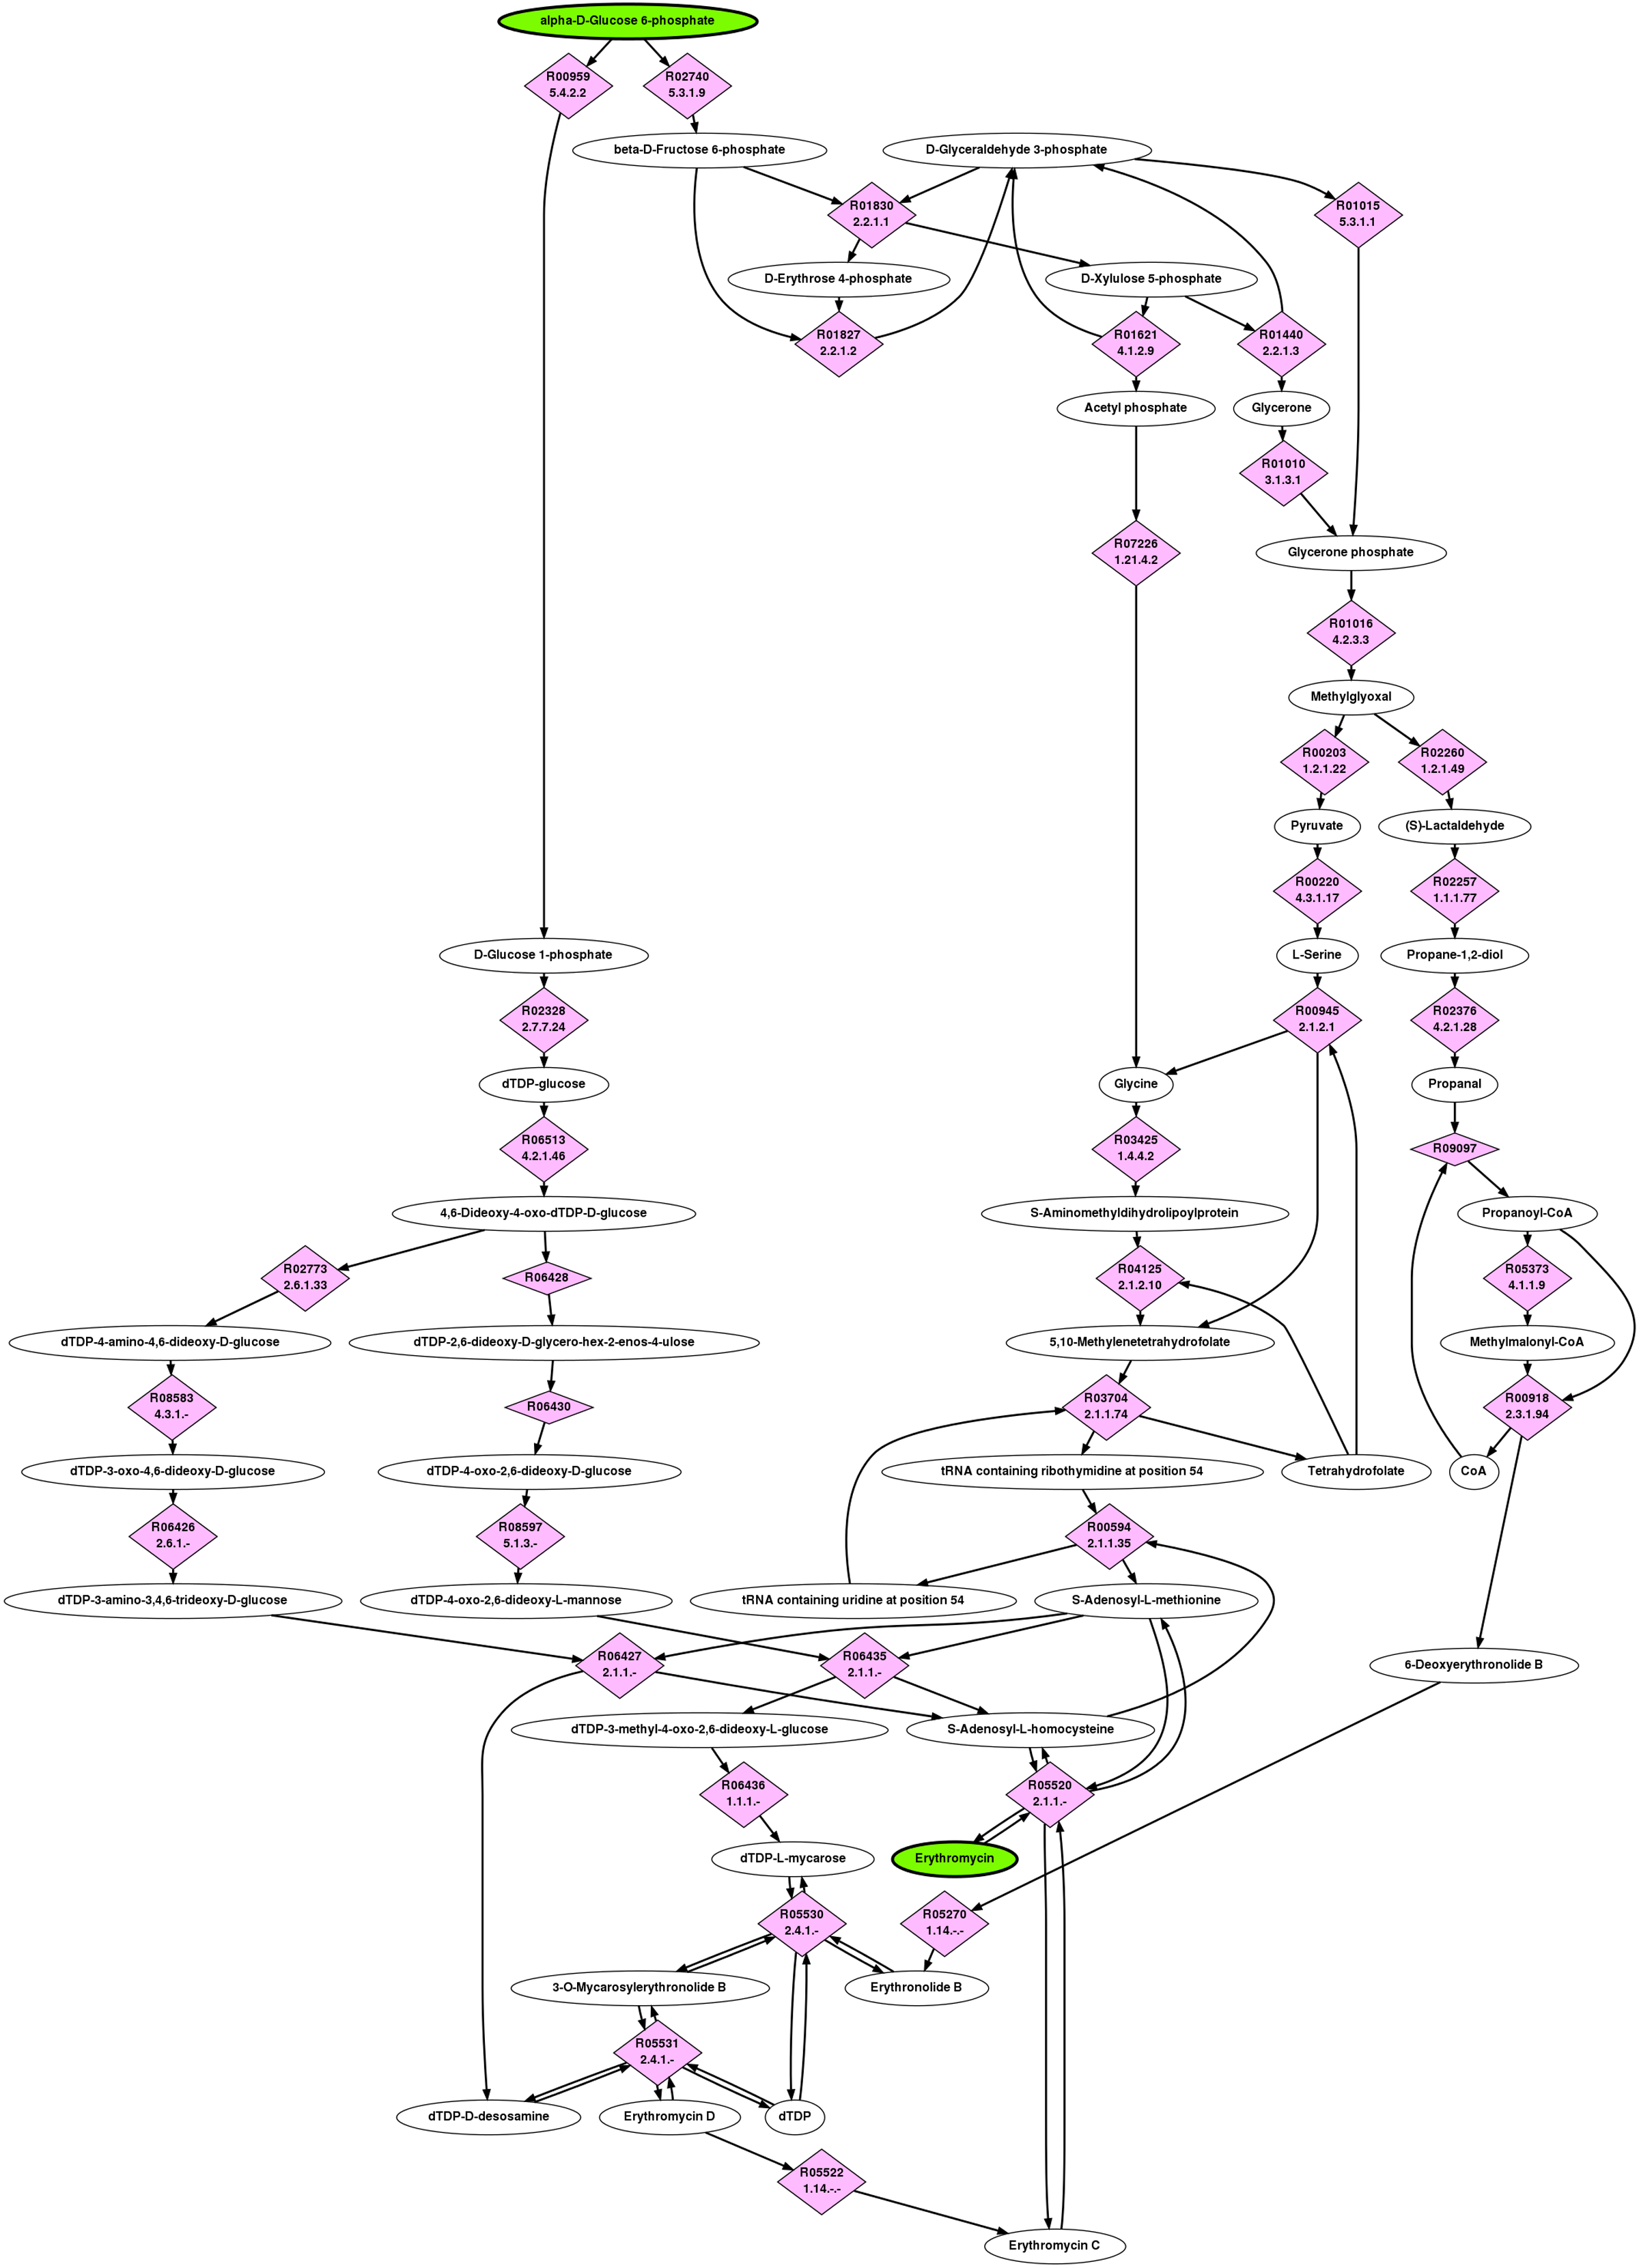
Erythromycin is a highly successful, broad-spectrum, macrolide antibiotic discovered in the early 1950s and quickly became the preferred drug for a wide variety of infections (Washington and Wilson, 1985a,b). Erythromycin is produced by bacteria Saccharopolyspora erythraea and is difficult to synthesize in the laboratory (Pal, 2006). Therefore, several metabolic engineering approaches have been taken to improve the production of erythromycin and erythromycin precursors, both by modifying S. erythraea or inserting the genes required into other microorganisms such as E. coli (Nielsen, 1998; Pfeifer et al., 2002; Chen et al., 2008; Reeves et al., 2007). The biosynthesis of erythromycin has been well characterized and proceeds in two major steps. The first is the construction of the macrocyclic lactone intermediate, 6-deoxyerythronolide B (6DB) by 6DB synthase from six molecules of methylmalonyl-CoA and one propanoyl-CoA (Khosla et al., 2007). 6DB then undergoes a series of modifications that includes the attachment of two sugars,
The top ranked pathway returned by BPAT-M is highly similar to the known pathway for the biosynthesis of erythromycin using G6P as the start compound. This top ranked pathway is depicted in Figure 4. The initial LPAT search used by BPAT-M conserves three carbons, resulting in 11,217 linear pathways. The pathways have 16 unique TAMs which then produce 5,359 mutually exclusive combinations. The BPAT-M search took less than 4 minutes to complete.
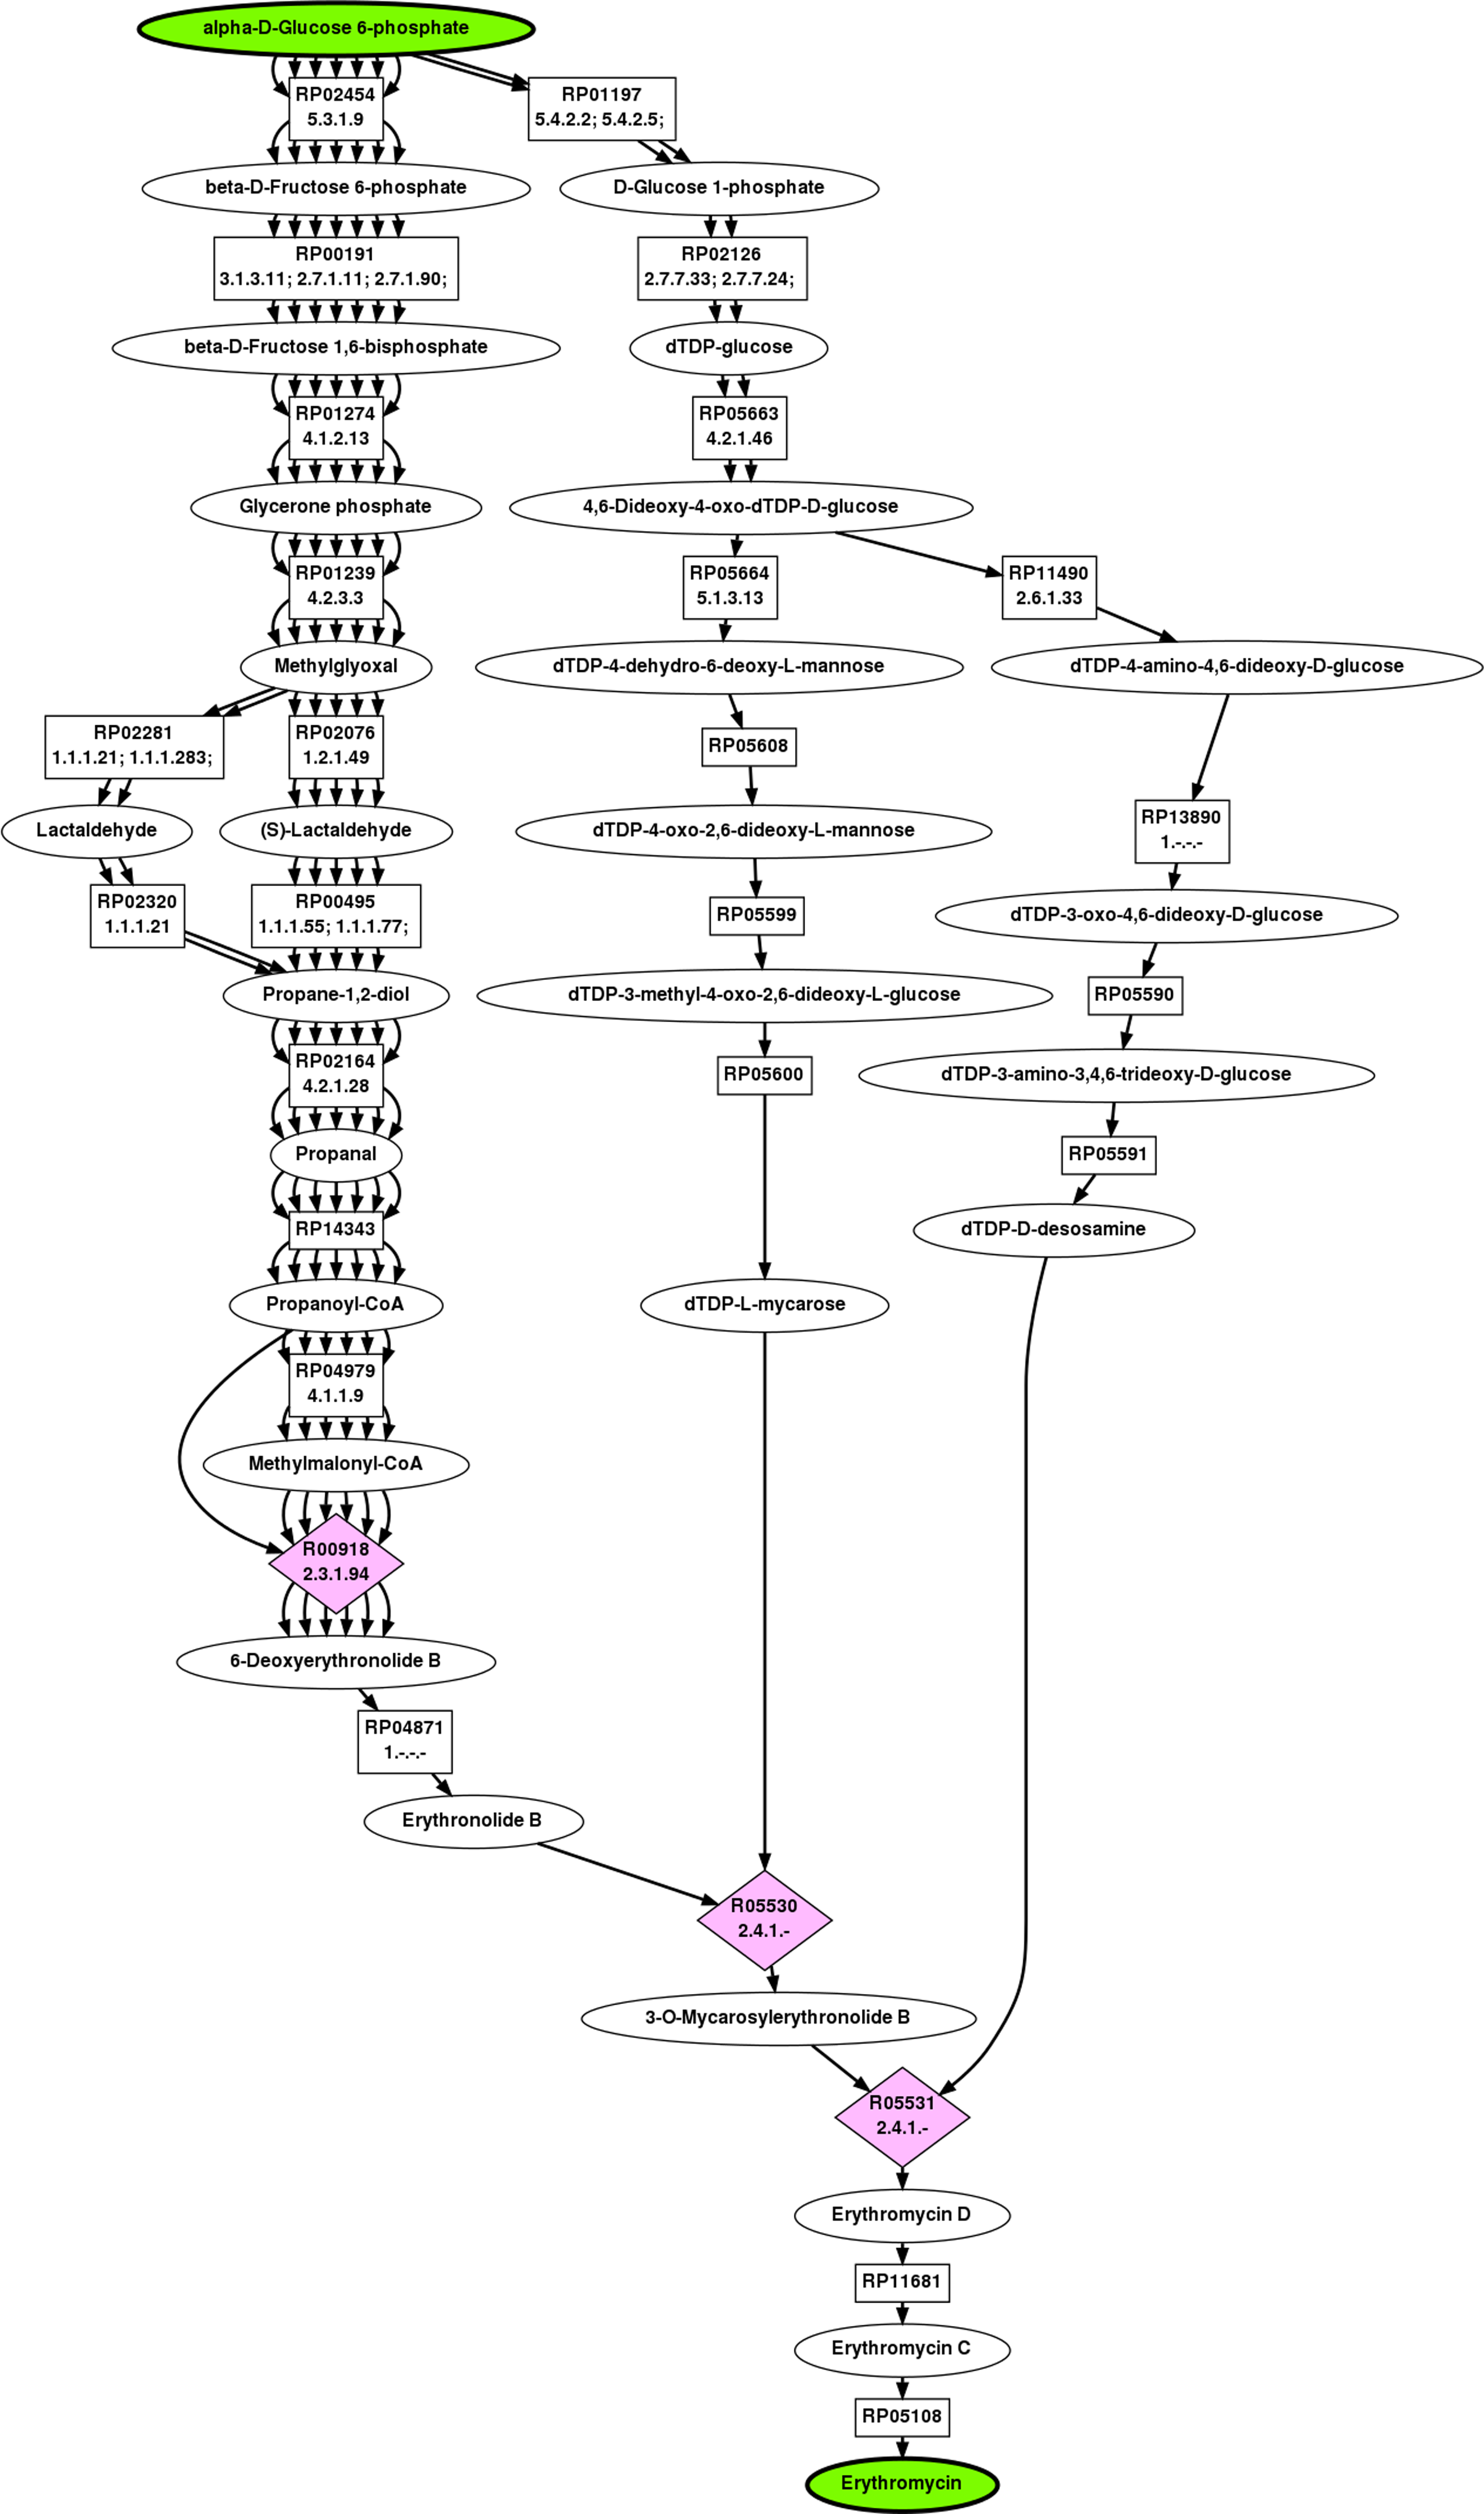
Full pathway returned as the top result for G6P to erythromycin by BPAT-M.
4.2.3. α-d -Glucose 6-phosphate to cephalosporin C
Cephalosporin C is a β-lactam antibiotic, synthesized by certain bacteria and fungi, but not used clinically because of its low potency (Demain and Elander, 1999). However, it is an important precursor for a number of related antibiotics and has been a target for increased production using metabolic engineering approaches (Thykaer, 2003). The biosynthetic pathway for cephalosporin C includes an reaction that synthesizes δ-(
The top ranked pathway returned by BPAT-M is depicted in Figure 5. Three was the minimal number of carbons to conserve for the initial LPAT search. This resulted in 33,095 linear pathways with five unique TAMs. From the five TAMs, there were 18 mutually exclusive combinations. The pathway found by BPAT-M correctly identifies the crucial reaction catalyzed by ACV synthetase, which requires three different substrate compounds and produces ACV as the product. At the same time, the pathways from G6P to

Top ranked branched metabolic pathways for G6P to cephalosporin C as found by BPAT-M.
4.2.4. α-d -Glucose 6-phosphate to inosine monophosphate
Inosine monophosphate (IMP) is an important intermediate in the formation of purine nucleotides and nucleosides. The de novo biosynthesis of IMP from glucose proceeds by first forming the ribose component (PRPP) from
The IMP pathway demonstrates a case where BPAT-M does not perform very well. The top ranked pathway found by BPAT-M is illustrated in Figure 6. This pathway was found by using linear pathways from LPAT that conserve one carbon. The linear pathways contained 14 unique TAMs, resulting in 190 mutually exclusive combinations. BPAT-M's performance is affected by the large number of short salvage pathways that conserve carbons from G6P to IMP through the ribose component. In the top ranked pathway, this is illustrated by the salvage reaction from 5-phospho-alpha-
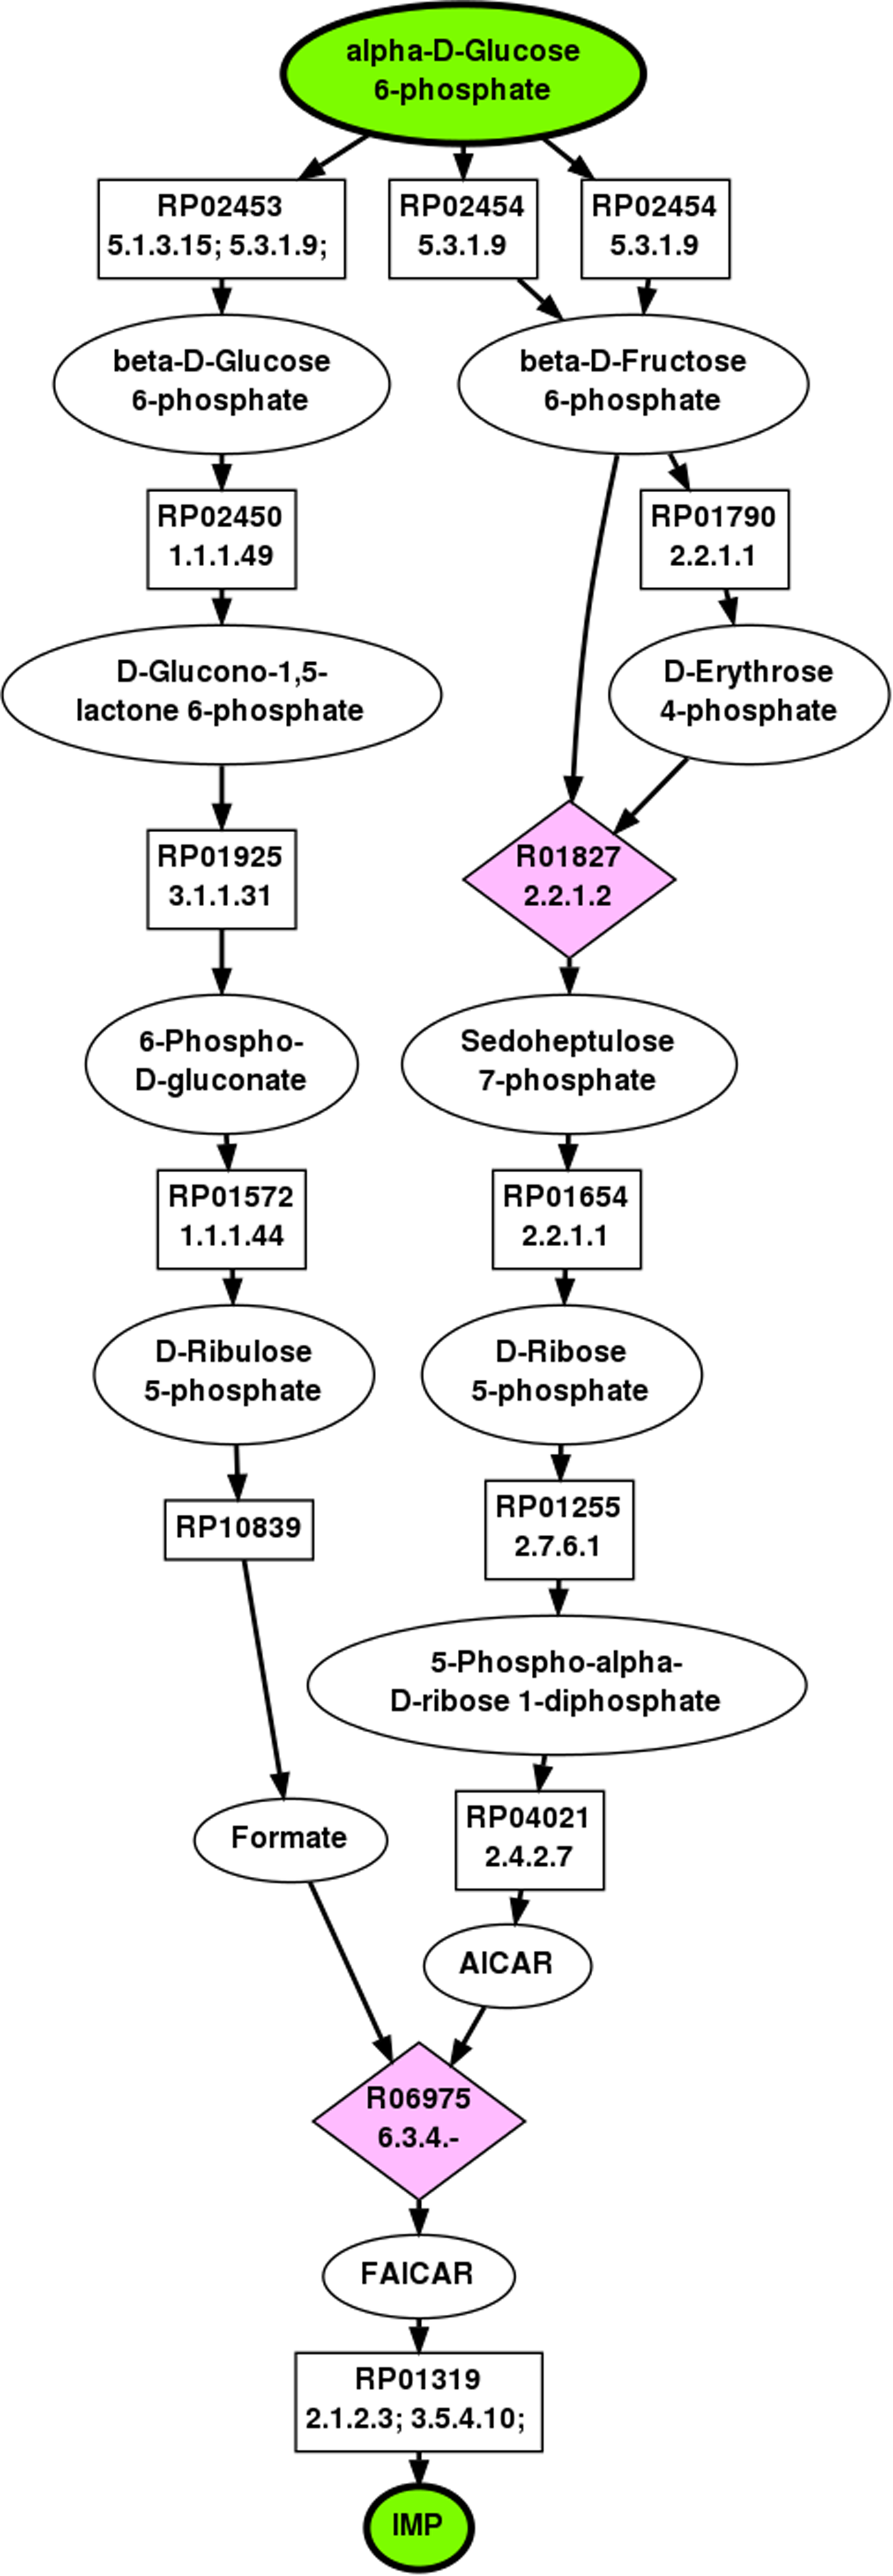
Top ranked pathway from G6P to IMP as found by BPAT-M.
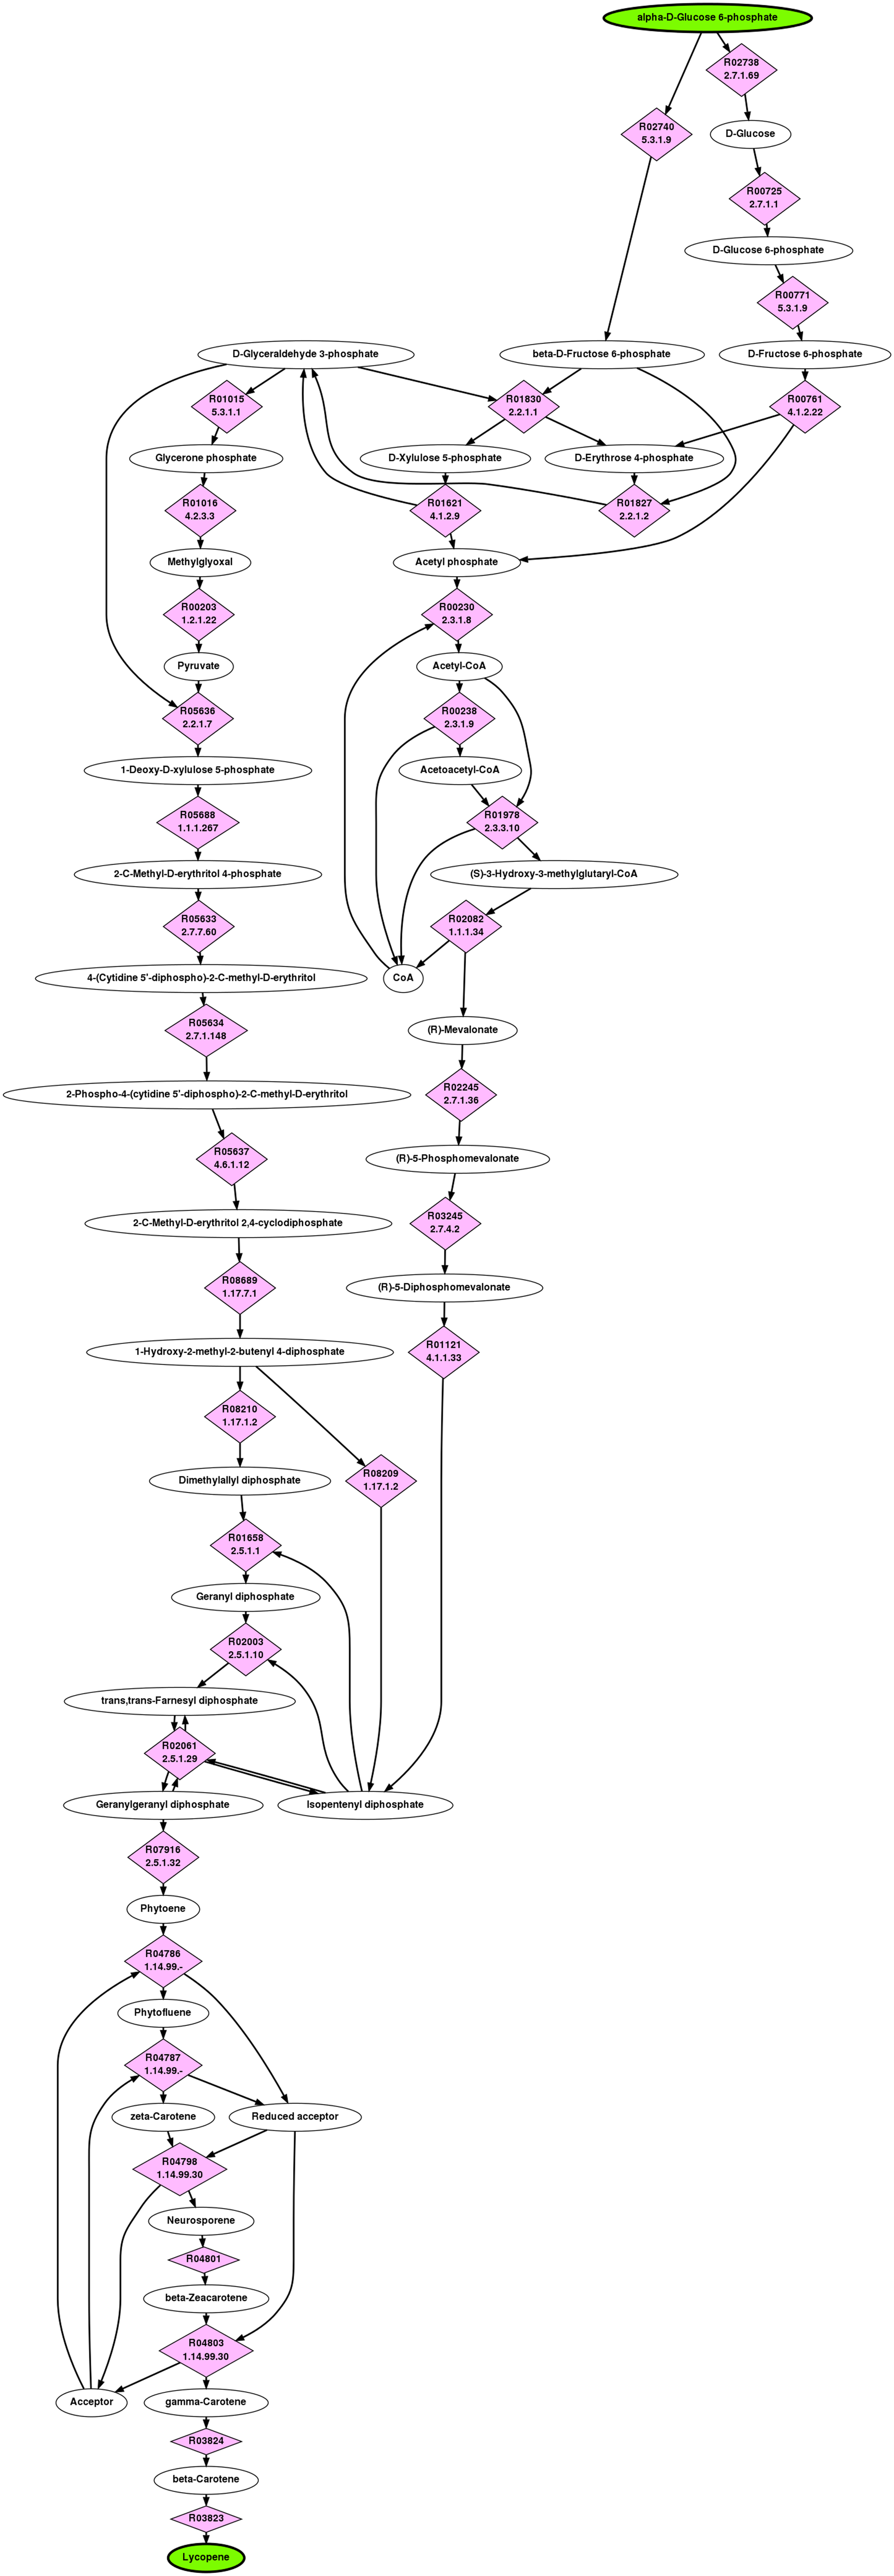
4.2.5. α-d -Glucose 6-phosphate to lycopene
Lycopene is a C40 carotenoid having a bright red color and is found in fruits and vegetables such as tomatoes and watermelons. Lycopene's nutritional and pharmaceutical potential has resulted in a number of investigations on using metabolic engineering techniques to increase yield and/or produce lycopene in microbial hosts (Alper et al., 2005; Vadali et al., 2005; Yoon et al., 2007). The known biosynthesis pathway of lycopene is relatively well understood and contains an interesting “woven” topology; isopentenyl diphosphate (IPP) and dimethylallyl diphosphate (DMAPP) are produced by either the 2-C-methyl-
The top ranked pathway from G6P to lycopene returned by BPAT-M is depicted in Figure 7. The set of linear pathways used from LPAT were given as input three carbons to conserve, resulting in 31,726 linear pathways. These linear pathways contained 16 unique TAMs which were combined into 6,301 mutually exclusive combinations. BPAT-M successfully identifies the known “woven” topology of the lycopene biosynthesis pathway, starting with IPP and DMAPP. As shown in the next section, BPAT-M required significantly more time to search for the lycopene pathway compared to the other test cases. This is partially caused by having to test more mutually exclusive combinations of TAMs, which shows the importance of utilizing the biochemical constraints provided by the TAMs to reduce the running time. If the TAMs where not utilized, the number of combinations of linear pathways tested would require an unreasonable amount of computation.
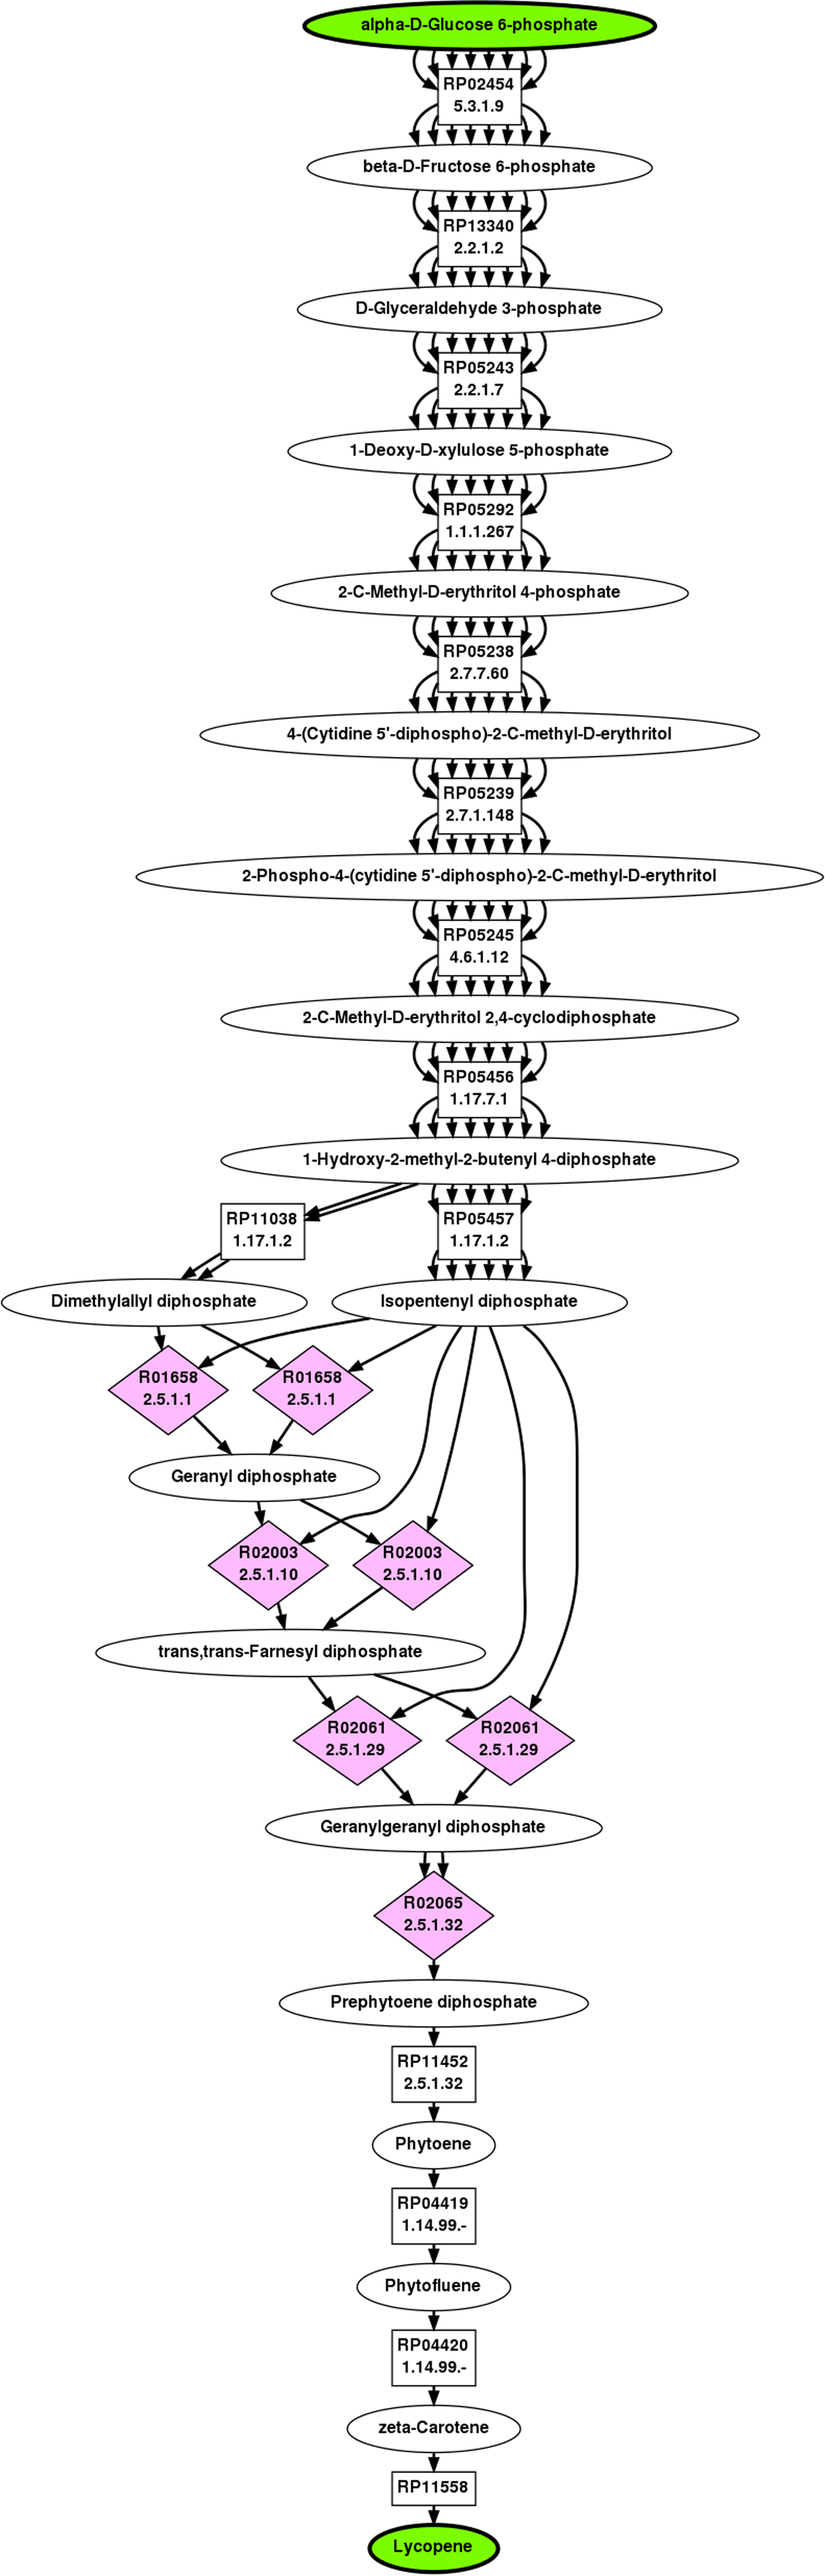
Top ranked branched metabolic pathway for G6P to lycopene as found by BPAT-M.
4.3. Comparison of BPAT-M to existing algorithms for finding branched metabolic pathways
In this section, the results of BPAT-M as presented in Section 4.2 are compared to searches for the same pathways by BPAT-S (Heath et al., 2010) and ReTrace (version 1.03) (Pitkänen et al., 2009). BPAT-S and ReTrace were provided the same KEGG data, including the reversibility data, as described in Section 4.1. BPAT-S utilized the same Gam as BPAT-M. ReTrace processes the KEGG data separately and builds a different type of graph where each node corresponds to one atom. ReTrace reported 272 RPAIR errors and built a graph with 293,907 nodes and 300,115 edges. For BPAT-S the default value of k given to the initial LPAT search was reduced to 500,000, as BPAT-S finds new linear pathways to be used as branches during the search. BPAT-S was implemented in Java and utilizes the same libraries as BPAT-M. ReTrace is implemented in Python.
The ReTrace parameter called k was set to the same values used for the IMP pathway search results reported in Pitkänen et al. (2009): 100 for the first depth, 25 for the second depth, and 1 for the depths thereafter. The maximum depth for ReTrace was set to 10, due the large number of branches present in many of the test cases. The rest of the ReTrace parameters were left at their default values. The pathway figures for the ReTrace results contain all reactions because ReTrace selects a reaction for each RPAIR used in the search. BPAT-S and BPAT-M take a slightly different approach and return pathways that still contain the mapping nodes and only select reactions required for the branch points.
4.3.1. Wall time for finding branched metabolic pathways
The wall times, excluding time for parsing and processing data, of the pathway searches by BPAT-M, ReTrace and BPAT-S are plotted in Figure 8a, 8b and 8c, respectively. For all cases, BPAT-M took the least amount of time, with BPAT-M and ReTrace both requiring significantly less time than BPAT-S. Due the heuristic nature of all of the algorithms, it is difficult to predict how much time a pathway search will require. Additionally, the amount of time required for each algorithm is dependent on parameter selection. Making the parameter values more restrictive will reduce the running time for all of the algorithms, at the expense of missing potential results. We chose parameters with the goal of having comparable levels of search, but this is still done in an ad hoc manner. Further investigation is required to fully understand the implications of different parameter values on the search and resulting pathways.

Computational time required for each test case for BPAT-M (
4.3.2. Comparison to BPAT-S
In general, the results found by BPAT-S do not justify the significantly longer times required, as compared to BPAT-M. For example, the top ranking pathway found by BPAT-S for stachyose is exactly the same as the top ranking pathway found by BPAT-M in Figure 3. To find the same pathway, BPAT-S took about 9 hours while BPAT-M took about 4 minutes. The one notable exception is the IMP pathway. The top ranking pathway returned by BPAT-S for IMP is illustrated in Figure 9. The methodology of BPAT-S enables it to start with a seed pathway for the ribose component of IMP and then search for a branch that corresponds to the construction of the purine base.

Top ranked pathway from G6P to IMP as found by BPAT-S. To fit on the page, the BPAT-S figure has been simplified by placing a larger blue arrow between GAR to AICAR to represent the path between them, which is described in the text and correctly found by BPAT-S. The full BPAT-S pathway, along with the top ranked pathways for all five test cases, can be viewed at www.kavrakilab.org/data/bpatm-jcb-2011-supp.
One of the branches that BPAT-S finds contains the proper sequence of reactions through glycine to AICAR. However, because the original seed pathway utilized a reversible salvage reaction from 5-phospho-α-D-ribose 1-diphosphate (PRPP) to AICAR, the attached branch uses an unfavorable set of reactions that first remove the ribose component AICAR to make 5-amino-4-imidazolecarboxyamide. This is then combined with PRPP from the seed pathway to make FAICAR and continue to IMP. This unfavorable pathway found in the top ranking result of BPAT-S makes judging the quality of the path difficult. While the pathway has a high level of overlap with the known compounds and reactions composing the IMP biosynthesis pathway, it contains an unlikely branch point in a critical part of the pathway.
In a several other cases, BPAT-S is able to find branches that BPAT-M is unable to find because they do not exist in the original set of linear pathways. For example, in the erythromycin pathway, BPAT-S identifies a branch that goes through S-adenosyl-
4.3.3. Comparison to ReTrace
Overall, the pathways found by ReTrace identify similar key components of the branched pathways as described in Section 4.2. They also contain substantial differences from the pathways found by both BPAT-M and BPAT-S. These observations are demonstrated by the top ranked stachyose pathway returned by ReTrace, illustrated in Figure 10. The stachyose pathway found by ReTrace contains the key branch points of the formation of sucrose and the sequential additions of galactose from α-
Top ranked pathway from G6P to Stachyose as found by ReTrace. For clarity, compounds other than the start and target compound that do not act as both substrates and products have been removed from the figure. The figure with all compounds included can be viewed www.kavrakilab.org/data/bpatm-jcb-2011-supp.
A similar comparison can be made of the erythromycin pathway returned by ReTrace, illustrated in Figure 11, with the pathway returned by BPAT-M. The erythromycin pathway from ReTrace finds the reactions that construct 6DB and attach the two sugars,
Top ranked pathway from G6P to Erythromycin as found by ReTrace. For clarity, compounds other than the start and target compound that do not act as both substrates and products have been removed from the figure. Due to the size of the pathway, the node labels may not be legible, and the reader is referred to our website, where the full pathway can be viewed in greater detail (see www.kavrakilab.org/data/bpatm-jcb-2011-supp).
The top ranking result for celphalosporin C from ReTrace, which can be found at our website (see www.kavrakilab.org/data/bpatm-jcb-2011-supp), provides a third example of the same comparative theme; the pathway contains the crucial reaction resulting in ACV while also containing a number of additional reactions and cycles not found in the BPAT-M pathway. The stachyose, erythromycin and celphalosporin C pathway results underscore the difficulty of comparing the quality of found branched metabolic pathways. One perspective is that the additional reactions and cycles are spurious should not be included in the pathway, making BPAT-M have the “better” result. Another perspective is that these reactions may have important implications for the core part of the stachyose pathway and should be included in the pathway, making ReTrace have the “better” result.
The top ranking pathway for lycopene found by ReTrace, depicted in Figure 12, contains both the MEP/DOXP pathway for DMAPP and MVA pathway for IPP, thus revealing the variety available. In comparison, the BPAT-M pathway in Figure 7 only uses the MEP pathway to synthesize both IPP and DMAPP. The MEP/DOXP and MVA pathways demonstrate how search tools for metabolic pathways can illuminate alternative pathways that may be found in different organisms. The ability to automatically find different pathways that can be used to produce the same compound is of great use in areas such as metabolic engineering or identifying and evaluating drug targets. At the same time, the ability to find alternative or novel pathways makes it more difficult to judge the performance of different algorithms. The resulting pathways from ReTrace and BPAT-M are biochemically correct in the usage of MEP/DOXP and MVA pathways, but one may be preferred over the other based on the specific application in mind.
Top ranked pathway from G6P to Lycopene as found by ReTrace. For clarity, compounds other than the start and target compound that do not act as both substrates and products have been removed from the figure. Due to the size of the pathway, the node labels may not be legible and the reader is referred to our websites, where the full pathway can be viewed in greater detail (see www.kavrakilab.org/data/bpatm-jcb-2011-supp).
5. Discussion
We have described and tested a new algorithm, BPAT-M, for identifying branched metabolic pathways by utilizing atom tracking information to efficiently merge together biochemically interacting linear pathways. The experimental results highlight both the strengths and weaknesses of the approach taken by BPAT-M, as compared to earlier approaches, namely BPAT-S and ReTrace. These results reveal that an algorithm's performance may depend on the underlying structure of the pathway. The merging approach used by BPAT-M will likely perform better if all of the branches conserve at least the given number of atoms and are of similar length. For example, the erythromycin pathway follows this scheme and BPAT-M is able to find pathway in minutes instead of the hours taken by ReTrace and BPAT-S. In contrast, BPAT-M does not perform well on the IMP pathway because it contains pathways of many different lengths that provide different numbers of atoms. This type of pathway may be better addressed using the approach taken by ReTrace and BPAT-S, where new branches are found as required. Since the merging approach of BPAT-M is complementary to the approach taken by ReTrace and BPAT-S, one future direction would be to combine the algorithms to take advantage of their different strengths. Other areas of future work include allowing multiple start and target compounds to be used as input, utilizing other sources of metabolic data and developing ways to mine the resulting pathways to help the user understand them.
Further work is also required to develop meaningful evaluation methods for branched metabolic pathways. The experimental results highlight that comparing branched metabolic pathways is nontrivial, especially if the goal is to find alternative or novel pathways. The evaluation process also depends on the particular application for the resulting pathways. In applications such as metabolic network reconstruction, it is typically desirable to find pathways that are similar to metabolic pathways known to exist in organisms. However, in applications such as metabolic engineering and synthetic biology, it can be desirable to find alternative pathways or pathways that do not exist in one single organism. At the same time, the algorithms must be validated so that there is confidence that the pathways are not meaningless. A further complication in evaluating the algorithms is that path finding algorithms use a number of heuristic parameters, due to the difficulty of the problem. In the case of the algorithms examined in this paper, the parameters adjust the trade-off between the solutions found and the running time of the search. While we strove to choose reasonable parameters for the different algorithms in this study, there remain many questions about the impact of parameter selection. Continuing to improve metabolic path finding will require the development of standard evaluation techniques and gaining better understanding of parameter choices. While it is currently difficult to identify a priori which method will perform better, it is reasonable to try different algorithms and analyze the results to gain better understanding of metabolic pathways.
Footnotes
Acknowledgments
A.P.H. and L.E.K. were supported in part by the NSF (ABI-0960612, NHARP 01907), a fund from the John & Ann Doerr Fund for Computational Biomedicine at Rice University, and a Sloan Fellowship. A.P.H. is a fellow with the Shell Center for Sustainability (SCS) at Rice University and is partially supported by an SCS grant. Computational resources were provided by the Shared University Grid at Rice (funded by the NSF under grant EIA-0216467 and a partnership between Rice University, Sun Microsystems, and Sigma Solutions, Inc.).
Disclosure Statement
No competing financial interests exist.