
Abstract
Abstract
Investigators require intuitive tools to rationalize complex datasets generated by transcriptional profiling experiments. Pathway analysis methods, in which differentially expressed genes are mapped to databases of reference pathways to facilitate assessment of relative enrichment, lead investigators more effectively to biologically testable hypotheses. However, once a set of differentially expressed genes is isolated, pathway analysis approaches tend to ignore rich gene expression information and, moreover, do not exploit relationships between transcripts. In this article, we report the development of a new method in which both pathway topology and the magnitude of gene expression changes inform the scoring system, thereby providing a powerful filter in the enrichment of biologically relevant information. When four sample datasets were evaluated with this method, literature mining confirmed that those pathways germane to the physiological process under investigation were highlighted by our method relative to z-score overrepresentation calculations. Moreover, non-relevant processes were downgraded using the method described herein. The inclusion of expression and topological data in the calculation of a pathway regulation score (PRS) facilitated discrimination of key processes in real biological datasets. Specifically, by combining fold-change data for those transcripts exceeding a significance threshold, and by taking into account the potential for altered gene expression to impact upon downstream transcription, one may readily identify those pathways most relevant to pathophysiological processes.
1. Introduction
A considered approach must be taken to the normalization and background correction of raw array data to most effectively suppress technical errors while maintaining biological variation, and a number of methods are available, dependent upon experimental design (Allison et al., 2006). Further statistical approaches are deployed in the identification of differentially expressed genes (DEGs) between groups (Pan, 2002; Dudoit et al., 2002). Genes may be filtered simply by fold change, and while the insights gained from resulting lists are generally limited, they do have utility for example in the identification of disease biomarkers (Borovecki et al., 2005; Dardousis et al., 2007). As the identification of co-regulated genes may highlight underlying processes, so clustering of transcripts by expression profile (K-means or Bayesian methods are often used) may provide additional insight (Ben-Dor et al., 1999; Eisen et al., 1998). The lack of a systematic vocabulary to describe gene function slowed initial efforts to identify the contribution of specific biological processes to phenotypes. The implementation of a structured language promoted by the Gene Ontology project, in which genes were categorized according to cellular component, biological process, and molecular function, facilitated the grouping of transcripts of related function (Ashburner et al., 2000; Khatri et al., 2005; Al-Shahrour et al., 2005).
Increasingly sophisticated methods are used to identify gene expression changes clustering within discrete biological processes. For example, Fisher's exact test, measures of hypergeometric distribution, and the Chi-squared test have been used to calculate the probability of obtaining the observed number of DEGs in any pathway (Curtis et al., 2005). Other methods, notably Z-score transformation (Cheadle et al., 2003), assign each pathway with a statistical score representative of its significance or differential regulation (Tian et al., 2005; Misman et al., 2009; Curtis et al., 2005). Pathway enrichment methods are made available in a number of open-source and proprietary analysis tools such as GenMAPP, Gene-Sifter, Pathway Miner, and Ingenuity Pathway Analysis (GeneSifter® Analysis Edition, Dahlquist et al., 2002; Ingenuity® Systems, Pandey et al., 2004), but despite their popularity, there exist a number of shortcomings in such methods. Firstly, they tend to handle pathways as a collection of independent events, ignoring their relatedness. An awareness of the topology of a pathway is critical in assessing the contribution of an individual DEG to the phenotype, thus weighting DEGs according to their contribution to a biological process should enhance analysis. Secondly, in many existing enrichment methods, gene expression data is discarded once the significant gene list is created. An improved method should use all of the relevant biological information available as exploiting both topological and fold-change data will increase discriminatory power. Indeed, this rationale does inform emerging approaches, for example methods using either topologies (Gao and Wang, 2007; Vert and Kanehisa, 2003) or fold-change data (Subramanian et al., 2005) have been described. (Tarca et al., 2009) described a Signaling Pathway Impact Analysis (SPIA) method in which each gene in a pathway was assigned a gene perturbation factor, calculated by a formula that combined both gene expression and topology information. This method was optimized for signaling pathways in order that higher-order relationship information between encoded proteins (activation or repression) could be used. However, a method with a potential for broader utility is required, and herein we describe a new approach that detects significantly regulated pathways by exploiting both topology and fold-change data to generate a pathway regulation score (PRS). Our algorithm was not informed by a systems-level view, rather we sought to create a logical means of enriching array data that would rapidly lead biologists to new insights rather than create a predictive model. Biological pathways assume many forms, including biochemical enzyme-substrate processes, linear or branching signaling cascades, and protein-DNA binding: reducing this complexity to a defined set of mathematical principles is complex. In the first instance, we chose to focus on signaling pathways to facilitate comparison to earlier studies, although our method may readily be expanded to any biological pathway as the heuristic does not rely upon signaling pathway specific information. However, a number of other problems must also be solved to maximize accuracy; for example, it is necessary to handle loops to ensure that transcripts are counted only once. We used graph theory to establish relationships within pathways and overcome the looping problem. Many pathway descriptions are highly redundant and not particularly topologically rich, so we also developed a method to redraw pathways in cases where nodes were represented multiple times in order to mitigate their contribution.
Unfortunately, no objective measure of pathway ranking methods exists, so we employed both statistical and biological approaches. Firstly, a probability value was calculated for getting a more significant result of a pathway score by chance then it was adjusted for false discovery rate (FDR) to give a p-value for our pathway score. Secondly, we compared pathway ranking by PRS to Z-score with respect to reported biological relevance.
2. Methods
2.1. Data pre-processing
Raw data was downloaded from the Gene Expression Omnibus (http://www.ncbi.nlm.nih.gov/geo/) and preprocessed using the RMA method as standard. Two criteria were used to create DEG lists: simple fold change and p-value (calculated using a simple t-test). Fold-change criteria are arbitrary, traditionally informed by the likelihood of replicating gene expression changes with an independent technique (particularly real-time PCR). A twofold cut-off is often used, but this may be reduced to 1.5-fold in datasets yielding a relatively small group of DEGs in order to populate a larger list. When calculating fold-change values between two sets of replicates, we routinely use median values to mitigate the contribution of outliers. Four sample datasets from the open access Gene Expression Omnibus (GEO) database were used in this study. The first described a colorectal cancer study in which gene expression data from 32 colorectal cancer biopsies were compared to 32 control tissues using an Affymetrix GeneChip U133-Plus 2.0 platform (GEO accession GDS2947). This dataset was also used as a reference by Sabates-Bellver et al. (2007). The second dataset described the transcriptional consequences of exposing differentiating human adipocytes in culture to macrophage conditioned media (CM) using Agilent Whole Human Genome arrays (O'Hara et al., 2009). These latter data were kindly supplied by Paul Trayhurn, but they are also available from GEO (accession no. GSE14312). The third dataset derived from a comparison between normal hematopoietic cells isolated from 38 healthy donors and leukemic blasts from 26 AML patients (Stirewalt et al., 2008) (GEO accession no. GSE9476). The final dataset described the profiling of ovarian surface epithelia from normal and malignant tissue (Bowen et al., 2009) (GEO accession no. GDS3592). Fold-change thresholds of ≥1.5 (p < 0.05) were used for the colorectal cancer and AML datasets, and a threshold of ≥2.0 (p < 0.01) was used for the adipocyte and ovarian cancer datasets.
2.2. Pathway database organization
The Kyoto Encyclopedia of Genes and Genomes (KEGG) database is an invaluable resource, containing descriptions of a huge range of biological pathways from a variety of organisms. We used 108 signaling pathways whose description files are written in KEGG mark-up language (KGML). In each KGML file, a pathway is comprised of two main components, entries and relations. Each entry represents one or more genes (the latter in the case of enzyme complexes, or where the same function can be performed by different proteins, for example in different tissue compartments), while the relation represents a connection between two entries. This relationship is assigned a type (expression or inhibition) and identified by the two entries' IDs. We used this information to represent pathways as graphs (Fig. 1).
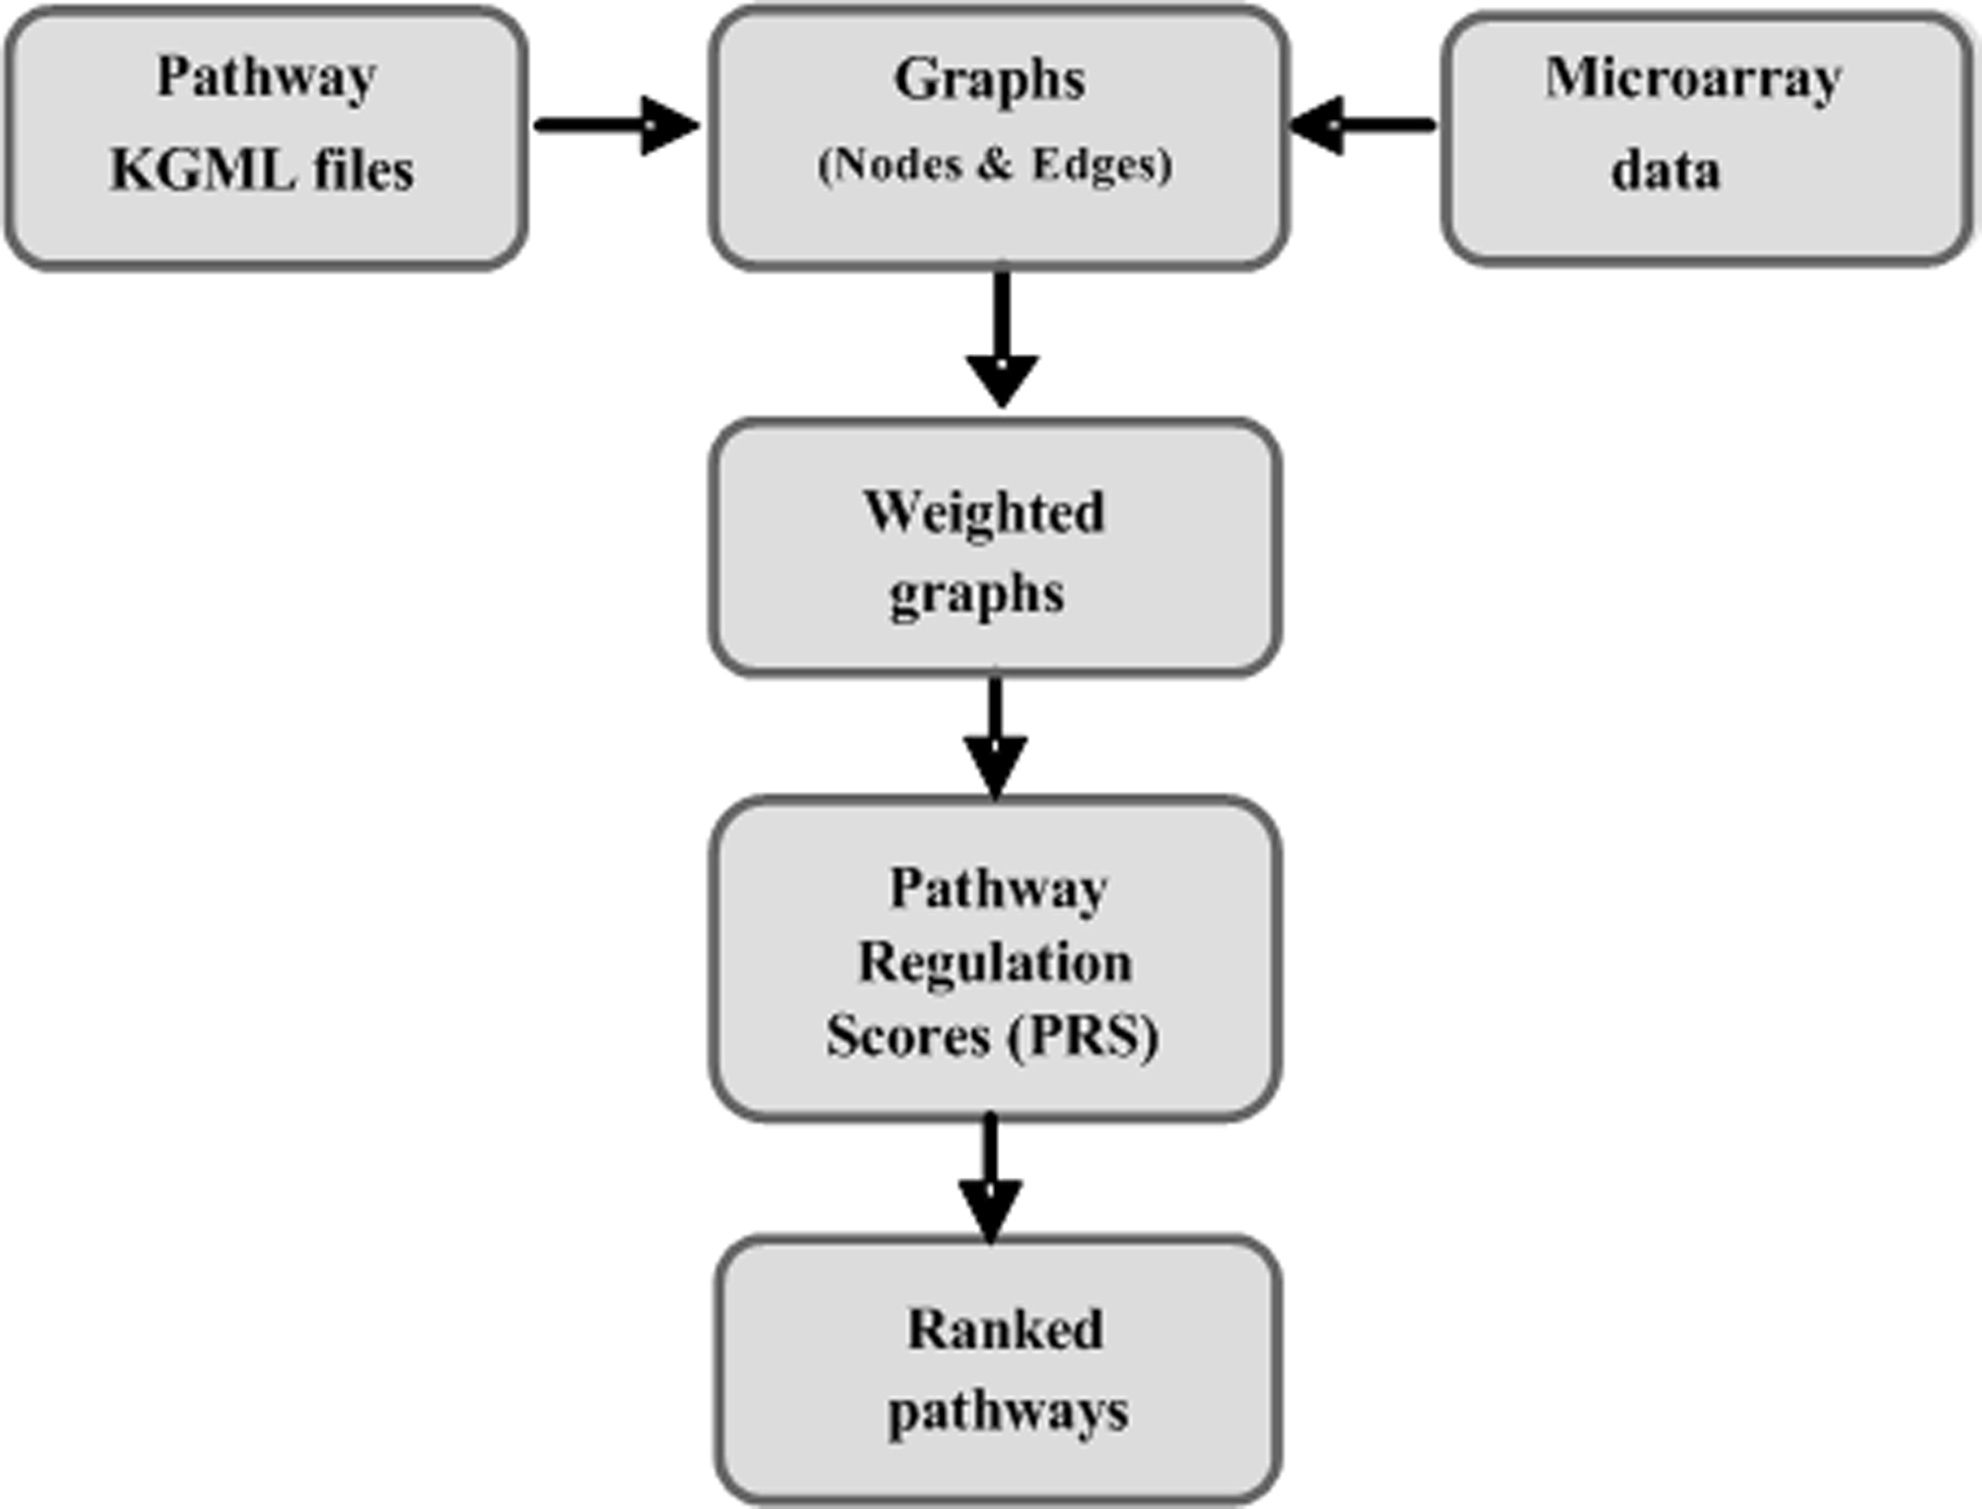
Flow-chart of the topology-based pathway regulation scoring method.
2.3. Removing redundancies from KEGG pathways
Redundancies in KEGG pathways may result in fold-change values for a node being mapped multiple times onto a pathway, leading to a distorted PRS calculation. We parsed KGML files to create a new structure in which redundant genes were combined into one entry, identified by a unique ID, while maintaining the original relationships between pathway elements.
2.4. Development of the PRS algorithm
The rationale is displayed in Figure 1. A special structure was created to represent pathways as networks, with each pathway defined by a unique identifier, definition name, and its constituent nodes. Each node in a pathway has three attributes:
i. Node_genes. Each node in a pathway represents a discrete function mapping to one or more transcript. ii. Node_value (NV). Each node is assigned a value derived from expression data. However, representing each node in a pathway by one value is problematic as there may exist a one-to-many relationship between nodes and encoding genes. Therefore, we assigned the following values to the node: 0 if the corresponding gene or genes are not expressed, 1 if they are expressed but remain unchanged (non-significant), or the maximum fold-change value if one or more of the mapped transcripts is above threshold. iii. Node_weight (NW). All significant (above-threshold) nodes were assigned a weighting that reflected their topological strength (i.e., the number of significant downstream nodes that are pointed to, either directly or via other significant nodes). We exploited graph theory to establish the number of significant downstream nodes using a depth-first search (DFS) algorithm (Tarjan, 1971). We created “trees” of associated nodes that were traversed using a DFS algorithm searching for a specific condition in “child” nodes (i.e., gene expression status). An initiating child node, ni, was ignored if non-significant, and the algorithm proceeds to the next child. Otherwise, we increase the weight counter by 1 and look for children of this node and so on. All non-significant nodes have NW = 0. NV and NW values are combined to calculate a Node_Score (NS) using the formula shown in (2). Figure 2 shows the NV, NW, and NS values for the significant nodes in an extract of a typical KEGG pathway (the pancreatic cancer pathway in this example).
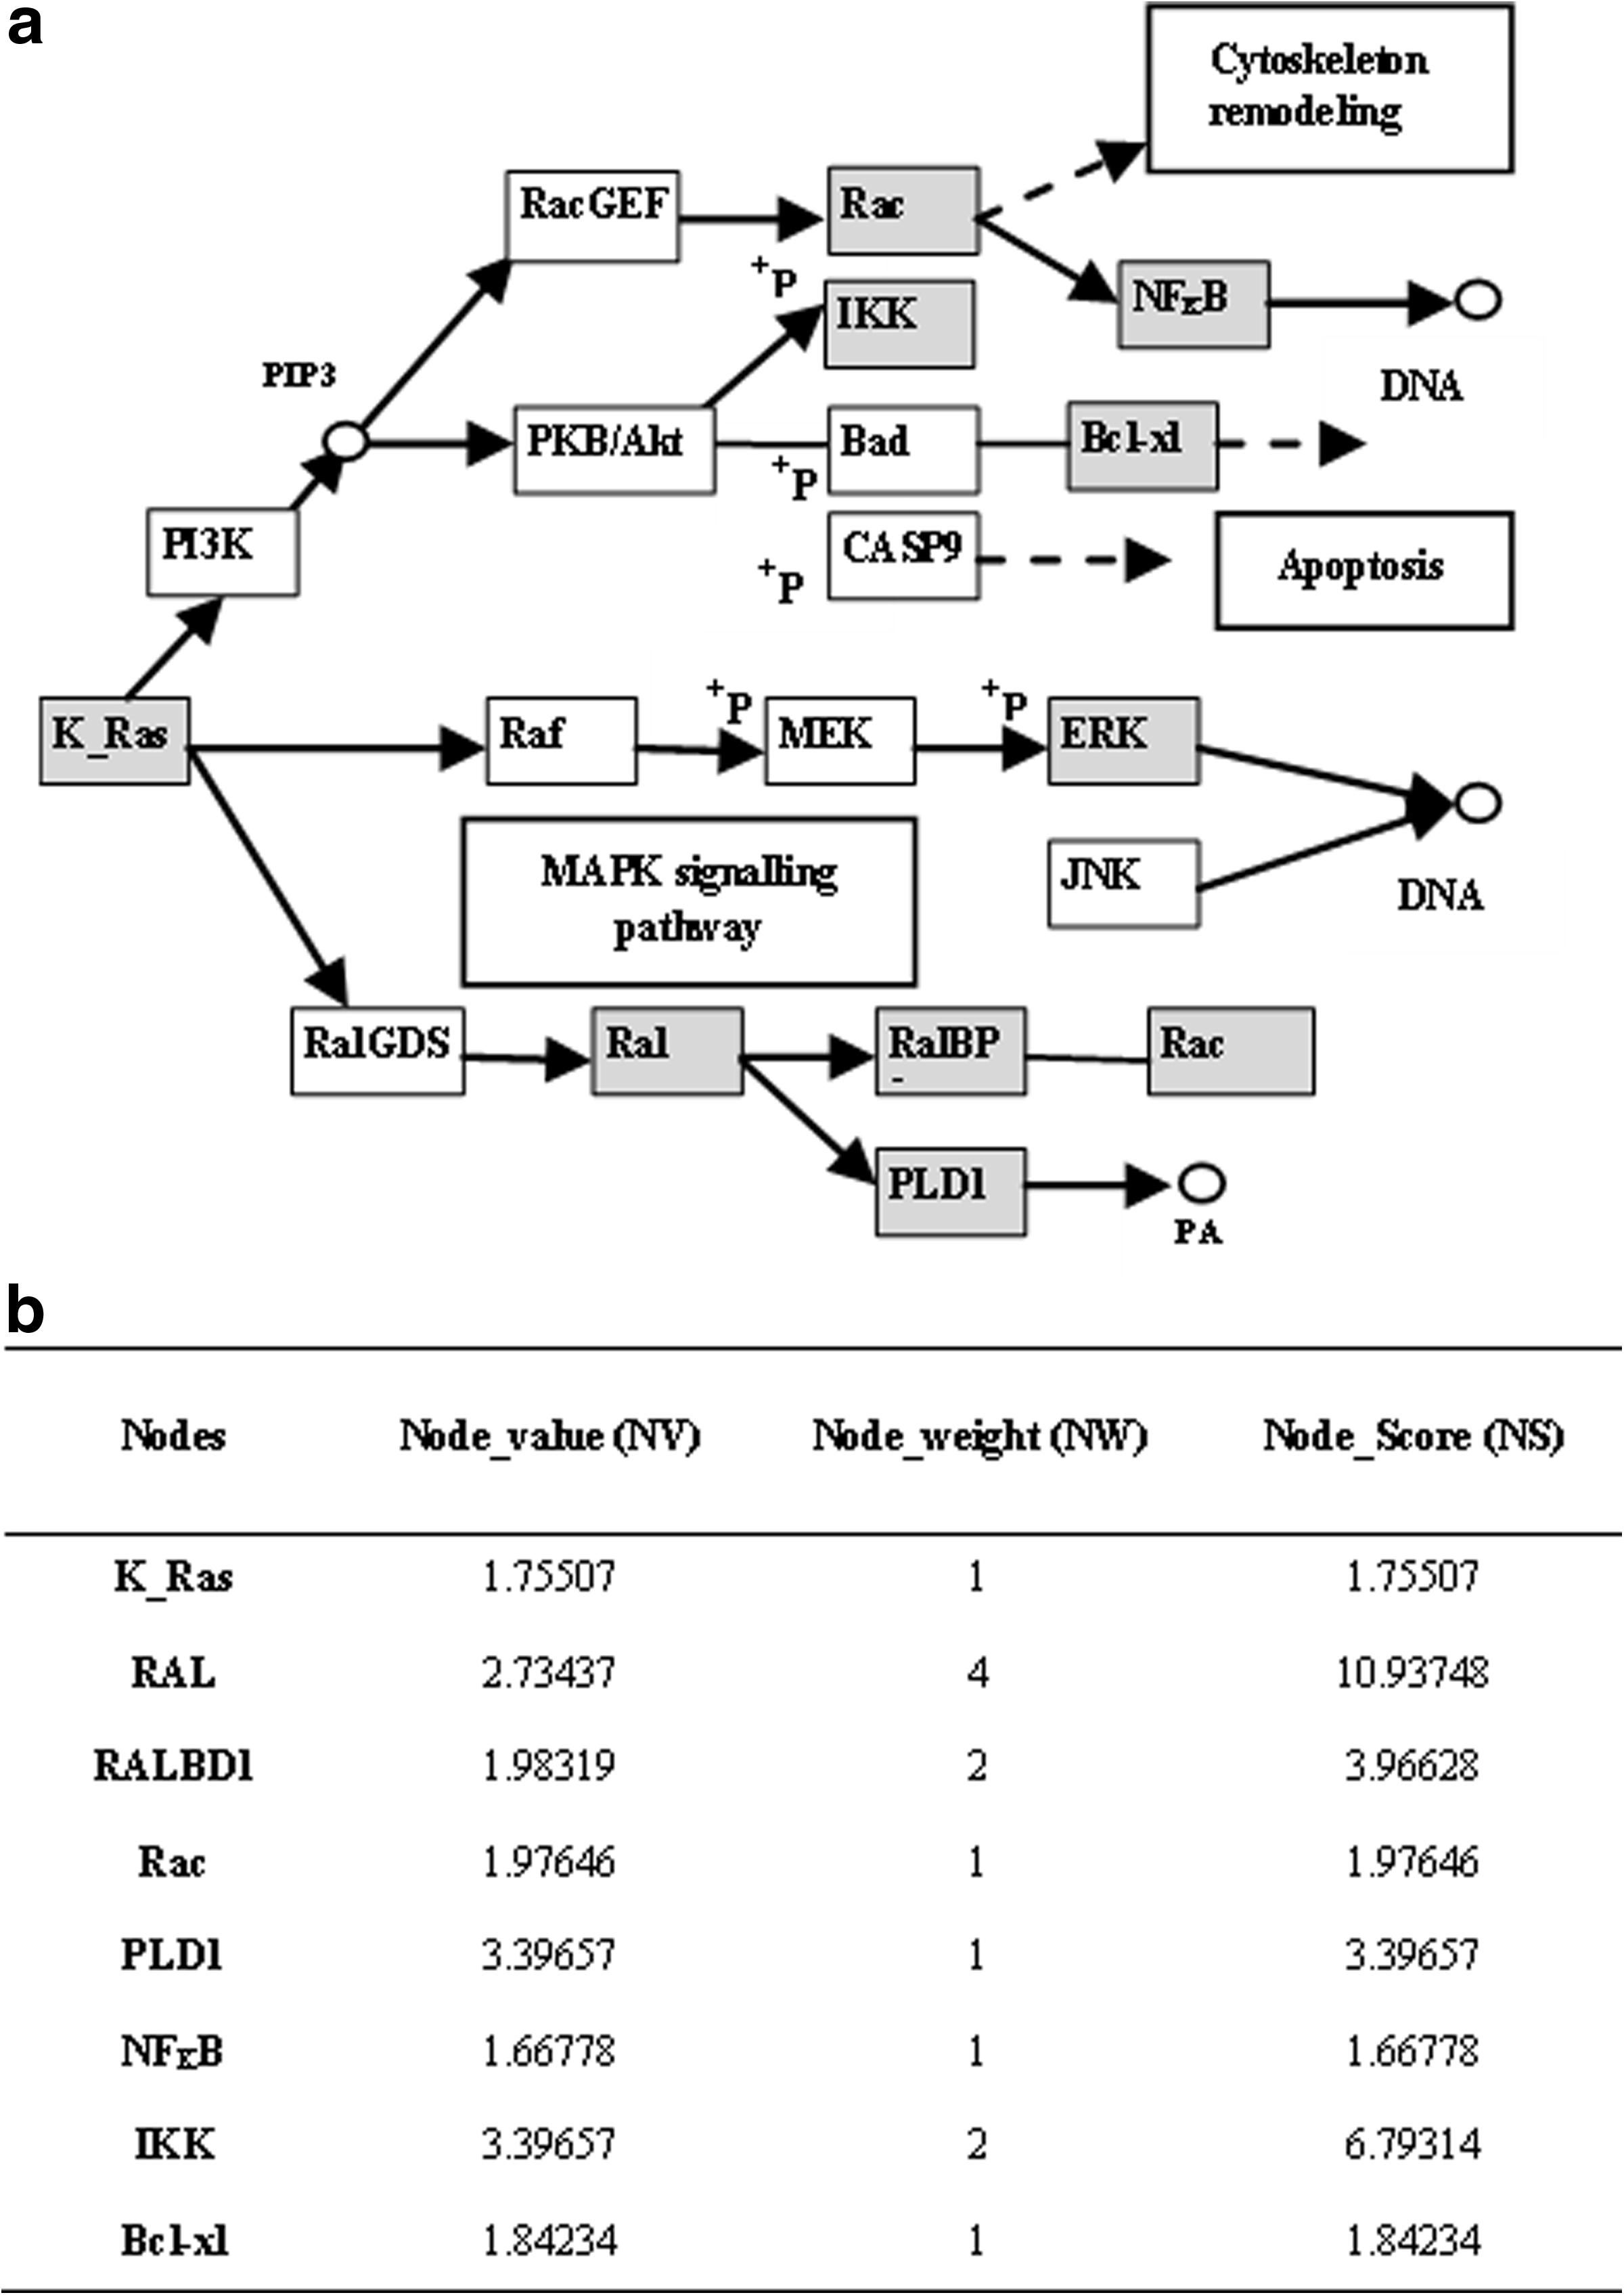
Generation of pathway regulation score (PRS) values.
For each pathway, the PRS was calculated using the following formula:
where ni is the number of nodes in pi, and NSj is the node score given by:
2.5. Normalizing pathway scores
Ranking pathways based on enrichment scores (rather than p-values) identifies the most biologically relevant biological processes. However, a normalization step is required to control for two key features: (i) pathway size and (ii) statistical bias contributed by pathway-specific PRS score null distributions.
i. The bias contributed by pathways size was mitigated by multiplying each PRS score by the ratio of the number of DEGs (NDEGs) in a pathway to the total number of expressed genes (NEGs) as shown in equation (3).
ii. To characterize the null distributions of raw PRS values obtained for each pathway, we used a non-parametric permutation method. Upon permuting fold-change values of all genes and creating n permuted scores (pPRS), different null distributions were observed for each pathway's score, thus we ran a standardization step (using the method of Tian et al., 2005) to make the raw PRS values of all pathways comparable. We standardized both raw (PRSi, 4) and permuted scores (pPRSij,5) for each pathway by subtracting the mean of the n permuted scores pPRSi from the raw score PRSi and from the permuted score pPRSij, then dividing by standard deviation of the permuted scores.
Finally, the normalized raw scores (nPRSi) were considered for pathway ranking.
2.6. Evaluating significance of the PRS
Significance was tested as follows: Fold-change values for the entire gene list were permuted and mapped back on to pathways and PRS values re-calculated using equation 3. This was repeated n = 1000 times to generate a null distribution of each raw score. Normalized scores (as calculated above) were compared and p-values calculated as follows:
where npPRS is the standardized value of the permuted scores, nPRS is the standardized value of the raw score, and I(X) is the identity function that returns 1 if X is true and 0 otherwise.
2.7. Multiple test adjustment
PFinal was adjusted by the FDR to control for type I error. The linear step-up procedure of Benjamin and Hochberg (Benjamini and Hochberg, 1995), was applied using the mafdr() function in Matlab 7.5.0.
3. Results and Discussion
One major obstacle in the development of improved functional enrichment methods is the lack of objective criteria to assess the quality of ranked output. Indeed, statistical approaches complement but cannot substitute for empirical analysis, and this rationale informed our approach. Our solution was to choose a series of datasets in which the molecular basis of pathogenesis was well established; thus, we had a strong, testable outcome. By comparing PRS with Z-scores, calculated according to Cheadle et al. (2003) for each dataset, we could test which method best matched previous observations.
3.1. Adipocyte responses to macrophage signaling
Pathways perturbed upon adipocyte exposure to macrophage CM were assessed by PRS (Table 1) and Z-scoring (Table 2). From a biological perspective, one would predict that cytokine-cytokine receptor interactions and peroxisome proliferator-activated receptor (PPAR) signaling pathways critical to adipocyte maturation (Schoonjans et al., 1996) would score highly under these conditions. Indeed, these pathways were identified by PRS and Z-scoring methods. Both approaches also give prominence to pathways in cancer, which is superficially confusing. However, further investigation showed that this pathway description effectively contains a superset of many high-scoring processes, notably cytokine and PPAR signaling. Critically, the original report (O'Hara et al., 2009) identified tissue remodeling as the most impacted process. However, there exists in KEGG no discrete remodelling pathway, although the bladder cancer pathway is populated by many genes involved in tissue remodeling, specifically matrix metalloproteases (Page-McCaw et al., 2007). Importantly, this pathway was not identified by Z-score, while it achieved the highest PRS score. It is also of note that PRS alone identified Jak-STAT signaling, which is pivotal in adipocyte maturation (Rawlings et al., 2004). Again, pathways related to infection (amoebiasis and malaria) were detected by both methods, as a consequence of the critical role of inflammatory cytokine signaling.
3.2. Acute myeloid leukemia
Tables 3 and 4 compare PRS and Z-score analysis respectively, and while both methods identify similar pathways, there exist several key differences. In particular, one would predict that processes related to MAPK signaling (Towatari et al., 1997), ras activation and autocrine cytokine stimulation would be highlighted (Steffen et al., 2005). KEGG groups these processes into an AML pathway, and this indeed achieves the top PRS score, but is relatively downgraded by Z-score. Moreover, other generic cancer pathways populated by genes implicated in AML pathogenesis feature in PRS but not Z-score lists. For example, the thyroid cancer pathway contains both MAPK and ras pathways. PRS analysis is also effective in downgrading non-relevant processes such as systemic lupus and antigen-processing identified by Z-score.
3.3. Colorectal cancer
Tables 5 and 6 show the top 10 pathways isolated from a colorectal dataset ranked by PRS and Z-scores, respectively. One would anticipate that critical pathways related to proliferation, cell adhesion, cytokine signaling and p53 inactivation would be highlighted by an effective method and, indeed, these processes are identified by both PRS and Z-score (Arnold et al., 2005). Overall, both algorithms perform well giving prominence to the cell cycle, p53 signaling and cell adhesion pathways. The Staphylococcus aureus infection pathway encapsulates a range of inflammatory cytokines known to be involved in colorectal cancer, thus its presence in both tables is unsurprising and serves to illustrate that some apparently non-relevant KEGG annotations may be informative upon deeper investigation. Interestingly, PRS analysis revealed a role for secretory pathways and evidence is emerging that ion transport is a key process in cancer pathogenesis, thus a potential target for innovative treatment strategies (Monteith et al., 2007). This process was not identified by Z-score. While both methods did rank complement and coagulation cascades, Z-scoring only highlighted non-relevant antigen processing and viral myocarditis processes.
3.4. Ovarian cancer epithelial cells
Bowen et al. (2009) sought to investigate ovarian cancer progenitors in a sophisticated experiment targeting surface epithelia in normal and cancerous tissue, a process poorly understood previously. By systematically exploiting informatics and biological methods, these authors identified the cell cycle, and TGFβ and wnt signaling as critical process. Tables 7 and 8 show PRS and Z-score analysis of the same dataset. Both pathways support the cell cycle prominence, but our method alone identifies TGFβ and wnt signaling. Thus, the informed use of gene expression data may rapidly guide the investigator to key biological insights.
4. Conclusion
While it is generally assumed that transcriptional changes will be reflected in protein function, we chose not to use higher-order relationship information (i.e., suppression or activation), as control is distributed across a biological process (this is particularly true for biochemical pathways). Microarray analysis tells us nothing about protein function; thus, caution must be exercised when extrapolating beyond experimental observation. Accordingly, we oriented our method around weighting downstream transcriptional consequences of changes at any gene (or node). In this way, we were able to gain critical biological insights more effectively than with the commonly-used Z-scoring method for pathway enrichment. Moreover, our method is robust across a range of real-world datasets. While the method described herein focuses on signaling pathways, its principles may easily be extended to other processes, such as biosynthetic pathways, without the need for complex pathway-specific caveats. Finally, by providing researchers with a choice of analysis tools informed by distinct rationales, evidence may be combined or contrasted to facilitate more informed decision making.
Footnotes
Acknowledgments
We wish to thank Professor Paul Trayhurn for his insights regarding the adipocyte dataset, and Drs. Valur Emilsson and Joanne Selway for critical reading of the manuscript. We are also grateful to Avijit Guha Roy for helpful suggestions. M.A.I. is supported by a Ph.D. studentship from the Syrian Ministry of Higher Education.
Disclosure Statement
No competing financial interests exist.