
Abstract
Abstract
In this article, we describe our work on graph mining as applied to the cellular signaling pathways in the Signal Transduction Knowledge Environment (STKE). We present new algorithms and a graphical tool that can help biologists discover relationships between pathways by looking at structural overlaps within the database. We address the problem of determining pathway relationships by using two data mining approaches: clustering and storytelling. In the first approach, our tool brings similar pathways to the same cluster, and in the second, our tool determines intermediate overlapping pathways that can lead biologists to new hypotheses and experiments regarding relationships between the pathways. We formulate the problem of discovering pathway relationships as a subgraph discovery problem and propose a new technique called Subgraph-Extension Generation (SEG), which outperforms the traditional Frequent Subgraph Discovery (FSG) approach by magnitudes. Our tool provides an interface to compare these two approaches with a variety of similarity measures and clustering techniques as well as in terms of computational performance measures such as runtime and memory consumption.
1. Introduction
A cellular signaling pathway consists of a set of molecules interacting with each other through signals that convey information, generally from the outside of the cell to the inside (Breslin et al., 2005). The STKE dataset describes signal transduction in biology, allowing a study of intra- and extracellular interactions through these chemical signals. Scientists all over the world have documented different cell signaling pathways. Still, there may be some undiscovered relationships among pathway components due to the lack of tools capable of mining and analyzing the existing relationships in the database.
The ultimate goal of our project is to build a tool that can discover relationships among pathways using graph mining approaches. The resultant pathway relationships could then help biologists analyze the biochemistry and discover new influences and patterns. In this work, we examine different algorithms for mining the frequent or common subgraphs among the signaling pathways. These frequent subgraphs are then used to calculate the similarities between every pair of pathways. We use the discovered subgraphs to cluster pathways and discover a “story,” or connection, between a pair of pathways. Clustering brings similar pathways together in one group, and a story connects two seemingly disjointed pathways. By “storytelling,” we are referring to the problem of connecting the dots between two pathways.
Figure 1 depicts a story that connects Ga13 pathway (CMP_8809 1 ) with Gai pathway (CMP_7430 2 ). To connect these two pathways, our storytelling algorithm discovered subgraph overlap between Ga13 and Gaq pathway first, and then between Gaq pathway and Gai pathway, therefore connecting Ga13 with Gai via Gaq pathway (CMP_6680 3 ). We have developed an interactive tool by which users can control the parameters for different phases of the mining pipeline. Additionally, we provide a runtime analysis for each of the algorithms implemented. Figure 2 shows a screenshot of the storytelling interface.

Two pathways, Ga13 pathway and Gai pathway, are connected via Gaq pathway. The figure shows how our storytelling framework connects two consecutive pathways based on subgraph overlap. Note that Ga13 and Gai pathways do not have significant overlap between them, but both of them have significant subgraph overlap with the intermediate Gaq pathway.
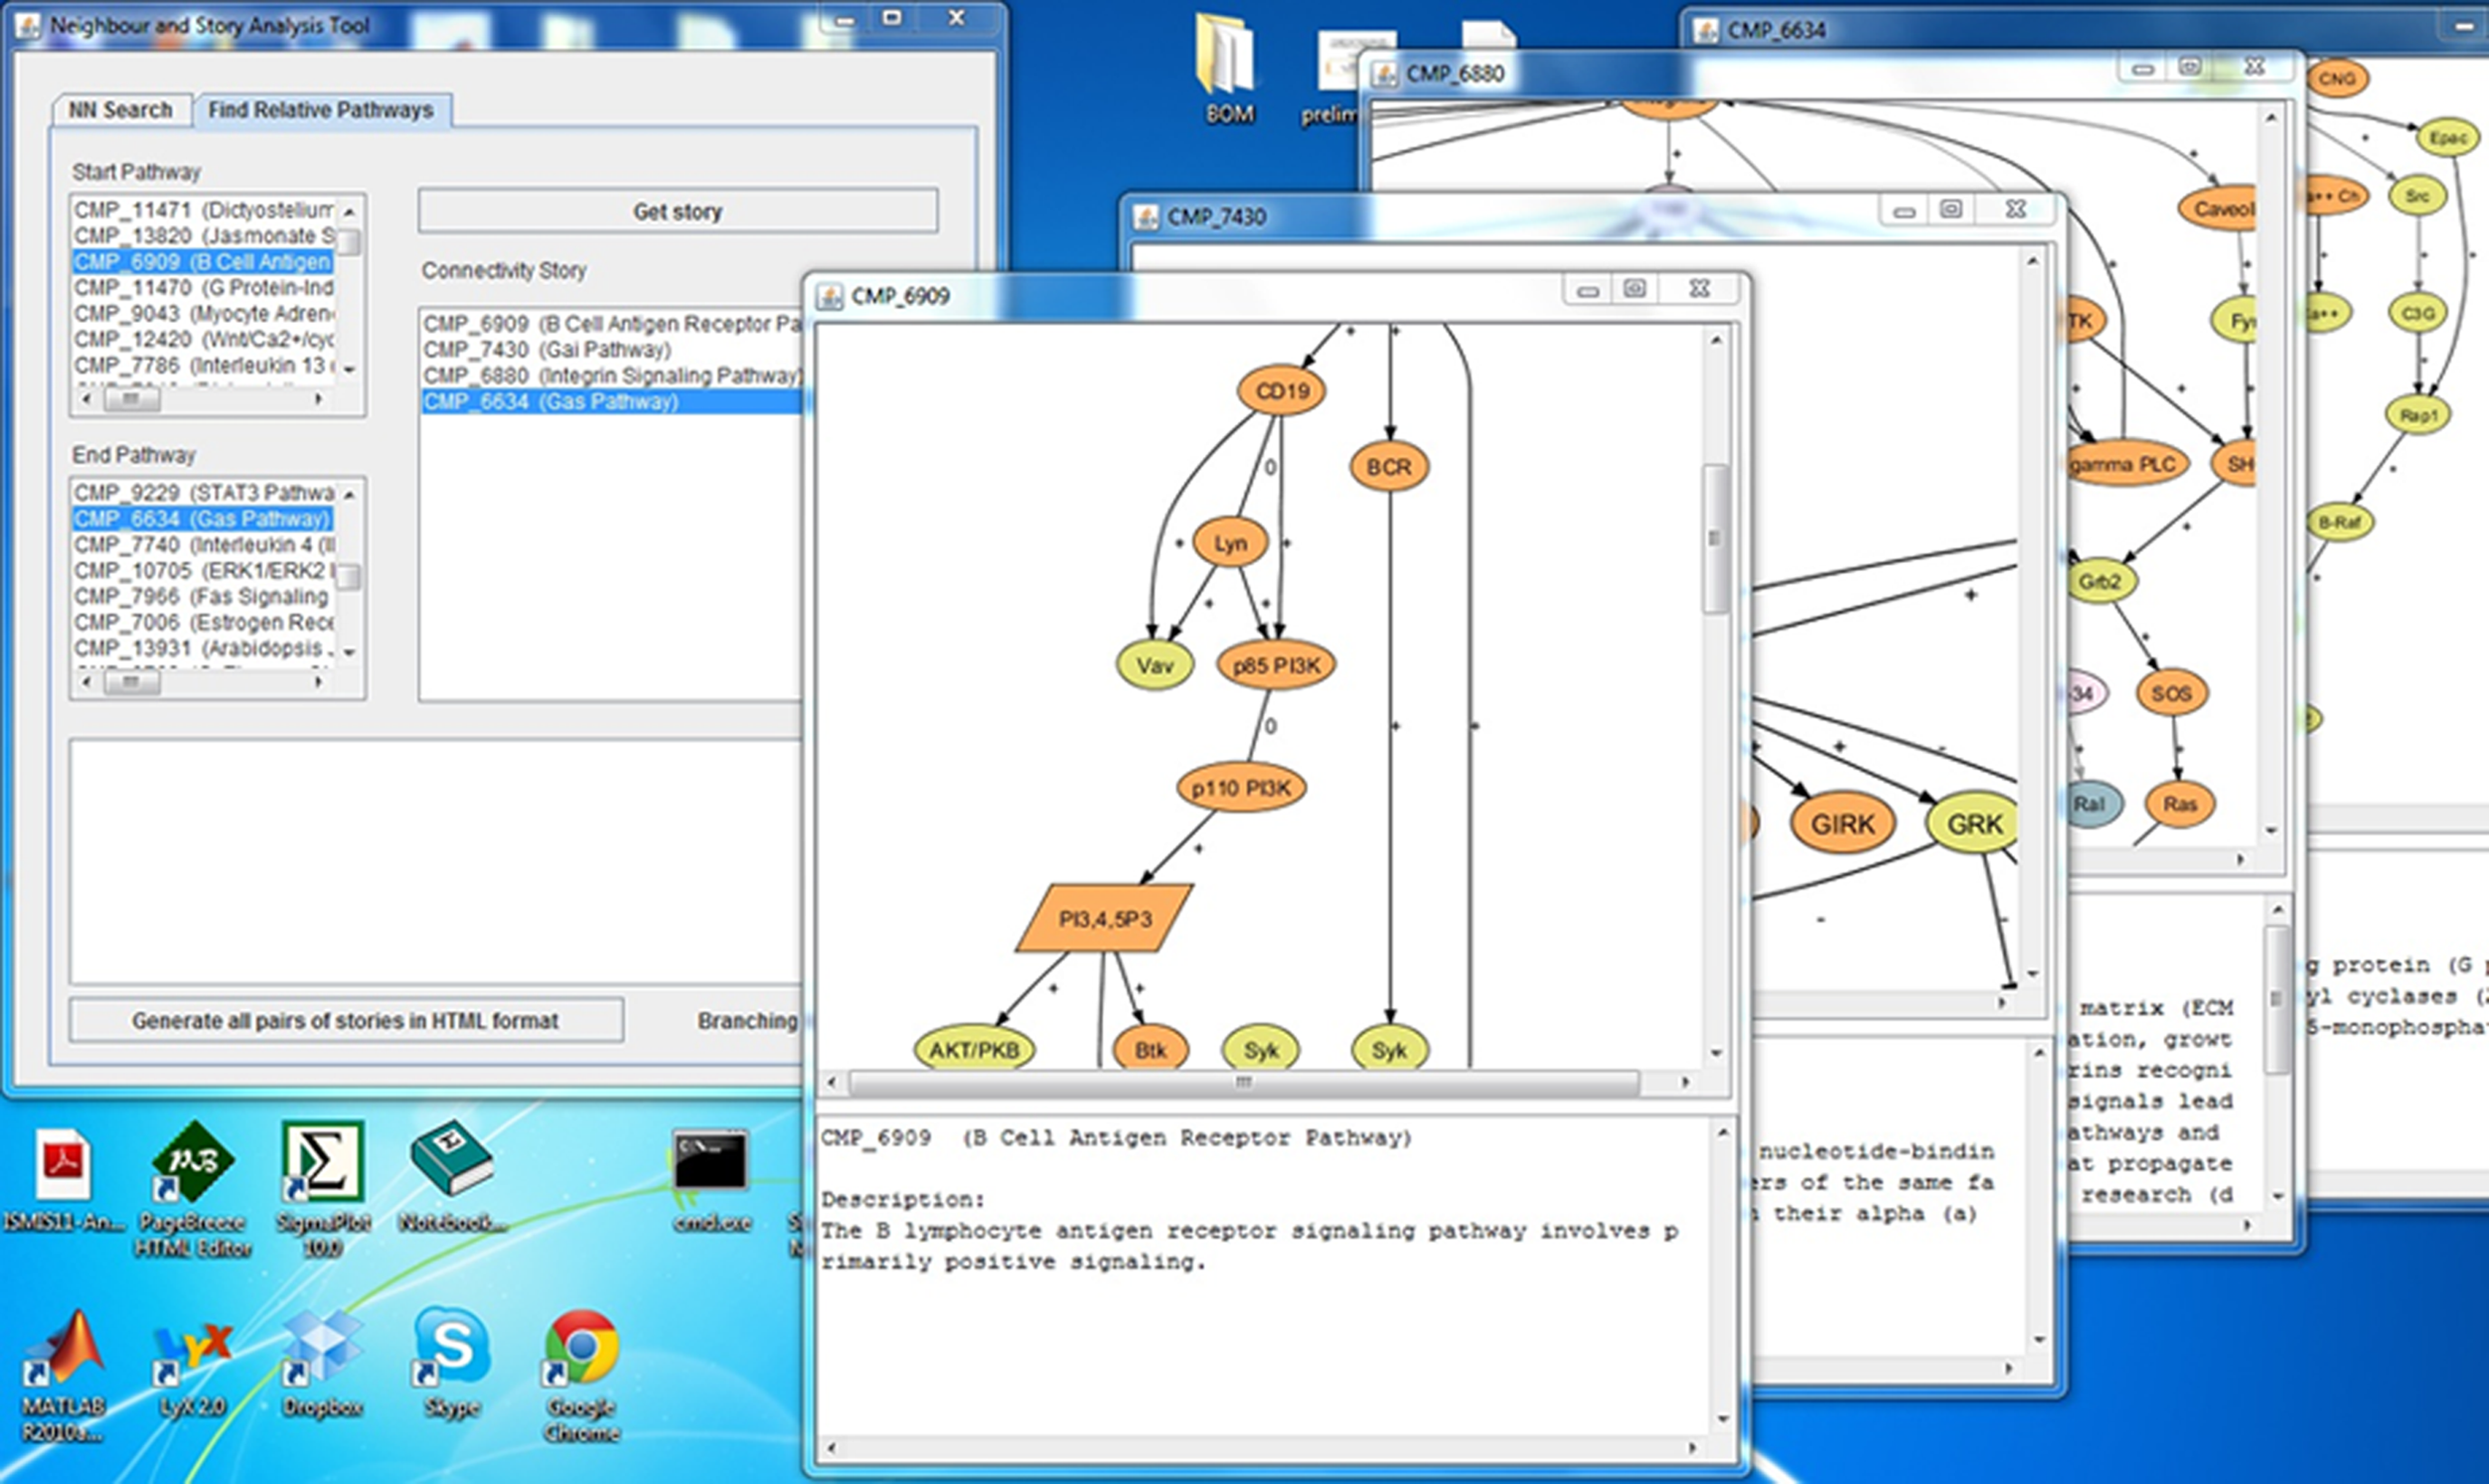
Screenshot of the storytelling interface. The interface allows the user to analyze the pathways of each story.
We also propose a graph-based storytelling approach that is similar to the text-based storytelling described by Kumar et al. (2008). Graph-based storytelling is more robust than text-based storytelling because texts are sometimes misleading and can generate meaningless stories. We insure that subsequent pathways in a generated story have overlapping signals between them—something that text-based storytelling algorithms do not guarantee. As a result, the chances that our algorithm generates misleading or meaningless stories are lower than with the text-based storytelling approach.
The rest of this article is organized as follows. Section 2 describes some of the related works and Section 3 the overall design. Illustrative experimental results are discussed in Section 4, and we conclude the article in Section 5.
2. Literature Review
Tools that help biologists visualize and analyze signaling pathways already exist. PathCase (Ratprasartporn et al., 2006), for example, provides a way to visualize signaling pathways as nested graphs and employs four abstraction levels to counter the visual complexity of signaling pathways. Xian and Yanbin (2007) design a model for the WNT signaling pathway, a gene regulation route of living cells of various organisms. Schreiber (2003) presents a different approach using a constraint graph drawing algorithm for visually comparing metabolic pathways of different species. In this system, similar parts of the similar pathways of different species are placed side by side, thereby making it easier to identify similarities and dissimilarities between the pathways. However, none of these tools provide any automatic mechanism to discover frequent subgraphs in the pathways through graph-similarity–based discovery of pathway relations. We show how the discovery of relations among pathways using clustering and storytelling algorithms can be assessed, attenuated, and even automated.
Scientists have done research related to clustering pathways in the past. For example, ASK-GraphView (Abello et al., 2006) is a large scale graph visualization tool that is used for navigating large graphs. It provides a way to cluster the graphs using structural clustering for visualizing the graphs in a more compact form. In contrast, we aim to find clusters automatically using the discovered knowledge of patterns of frequent structures in the pathways. Miyake et al. (2003) present a comparison technique based on clustering between pathways. They introduce a scoring system to measure the similarity between pathways. The method extracts correlation between metabolic pathways and gene locations where the similarity between a pair of pathways is defined by the overlap of linear sequences of non-branching pathways. In contrast, our method depends on structural resemblance among pathways without limiting its scope to only linear sequences.
The task of creating a link between two objects has been studied in various guises: disjoint but complementary (CBD) architecture (Swanson, 1991), stepping stone (Das-Neves et al., 2005), redescription mining (Zaki and Ramakrishnan, 2005), storytelling (Kumar et al., 2008), connecting the dots (Hossain et al., 2012; Shahaf and Guestrin, 2010), and others. All of these works are used to connect unstructured text documents, and none of them focus on connecting graph-based objects like pathways. However, there are some works in the domain of graph theory that explicitly concentrate on finding a suitable path between two nodes within the same network. For example, Brassard and Gecsei (1980) made the attempt to solve a “connecting the dots” problem for cellular partitioning networks. They proposed a method of path building to efficiently find couplings in electrical networks. Given start and end terminals, the proposed algorithm finds a path in the network that has the least probability of path failure.
Faloutsos et al. (2004) capture the relationship between two nodes of a large graph based on the electricity flow from the given start and end vertices. Although the works of Brassard and Gecsei (1980) and Faloutsos et al. (2004) use aspects of graph theory to find connections between nodes in the same network, to the best of our knowledge this is the first time such an algorithmic framework is used to find connections between multiple graph objects. Additionally, we have made the first attempt to find connections between pairs of cell signaling pathways in the STKE dataset based on their graph structure.
Our approach depends on graphs for modeling the STKE dataset and takes advantage of graph-based data mining techniques. There are some well-known subgraph discovery techniques like Frequent Subgraph Discovery (FSG) (Michihiro and George, 2004), graph-based Substructure pattern mining (gSpan) (Yan and Han, 2002), Diagonally Subgraph Pattern Mining (DSPM) (Cohen and Gudes, 2004), and Subdue (Ketkar et al., 2005). Most of these systems have been tested on real and artificial datasets of chemical compounds. In our work, we discuss a system that can perform frequent subgraph discovery on large pathway-graphs. We propose a novel Subgraph-Extension Generation (SEG) mechanism that significantly outperforms the original FSG approach.
To the best of our knowledge, we introduce the first automated graph-based technique to find relationships between pathways. We also propose the use of Master Pathway Graph (MPG), which helps our Subgraph-Extension Generation (SEG) mechanism to discover subgraphs in an efficient manner. We offer a fully automated system that uses enhanced subgraph discovery techniques and provides interactive feedback as to their effectiveness and performance.
3. Design
In this section, we provide an overview of our proposed system. Figure 3 shows the design pipeline. It contains five major modules: (1) Preprocessor, (2) Frequent Subgraph Discovery Module, (3) Clustering Module, (4) Nearest Neighbors (NN) Module, and (5) Storytelling Module.
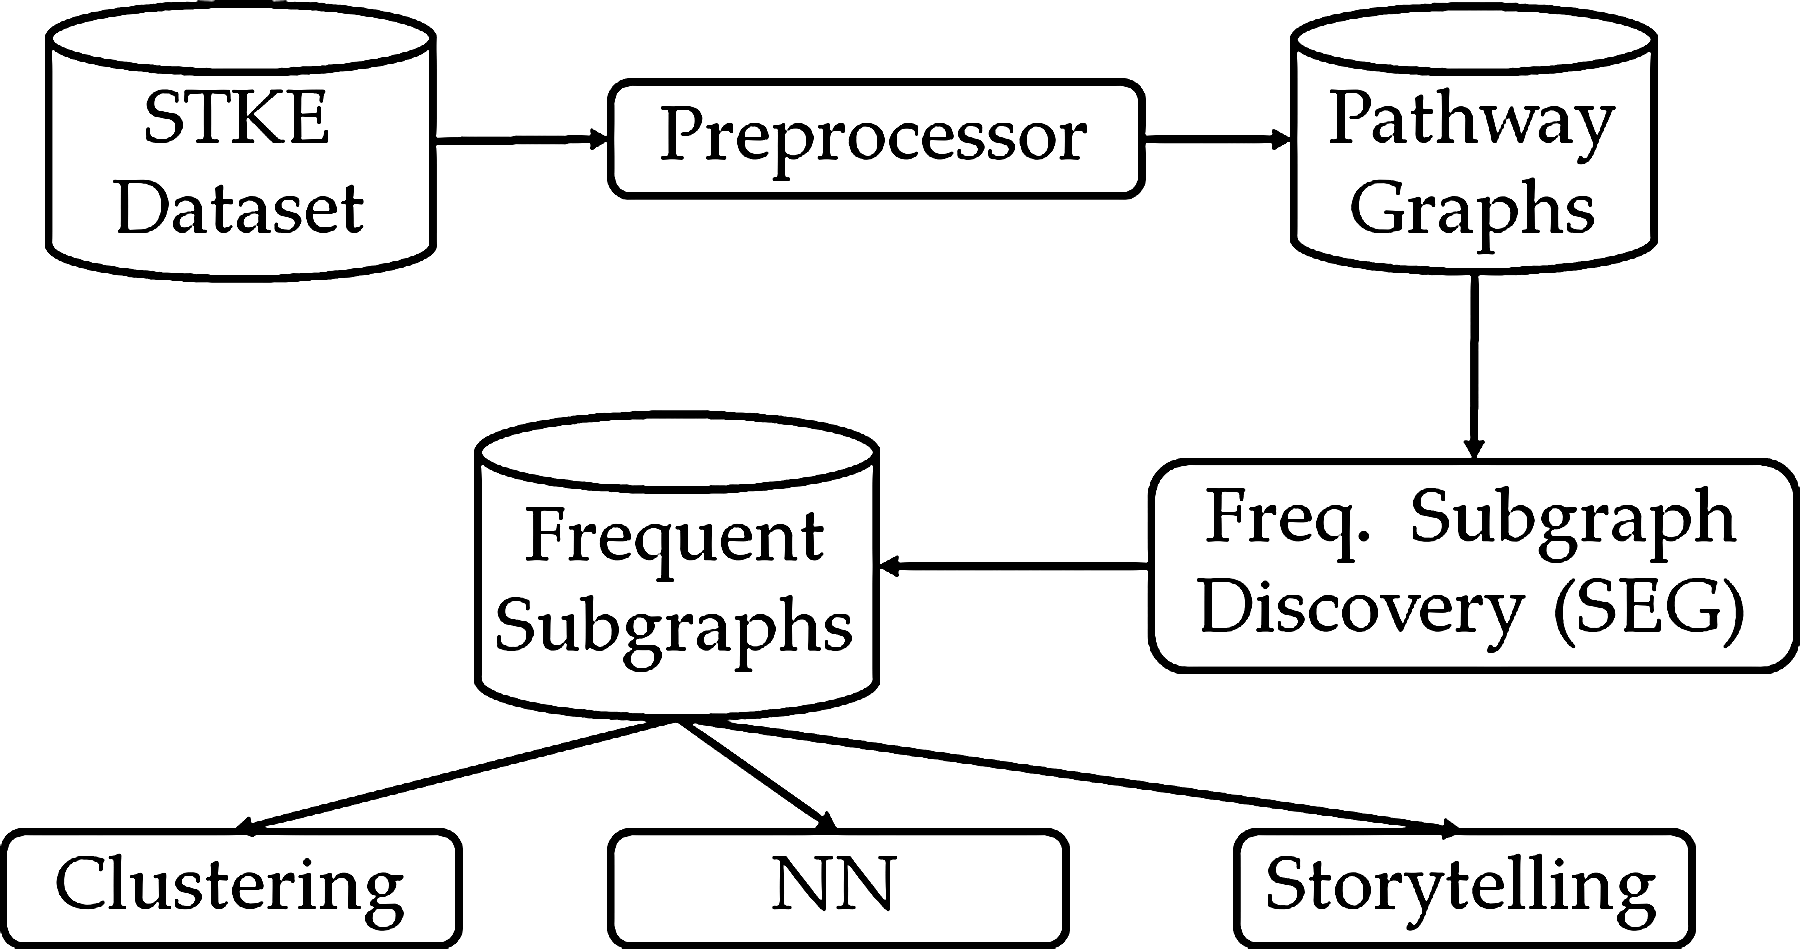
Design pipeline. This figure outlines the network mining framework we use in the developed tools. NN,
(1) Preprocessor: This module takes input directly from the STKE dataset and converts each pathway to a graph object. The aim of this module is to provide an efficient data structure to store the pathways effectively for the subgraph discovery process. Additionally, it generates the Master Pathway Graph (Definition 1), which assists the Subgraph-Extension Generator (SEG) used by the frequent subgraph discovery module.
Definition 1
A Master Pathway Graph (MPG) is a graph that contains all the relations (edges) of all the pathways but contains them only once. For example, let P1, P2, P3, and P4 be the pathways in the dataset. If their corresponding edge-sets are defined by P1(e1, e2, e5, e6, e7), P2(e3, e4, e5, e8), P3(e4, e5, e6, e7), and P4(e3, e4, e5, e6, e8), then the edge-set of their MPG would be MPG(e1, e2, e3, e4, e5, e6, e7, e8).
(2) Frequent Subgraph Discovery Module: This module uses our SEG approach to discover frequent subgraphs from the pathways. The developed tool also provides the traditional FSG approach for comparison. The details of the FSG and the SEG approaches are described in Section 3.1.1.
(3) Clustering Module: The clustering module generates clusters of pathways and provides comparisons between two popular clustering techniques: Hierarchical Agglomerative Clustering (HAC) (Zhang et al., 1996) and k-means (Macqueen, 1967). It also provides an evaluation of the generated clusters with a graphical interface using Average Silhouette Coefficient (ASC) (Lin and Hsueh, 2006) at different numbers of clusters.
(4) NN Module: Given an input pathway P and an integer n (where n < N and N = total number of pathways), the NN module provides n number of most similar pathways in their descending order of similarity values calculated with respect to pathway P. We use cover tree (Beygelzimer et al., 2006), an indexing mechanism for efficient nearest neighbor search.
(5) Storytelling Module: Given two pathways, the storytelling module finds a story (Definition 2) between these two pathways. Users can visually investigate the graph-structures of the intermediate pathways of a story using our tool. We generate stories between all possible pairs of pathways, some of which might reveal insights for biologists into developing a new pathway. Consider the scenario in which a biologist wants to uncover the relationship between a gene and a phenotype. The pathways related to this gene and the phenotypes are not enough to establish a logical relationship. Given two pathways (and the database of all known pathways), our tool can provide a set of possible relationships in the form of a story, with visual representations that would help the biologist analyze and discover new relationships.
Definition 2
A story from pathway P1 to pathway Pz is a sequence of some intermediate pathways P2, P3, … , Pz-1 such that similarity sim(Pi, Pj) > 0, 1 ≤ I < z, and j = I + 1. In this work, we denote the length of a story by z, i.e., the number of pathways involved in the story. A story of length 2 does not have any intermediaries.
3.1. Implementation details
In the following subsections, we describe all the algorithms we have used to develop the tool.
3.1.1. Apriori paradigm
One of the baseline approaches to mining subgraphs from the pathways database is the Apriori paradigm (Agrawal and Srikant, 1994), which was originally developed to solve the association rule mining problem of market basket datasets (Agrawal et al., 1996). The aim of the original Apriori algorithm is to find frequent itemsets from a list of transactions. The algorithm concentrates on the corresponding supports of the items and itemsets. In our work, we replace transactions with pathways, items with edges, and itemsets with subgraphs (i.e., sets of connected edges). The association rule mining problem of market basket data analysis has an analog in our research area as the problem of frequent subgraph discovery. In this subsection, we illustrate the internal mechanism of our Apriori paradigm and propose an enhancement to generate candidate subgraphs efficiently.
Table 1 portrays the modified high-level algorithm for frequent subgraph discovery using the Apriori paradigm. The apriori_gen procedure in the algorithm joins and prunes the subgraphs. In the join operation, a k-edge candidate subgraph is generated by combining two (k−1)-edge subgraphs of Lk-1. This k-edge subgraph becomes a member of Lk only if it passes the min_sup threshold. We use the FSG (Michihiro and George, 2004) approach to join two subgraphs to obtain a higher order subgraph. We also propose a novel mechanism called Subgraph-Extension Generation (SEG) in this section, which is more efficient than the FSG approach.
The importance factor sfipf (subgraph frequency × inverse pathway frequency) of a subgraph si of pathway j is defined as follows:
An edge of a pathway of the STKE dataset is directed (upstream/downstream) and contains one of the four signaling activities: stimulatory (+), inhibitory (−), undefined effect (?), or neutral (0). The directions and edge attributes are strictly considered during the comparison between two subgraphs in our implementation. For example, consider that there is a stimulatory relation between two vertices v1 and v2 in a subgraph X. Consider we have another subgraph Y that looks the same as X, but the edge between v1 and v2 of Y is inhibitory. Our implementation considers that these two subgraphs are not the same, differing in one edge. Therefore, the implementation takes the edge attributes into consideration as well as the direction of the edges.
FSG
In the FSG approach, we generate a (k + 1)-edge candidate subgraph by combining two k-edge subgraphs where the two k-edge subgraphs have a common core subgraph (Michihiro and George, 2004) of (k−1)-edges. This approach requires time-consuming comparisons between core subgraphs while generating the larger subgraphs. Although this approach is very fast for small graphs, it becomes inefficient for large graphs due to large numbers of blind attempts to combine k-edge subgraphs to generate (k + 1)-edge subgraphs.
Consider an Apriori's iteration in which we have a total of 21 5-edge subgraphs in the candidate list L5. We try to generate 6-edge subgraphs from this list. Consider the situation of generating candidates using one 5-edge subgraph (e.g., the subgraph lmnop of Fig. 4) of L5. The original FSG approach tries to combine the remaining 20 other subgraphs with lmnop but succeeds, let us assume, only in three cases. Figure 4 illustrates that lmnop is successfully combined with only mnopq, mnopr, and mnops. The other 17 attempts to generate a 6-edge subgraph with lmnop fail because the 4-edge core-subgraphs analyzed in this case do not match. Figure 4 shows the attempts to generate good candidates for just one subgraph (lmnop). For all the subgraphs in L5, there would be a total of 21 × 20 blind attempts to generate 6-edge subgraphs. Some of these attempts would succeed, but most would fail to generate acceptable 6-edge candidates. This algorithm cannot avoid comparing a large number of core subgraphs to generate all candidates. We have reduced the number of comparisons by a significant degree with our Subgraph-Extension Generation approach. The technique is described in the following subsection.
Frequent Subgraph Discovery (FSG) approach. Attempts to combine lmnop with other 5-edge subgraphs of (L5).
Subgraph-Extension Generation (SEG)
Rather than trying a brute-force strategy of comparing all possible combinations (e.g., FSG), we use the master pathway graph (MPG) as the source of background knowledge to entirely eliminate the unsuccessful attempts at generating (k + 1)-edge candidate subgraphs from k-edge subgraphs. We maintain a neighboring-edges list for each k-edge subgraph and generate candidates for frequent higher order subgraphs by taking edges only from this list.
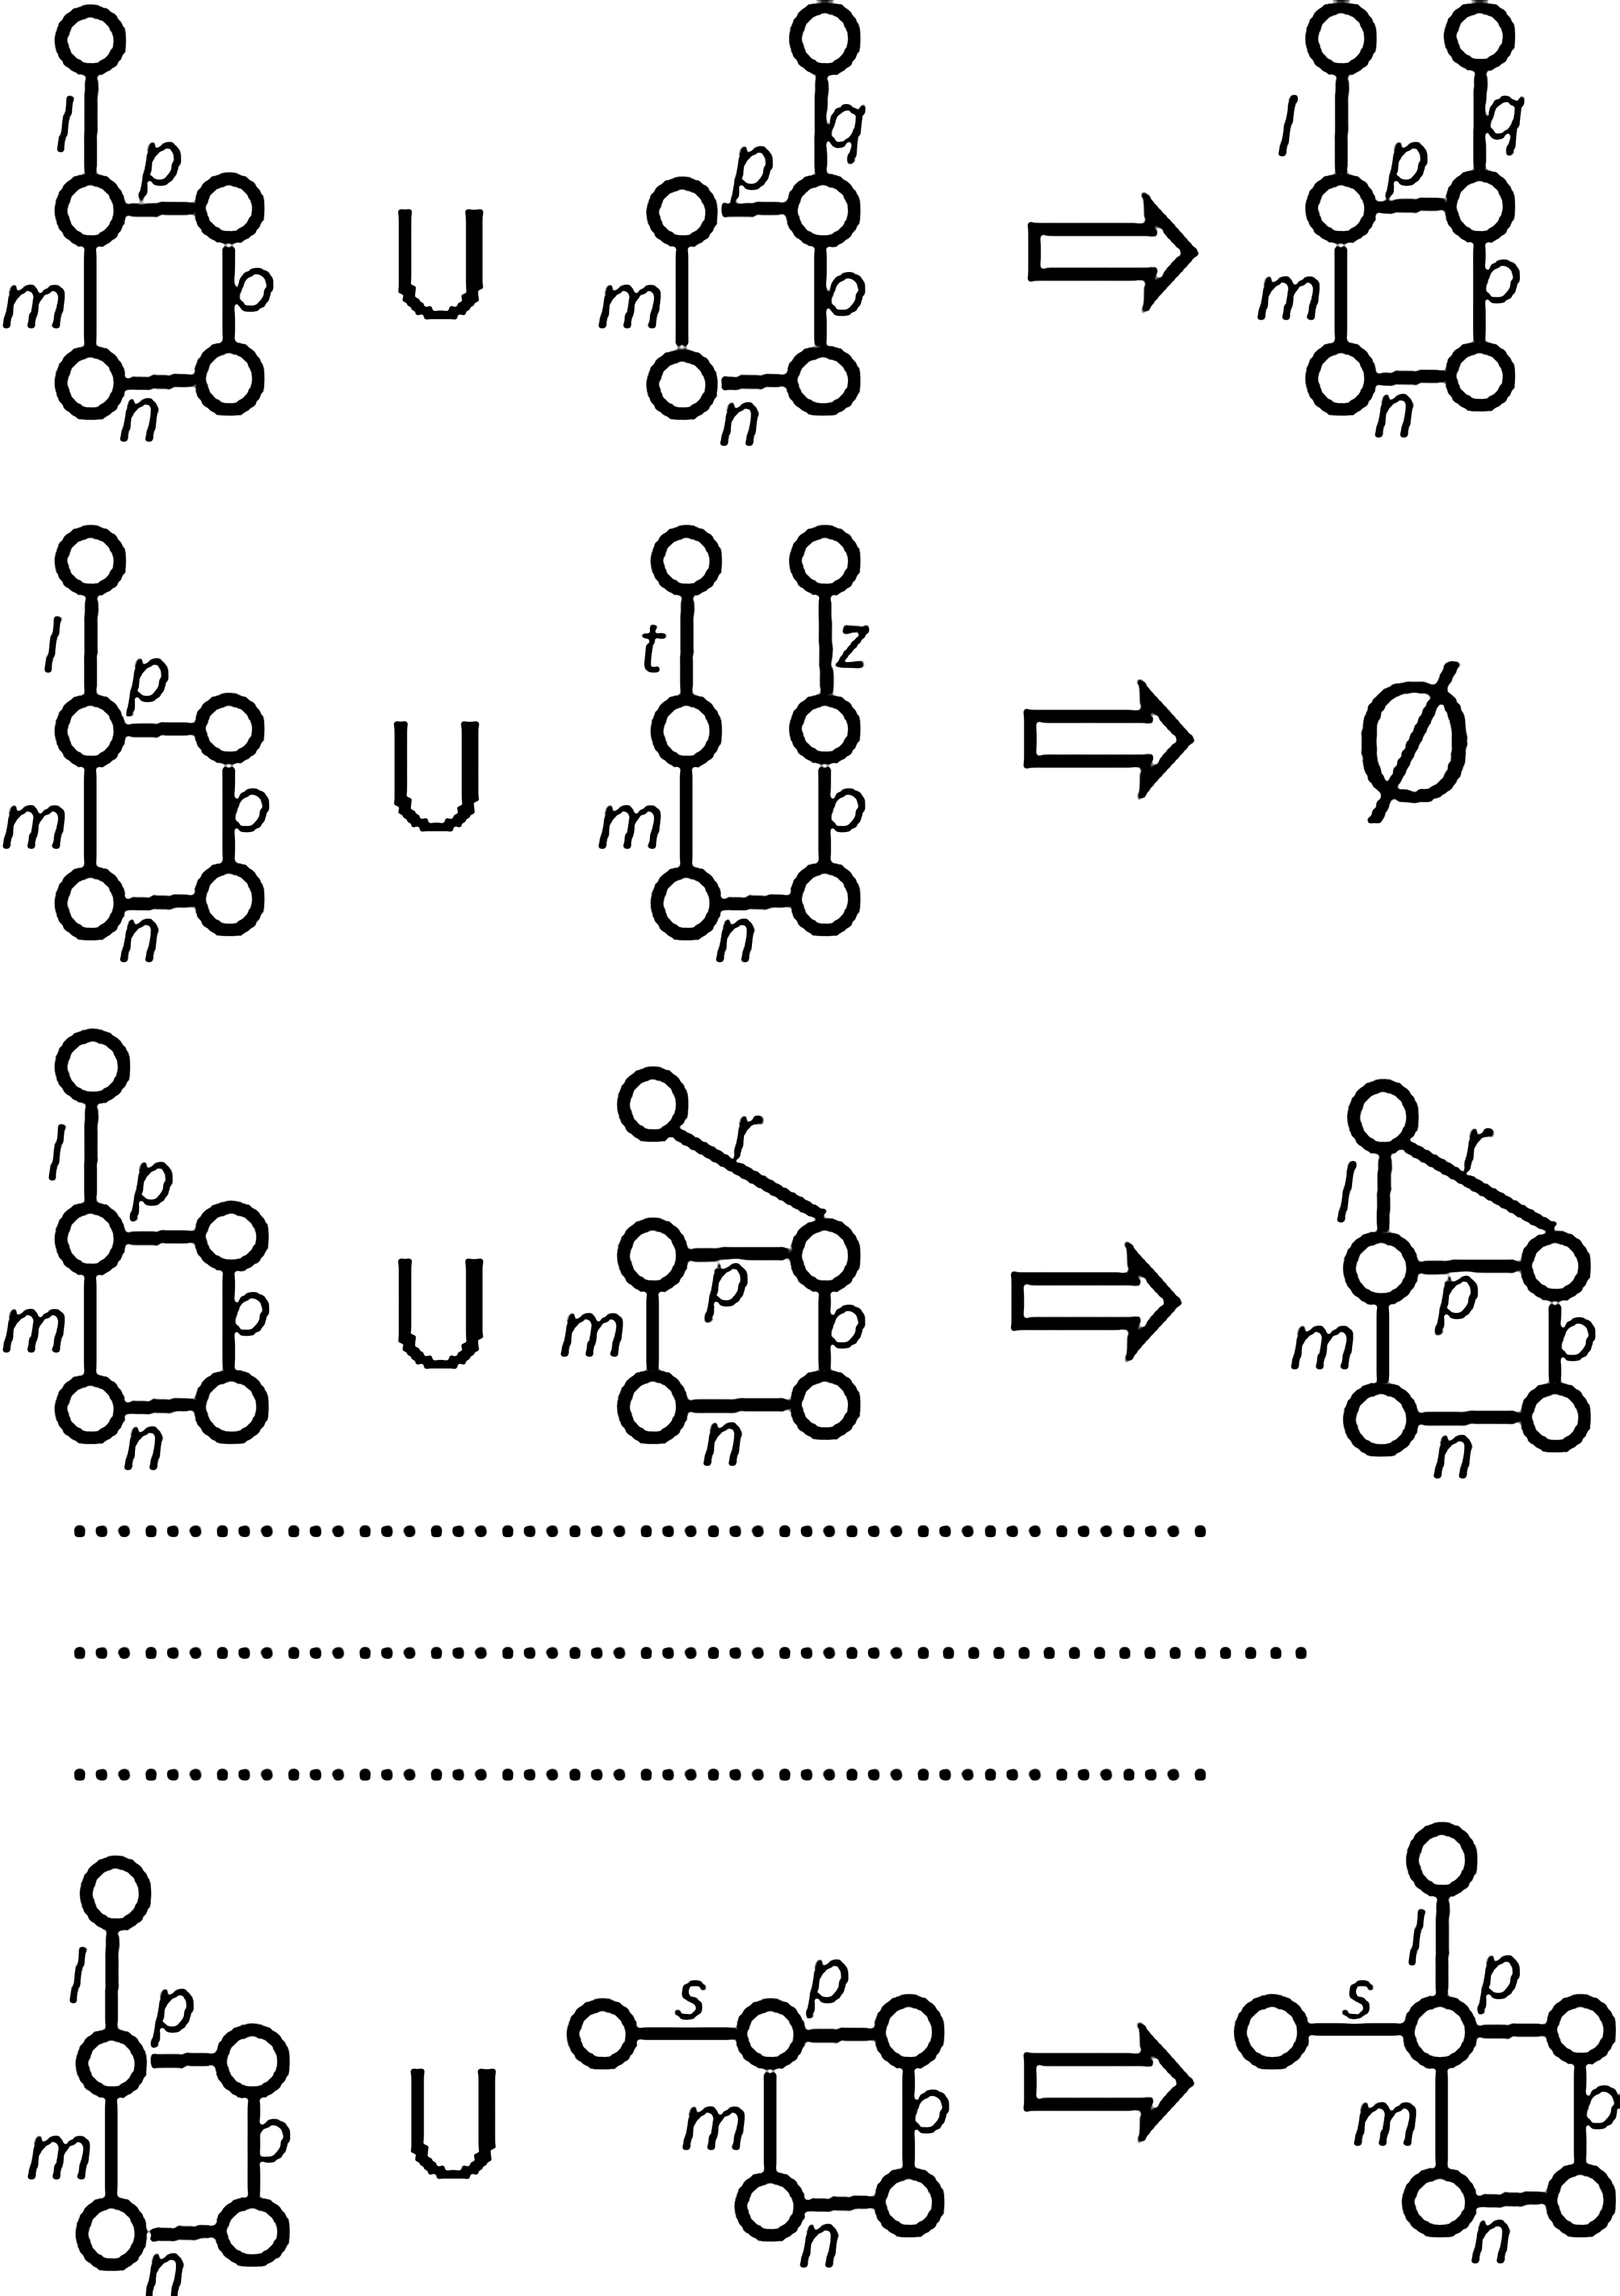
Figure 5 shows the Subgraph-Extension Generation mechanism for subgraph lmnop, which can be compared with the FSG approach of Figure 4. The gray edges of Figure 5 are the edges of the 5-edge subgraph, which we want to extend to generate 6-edge candidates. The black lines indicate the neighboring edges, which extend the 5-edge gray subgraph maintained in our MPG. The same instance is used for both Figure 4 and Figure 5 for easy comparison. The neighboring-edges list of lmnop contains edges {q, r, s}. Unlike Figure 4, the example presented in Figure 5 uses the Subgraph-Extension Generation technique and does not try to blindly generate higher order subgraphs 20 times. Rather, it proceeds only three times, using the constraints coming from knowledge about the neighboring edges of lmnop in the MPG. It results in only three attempts to generate higher-order candidate subgraphs. None of these attempts fail at step 3 of the Apriori algorithm (Table 1) because the mechanism depends on the physical evidence of possible extension. Therefore, SEG offers a novel knowledge-based mechanism that eliminates unnecessary attempts to combine subgraphs. All the generated subgraphs that pass the min_sup threshold are stored in a subgraph-pathway matrix, which is used in the clustering or storytelling phase later.

6-edge Subgraph-Extension Generation (SEG) for the 5-edge subgraph lmnop. It shows the SEG mechanism for subgraph lmnop, which can be compared with the FSG approach of Figure 4.
3.1.2. Pathway clustering and cluster's evaluation
We use commonly recognized methods to group pathways: HAC and k-means clustering. The tool provides evaluation in a broad range of generated clusters. Our tool also provides a selection of different types of similarity measures for the resulting clusters: Cosine, sfipf weighted Cosine, Jaccard, Dice, Overlap, and Matching coefficients.
To evaluate the clustering results, we used an unsupervised measure of cluster validity called Average Silhouette Coefficient (ASC) (Lin and Hsueh, 2006). An overall measure of “goodness” of a clustering can be obtained by computing the average silhouette coefficient of all data points (Tan et al., 2006).
3.1.3. Storytelling and story evaluation
We used bidirectional search to find a story between two pathways P1 and Pz. In a bidirectional search algorithm, two simultaneous searches proceed in two directions: one forward from the start pathway (P1) and one backward from the goal (Pz). The search stops when the two searches meet in the middle. A path from P1 to Pz forms a story. Figure 6 portrays a sketch of the bidirectional search used in our tool. The search proceeds from one pathway Pi to its n most nearest pathways. The length of a story and the search time depend on the branching factor n. We use bidirectional search for every pair of pathways to generate all possible stories.

Bidirectional search for storytelling.
We evaluate the quality of a generated story in terms of the overlap of biological entities in the text descriptions of each pathway in the story. This is an investigation to examine the text cohesion of the stories generated by our graph-based storytelling algorithm. To find useful biological entities, we used the Named Entity Recognition method—a technique generally used to identify certain types of terms (e.g., name of person, location, biomedical terms, etc.) in a corpus. We use LingPipe named entity recognizer (Carpenter, 2004) to detect the biological entities (e.g., genes, proteins, chemicals, etc.) appearing in the text descriptions of the pathways. Named entity recognition of LingPipe involves supervised training of a statistical model that learns from a set of labeled (usually hand-coded) data. To identify the named entities in the descriptions of the pathways of the STKE dataset, we use an existing trained model generated from GENIA corpus (Kim et al., 2003), which is available with the LingPipe package. The identified, named entities for each of the pathways help us to evaluate the graph-based stories. We assign a score, called Cohesion Coefficient, to each of the stories, which gives us an overall understanding of the overlap of biological entities between the text descriptions of every consecutive pair of pathways throughout the entire story. We define Cohesion Coefficient h(s) of a story s by the following formula:
where |s| = (Number of pathways in story s − 1) and
The range of h(s) is [0, 1.0]. A cohesion coefficient of 1.0 indicates that every consecutive pair of pathways in the story has overlapping biological entities (complete cohesion). A cohesion coefficient of 0.5 indicates that 50% of the consecutive pathway-pairs contain common biological entities in their text descriptions. A cohesion coefficient of 0.0 indicates no cohesion at all. This scalar value (metric) lets us rank and present stories to the user.
4. Experimental Results
To assess the power and performance of these clustering and storytelling algorithms, we conducted an experiment on the STKE dataset. All the results of this article are generated in a machine with Intel quad core processor and 8GB memory. The tool was implemented in Java, and the Java virtual machine was running under Windows Vista 64-bit platform during all the experiments.
4.1. Dataset
The STKE dataset (STKE, 2011) used in this work contained 50 pathways. Figure 7 shows that larger pathways are scarce in the dataset compared to smaller pathways. The largest pathway has 101 edges, and the smallest pathway has 2 edges. Since there are a total of 1,376 unique relations in the dataset, our MPG contains a total of 1,376 edges. Figure 8 provides the number of edges and pathways left as functions of sfipf threshold min_sfipf. It shows that large min_sfipf results in filtration of large amount of edges as well as pathways.

Number of pathways as function of size-range. The plot illustrates the distribution of the size of the pathways.
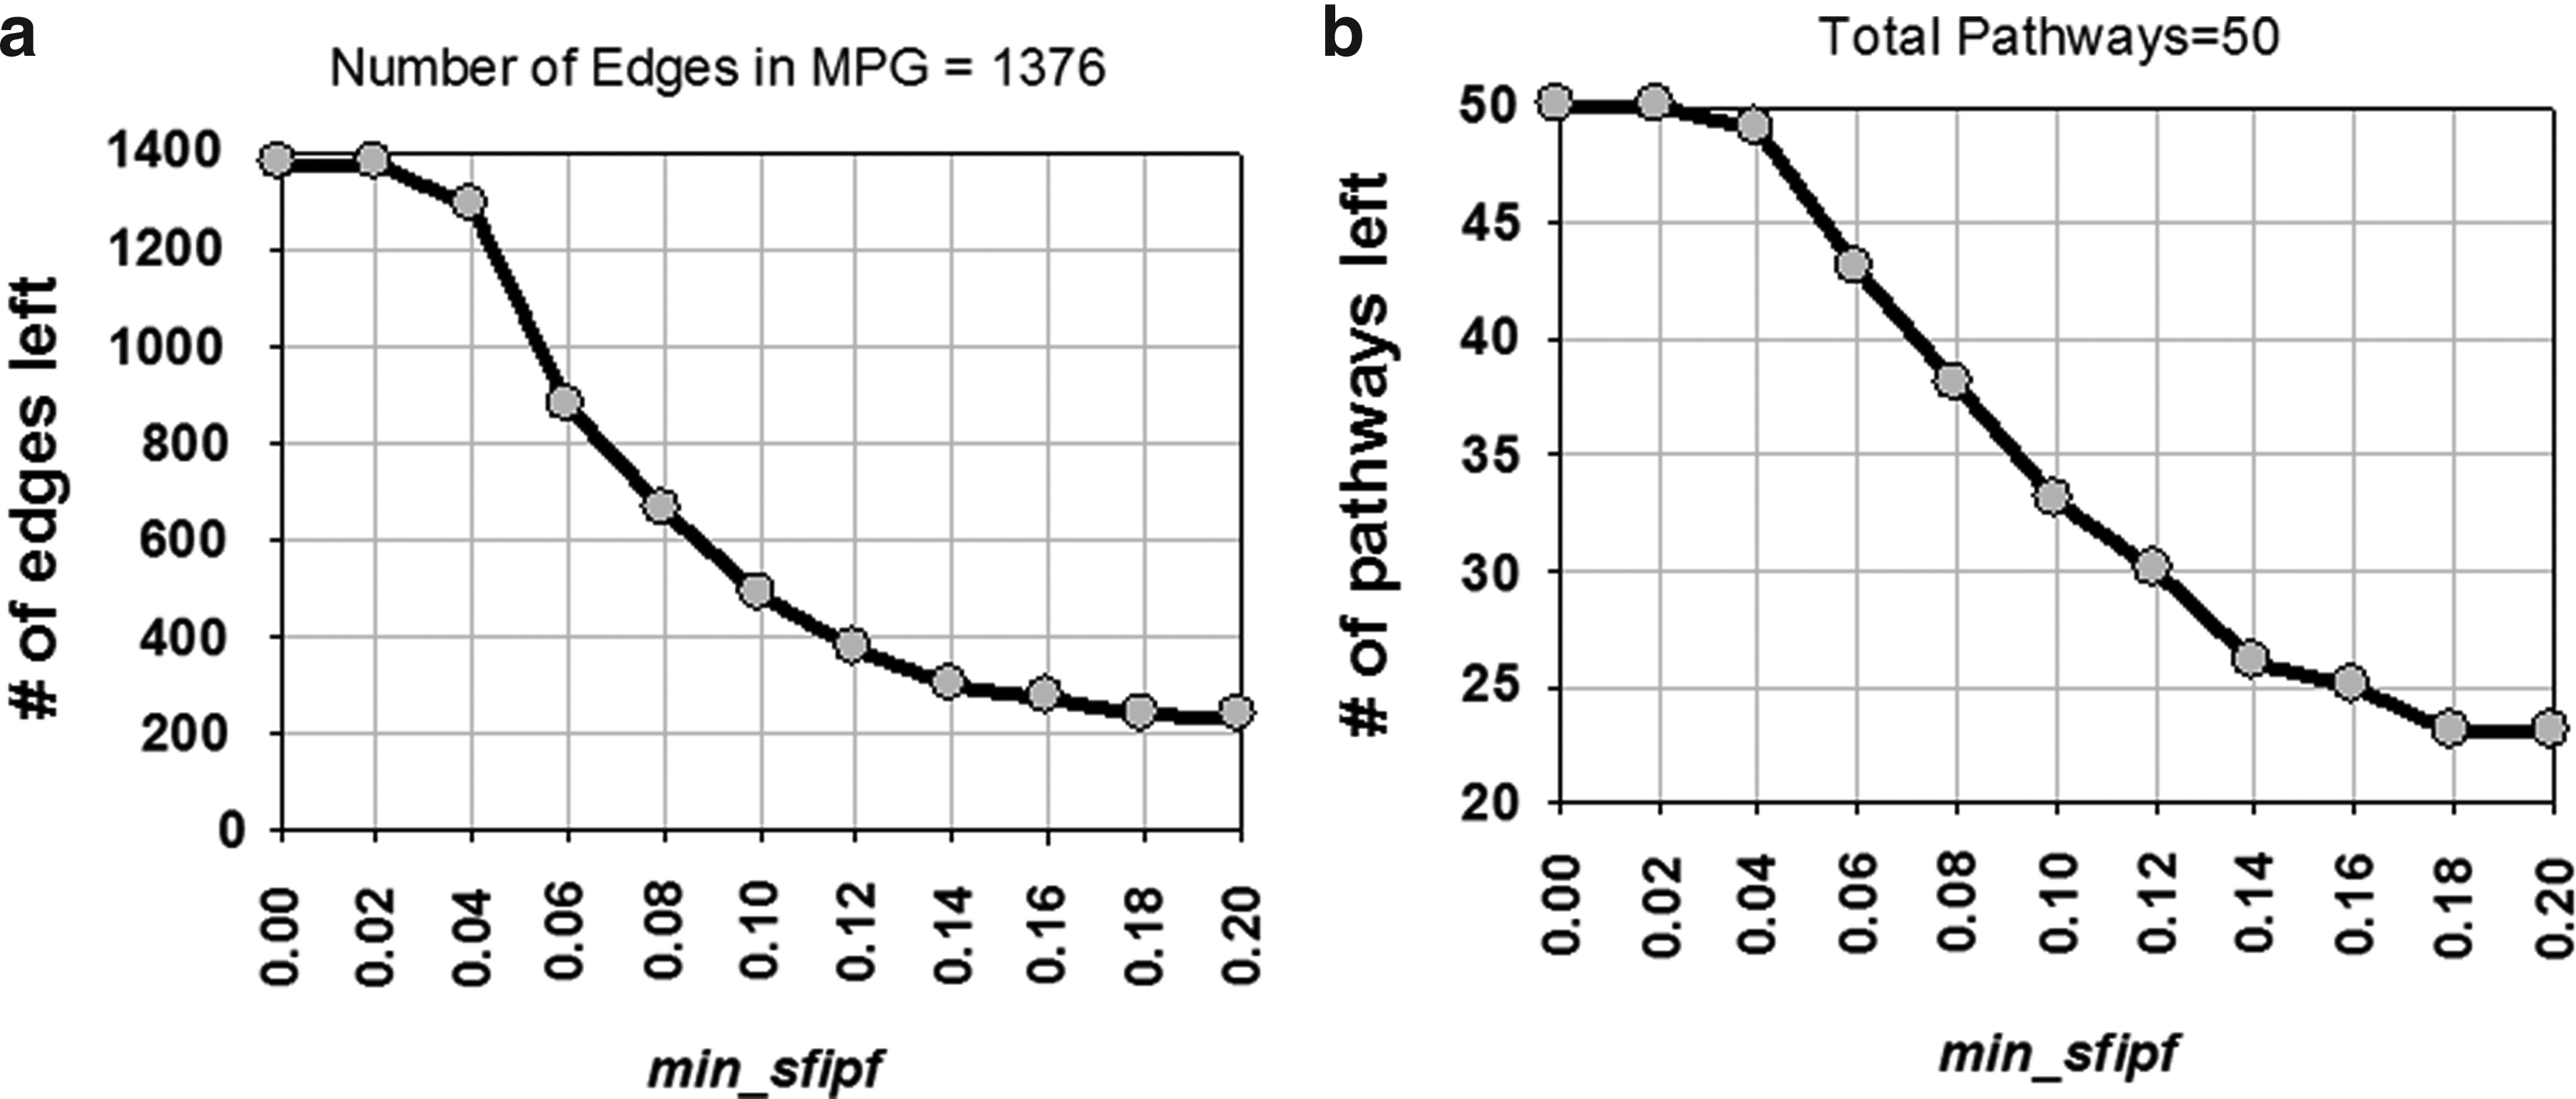
Effect of filtration using min_sfipf.
4.2. Subgraph discovery
The number of generated subgraphs in our subgraph discovery process depends on the min_sfipf and min_sup thresholds. Figure 9 shows experimental results with varying min_sfipf and min_sup. It shows that the subgraph discovery module discovers higher amounts of frequent subgraphs with lower min_sfipf and min_sup thresholds. The clustering and the storytelling parts require large amounts of subgraphs for better results. This means we can find better relationships and clusters among pathways with lower min_sfipf and min_sup values. On the other hand, lower min_sfipf and min_sup values result in longer runtime in the subgraph discovery process.
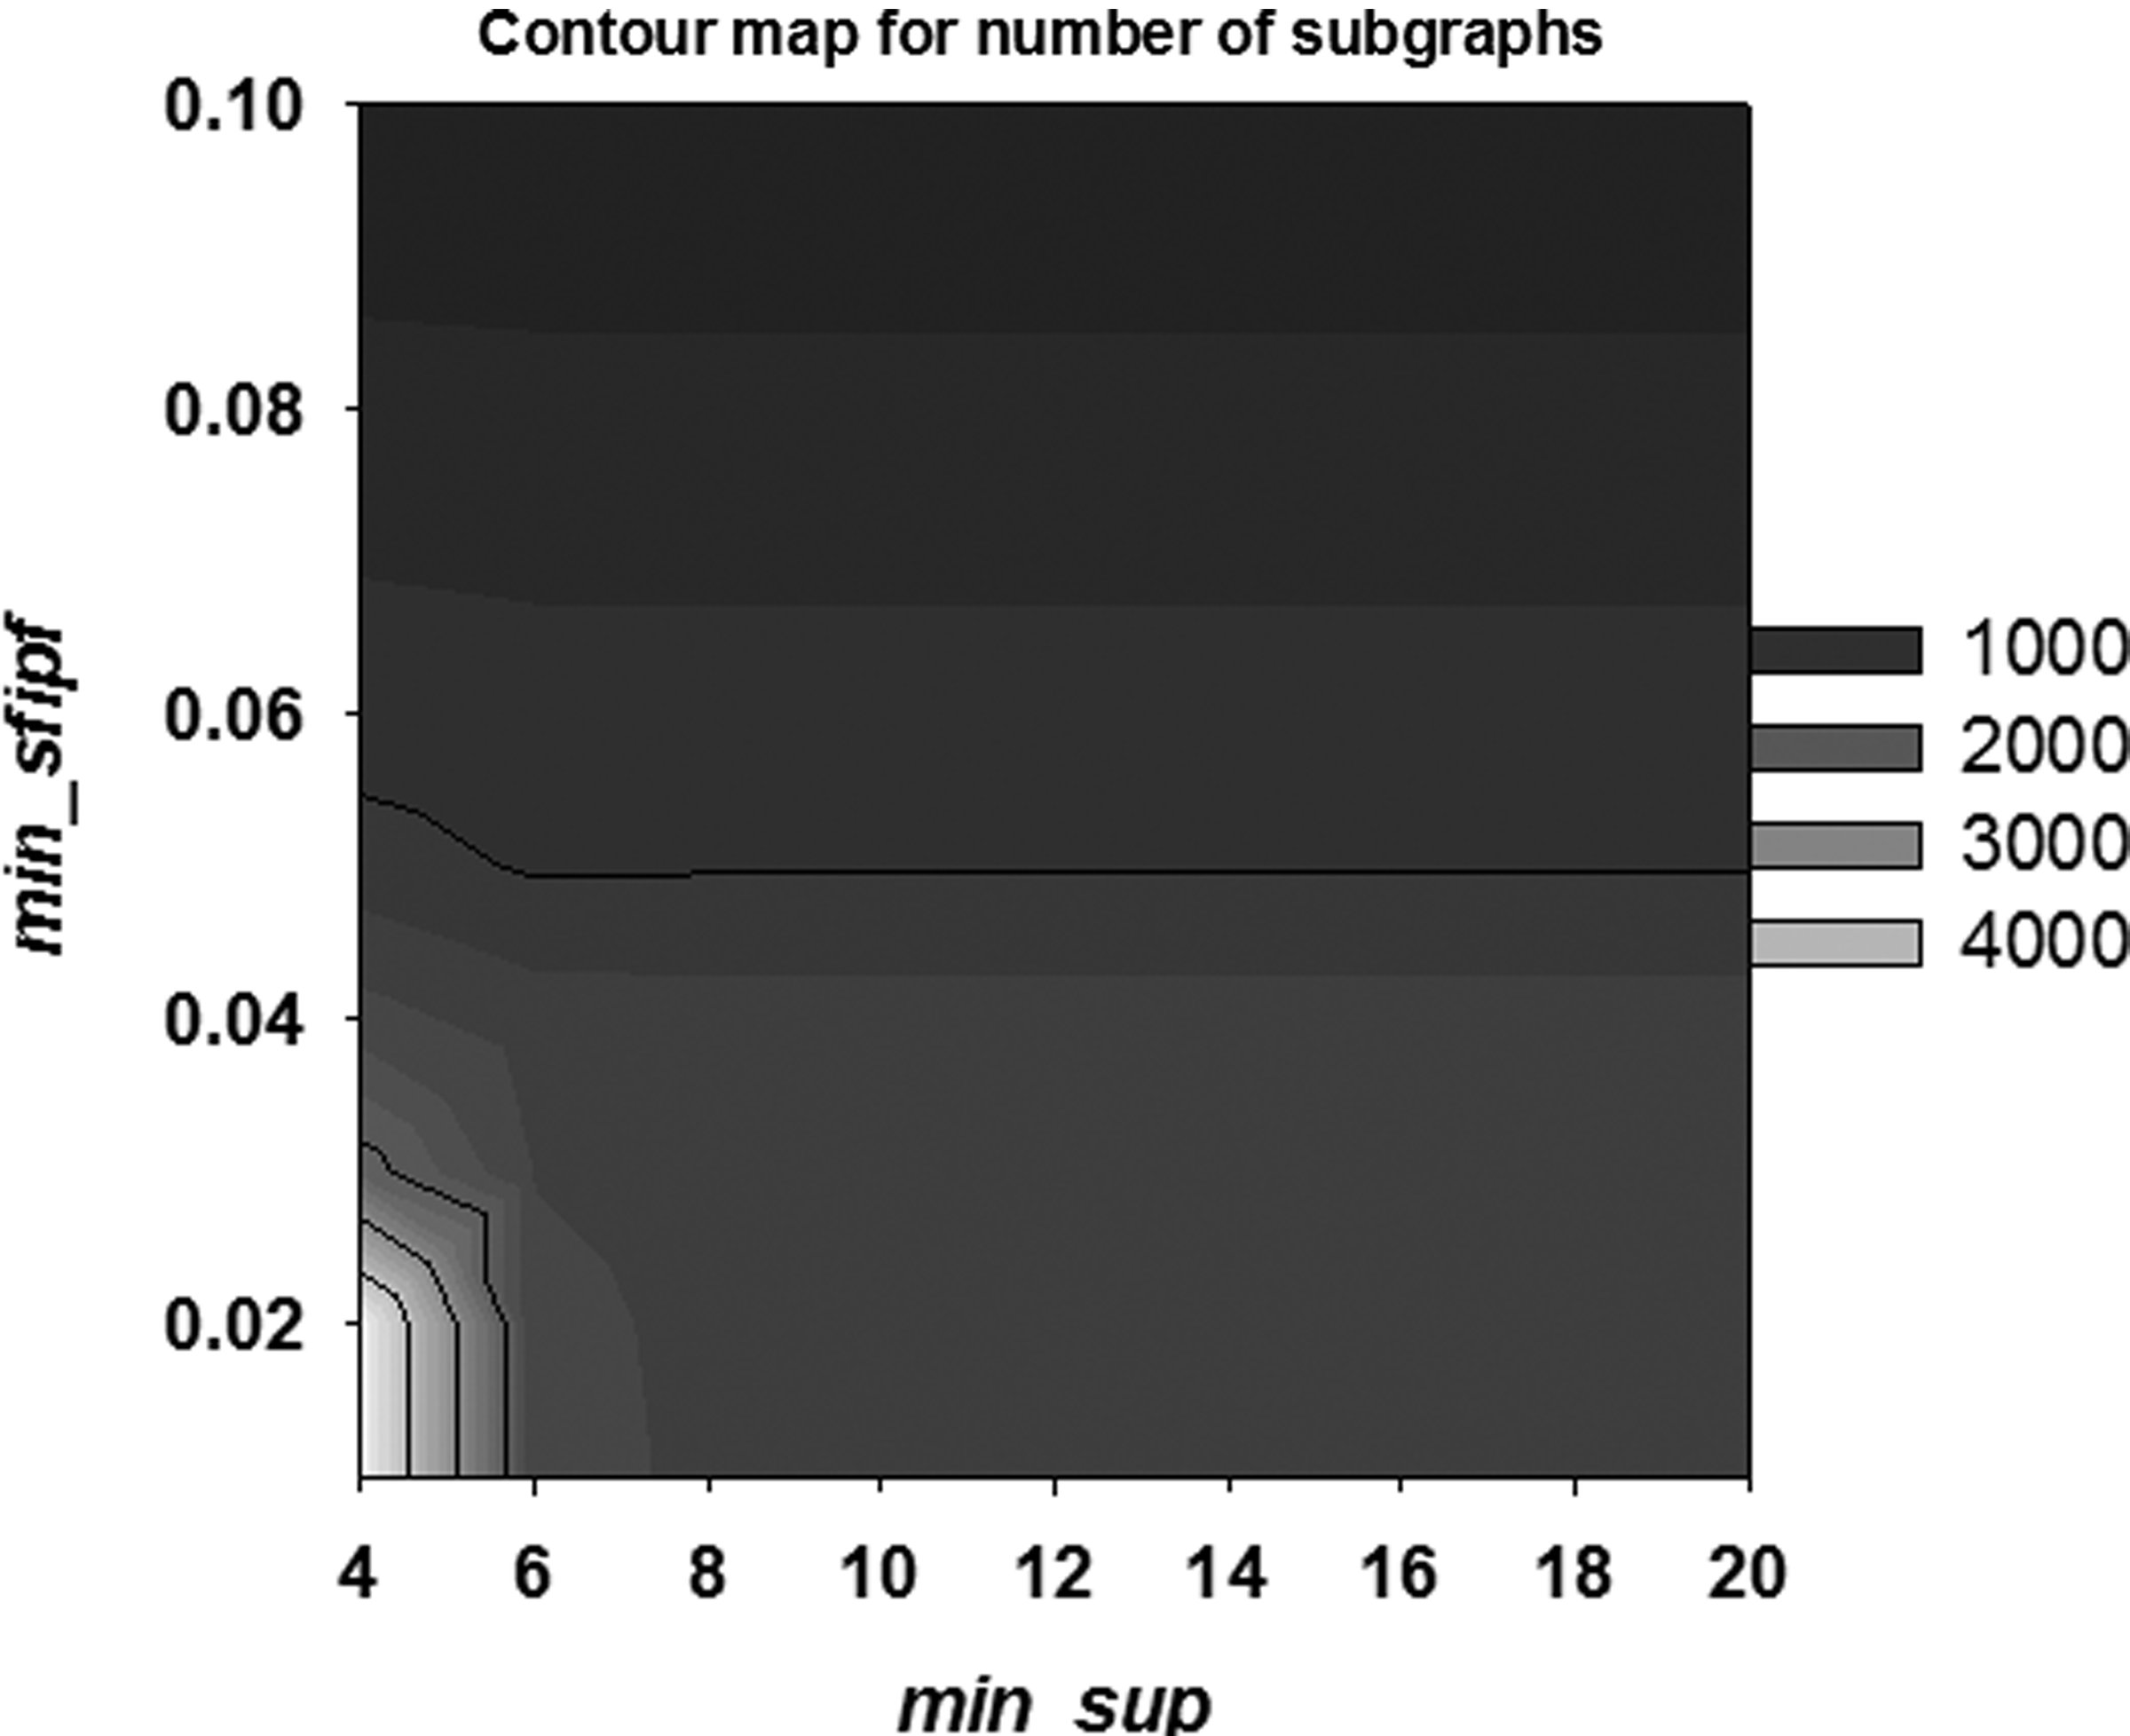
Contour map illustrating the number of generated subgraphs.
Additionally, lower thresholds require more memory due to the large number of generated candidate subgraphs during each iteration of the Apriori paradigm. This dependency on memory introduces a tradeoff between the lower parameter thresholds and the runtime of our algorithm. The degree of this tradeoff depends on the specification of the machine in which our tool is running.
A performance comparison between the FSG and our SEG approach is shown in Figure 10. Due to the significant speed of SEG, the gray line drawn for it appears to be linear and flat in comparison to the black line of the FSG approach, although, the actual behavior of SEG is not really linear. The curve maintains its hatlike shape, which is typical of the Apriori approach, but because of the scale necessary to show the FSG results, it is not clearly visible in Figure 10(a). We changed the scale in Figure 10(b) to show the actual behavior of SEG.
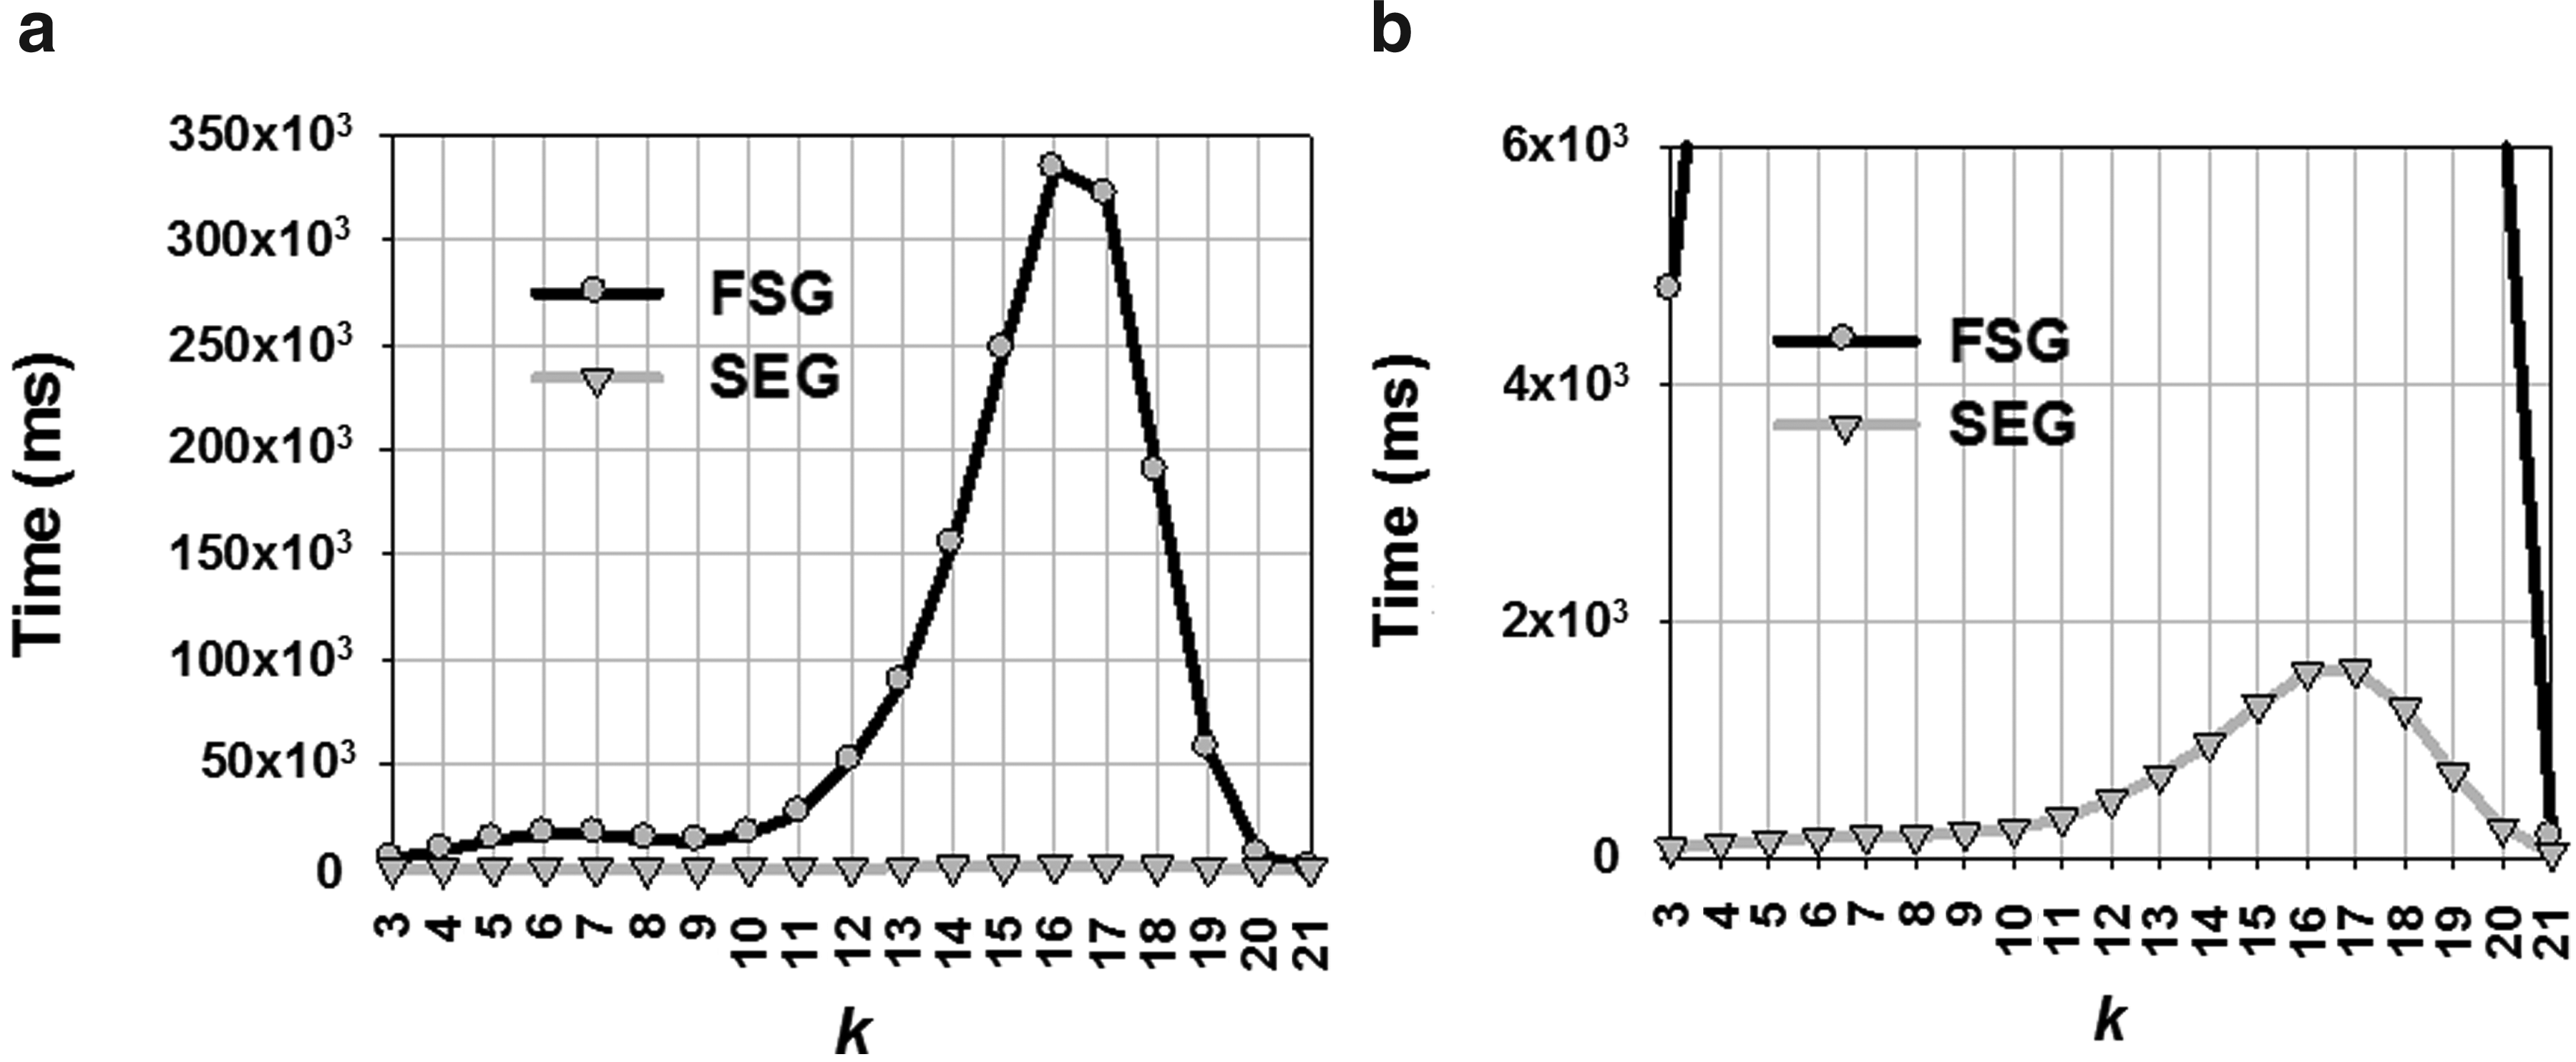
Runtime comparison between FSG and SEG (min_sup = 4.0%; min_sfipf = 0.01).
Figure 11 depicts the reason why the SEG approach is more efficient than the FSG approach. The figure compares numbers of attempts to generate k-edge subgraphs by the FSG and SEG approaches. The SEG approach outperforms the FSG approach by a high magnitude due to the lower number of attempts used to generate higher order subgraphs by avoiding blind attempts. Table 2 shows that in every case except for k = 21, SEG saved a huge percentage of blind attempts generated by the FSG approach.
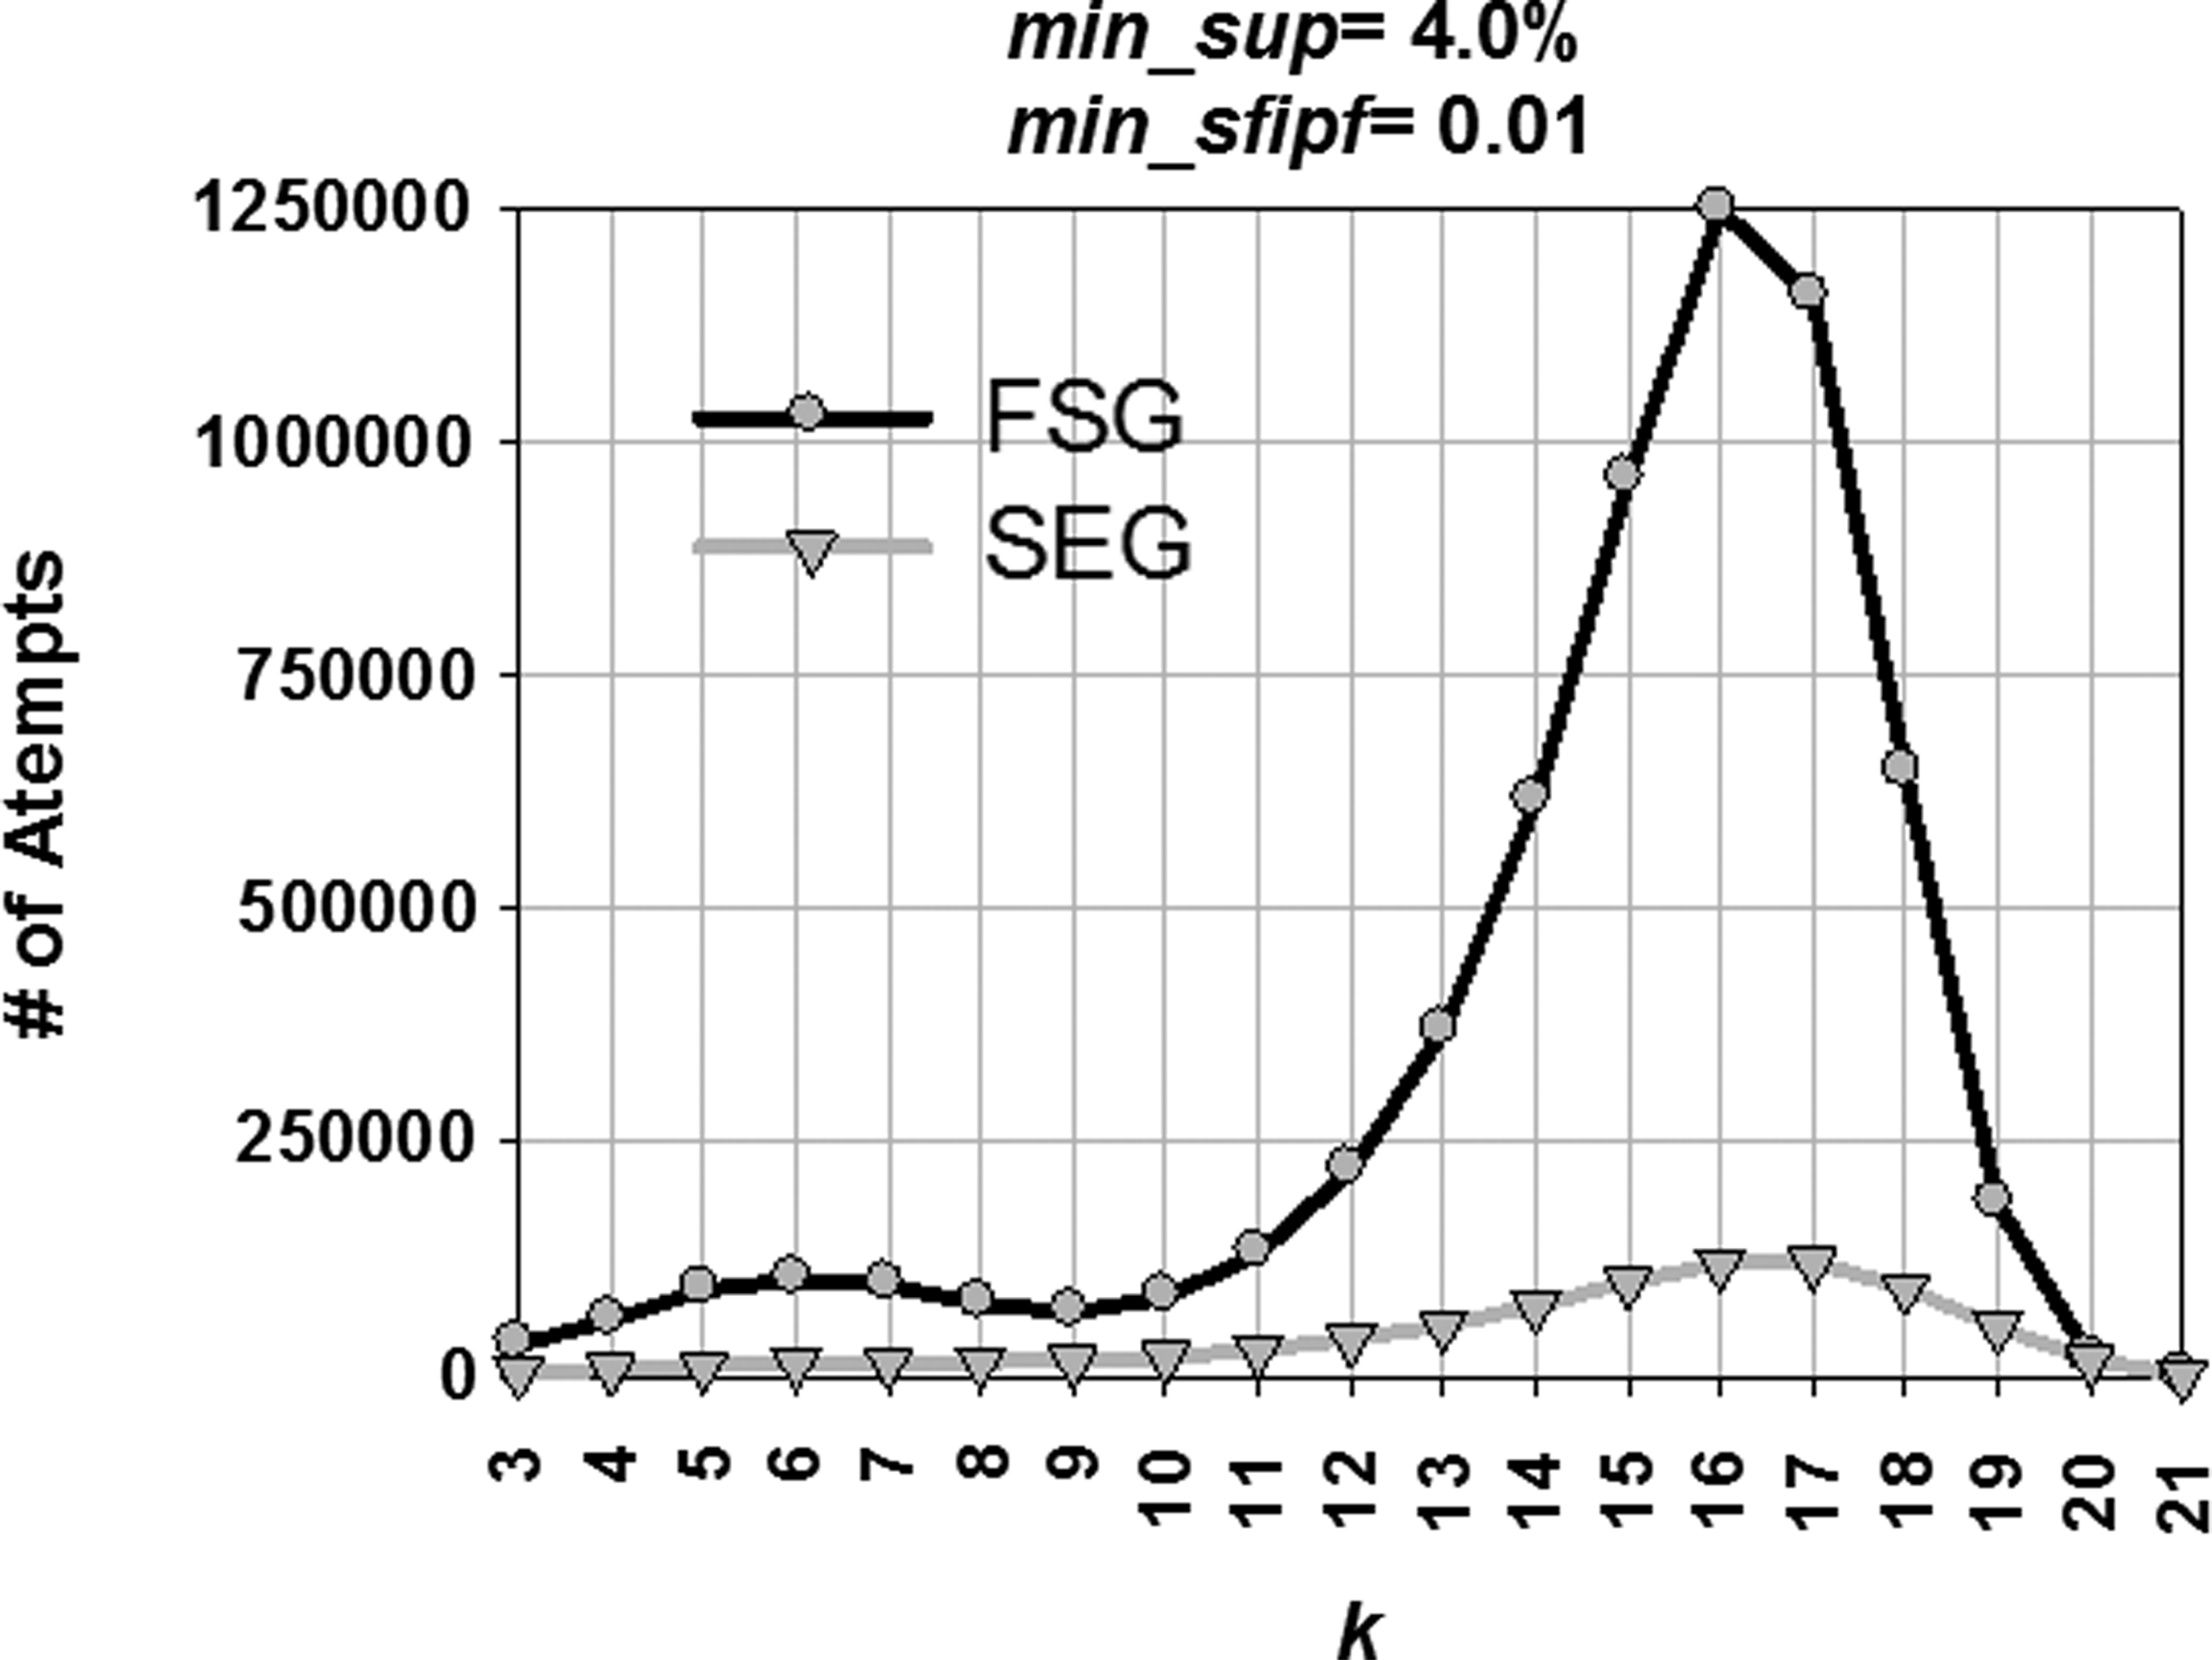
Number of attempts to discover k-edge subgraphs by FSG and SEG.
The SEG approach saved 90.26% of the attempts while generating 16-edge subgraphs from frequent 15-edge subgraphs. Since 15-edge subgraphs are the most frequent (1,117 15-edge subgraphs were discovered), obviously the number of attempts to construct 16-edge subgraphs from 15-edge subgraphs reaches the maximum for the FSG approach in Figure 11. Also, Figure 10 shows that both the curves reach their peaks near 16-edge subgraphs. Overall attempts saved by the SEG approach in this experiment was 89.52%, which saves 99.39% runtime used by the FSG approach.
4.3. Evaluating clustering results
We used HAC and k-means to automatically cluster the pathways. Figure 12 shows unsupervised (ASC) evaluations at different numbers of clusters both for HAC and k-means, using five different similarity measures. The plot shows that HAC provides higher ASC than the k-means clustering using any similarity measure for the STKE dataset.
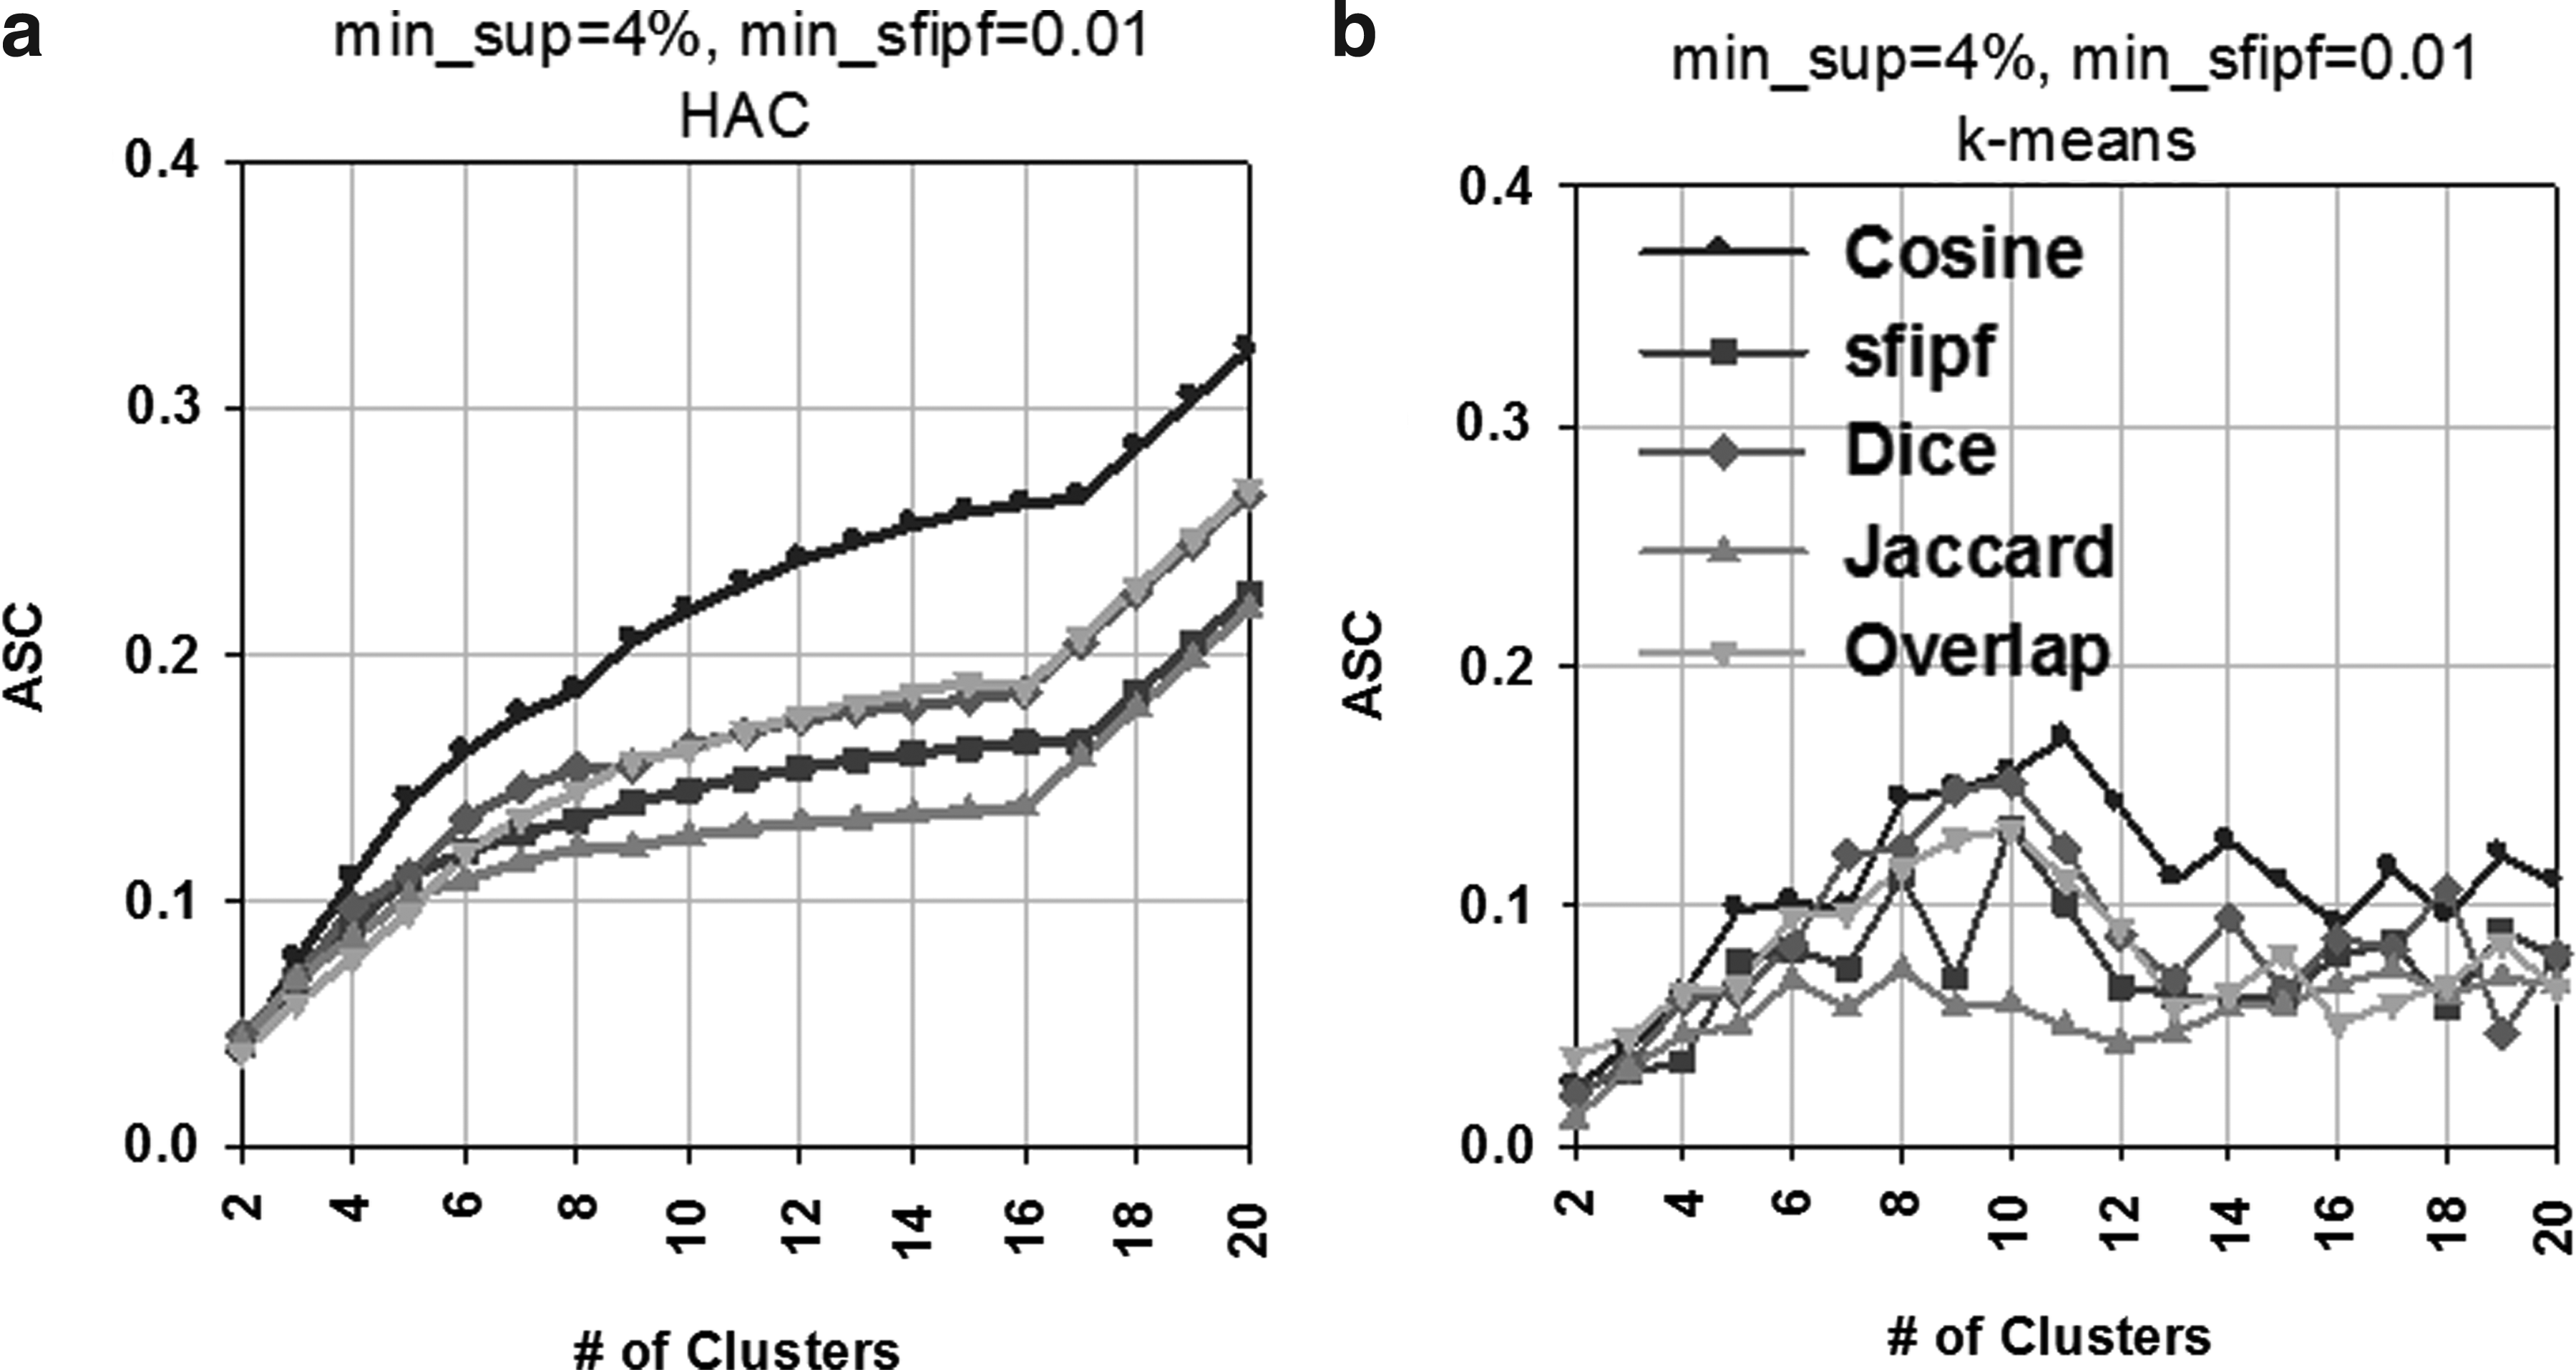
Average Silhouette Coefficient (ASC) at different numbers of clusters using
The clusters' accuracy also varies depending on the min_sup and min_sfipf thresholds. Figure 13(a,b) provides two ASC contour maps at 10 clusters for HAC and k-means, respectively. Figure 13(a) shows that HAC produces best results in the bottom left corner of the plot with ASC = 0.20. Similarly, Figure 13(b) shows that k-means generates its best clusters in the region with ASC = 0.14 of the plot where min_sup and min_sfipf thresholds are small. Therefore, both HAC and k-means generate better clusters with lower min_sup and lower min_sfips thresholds.
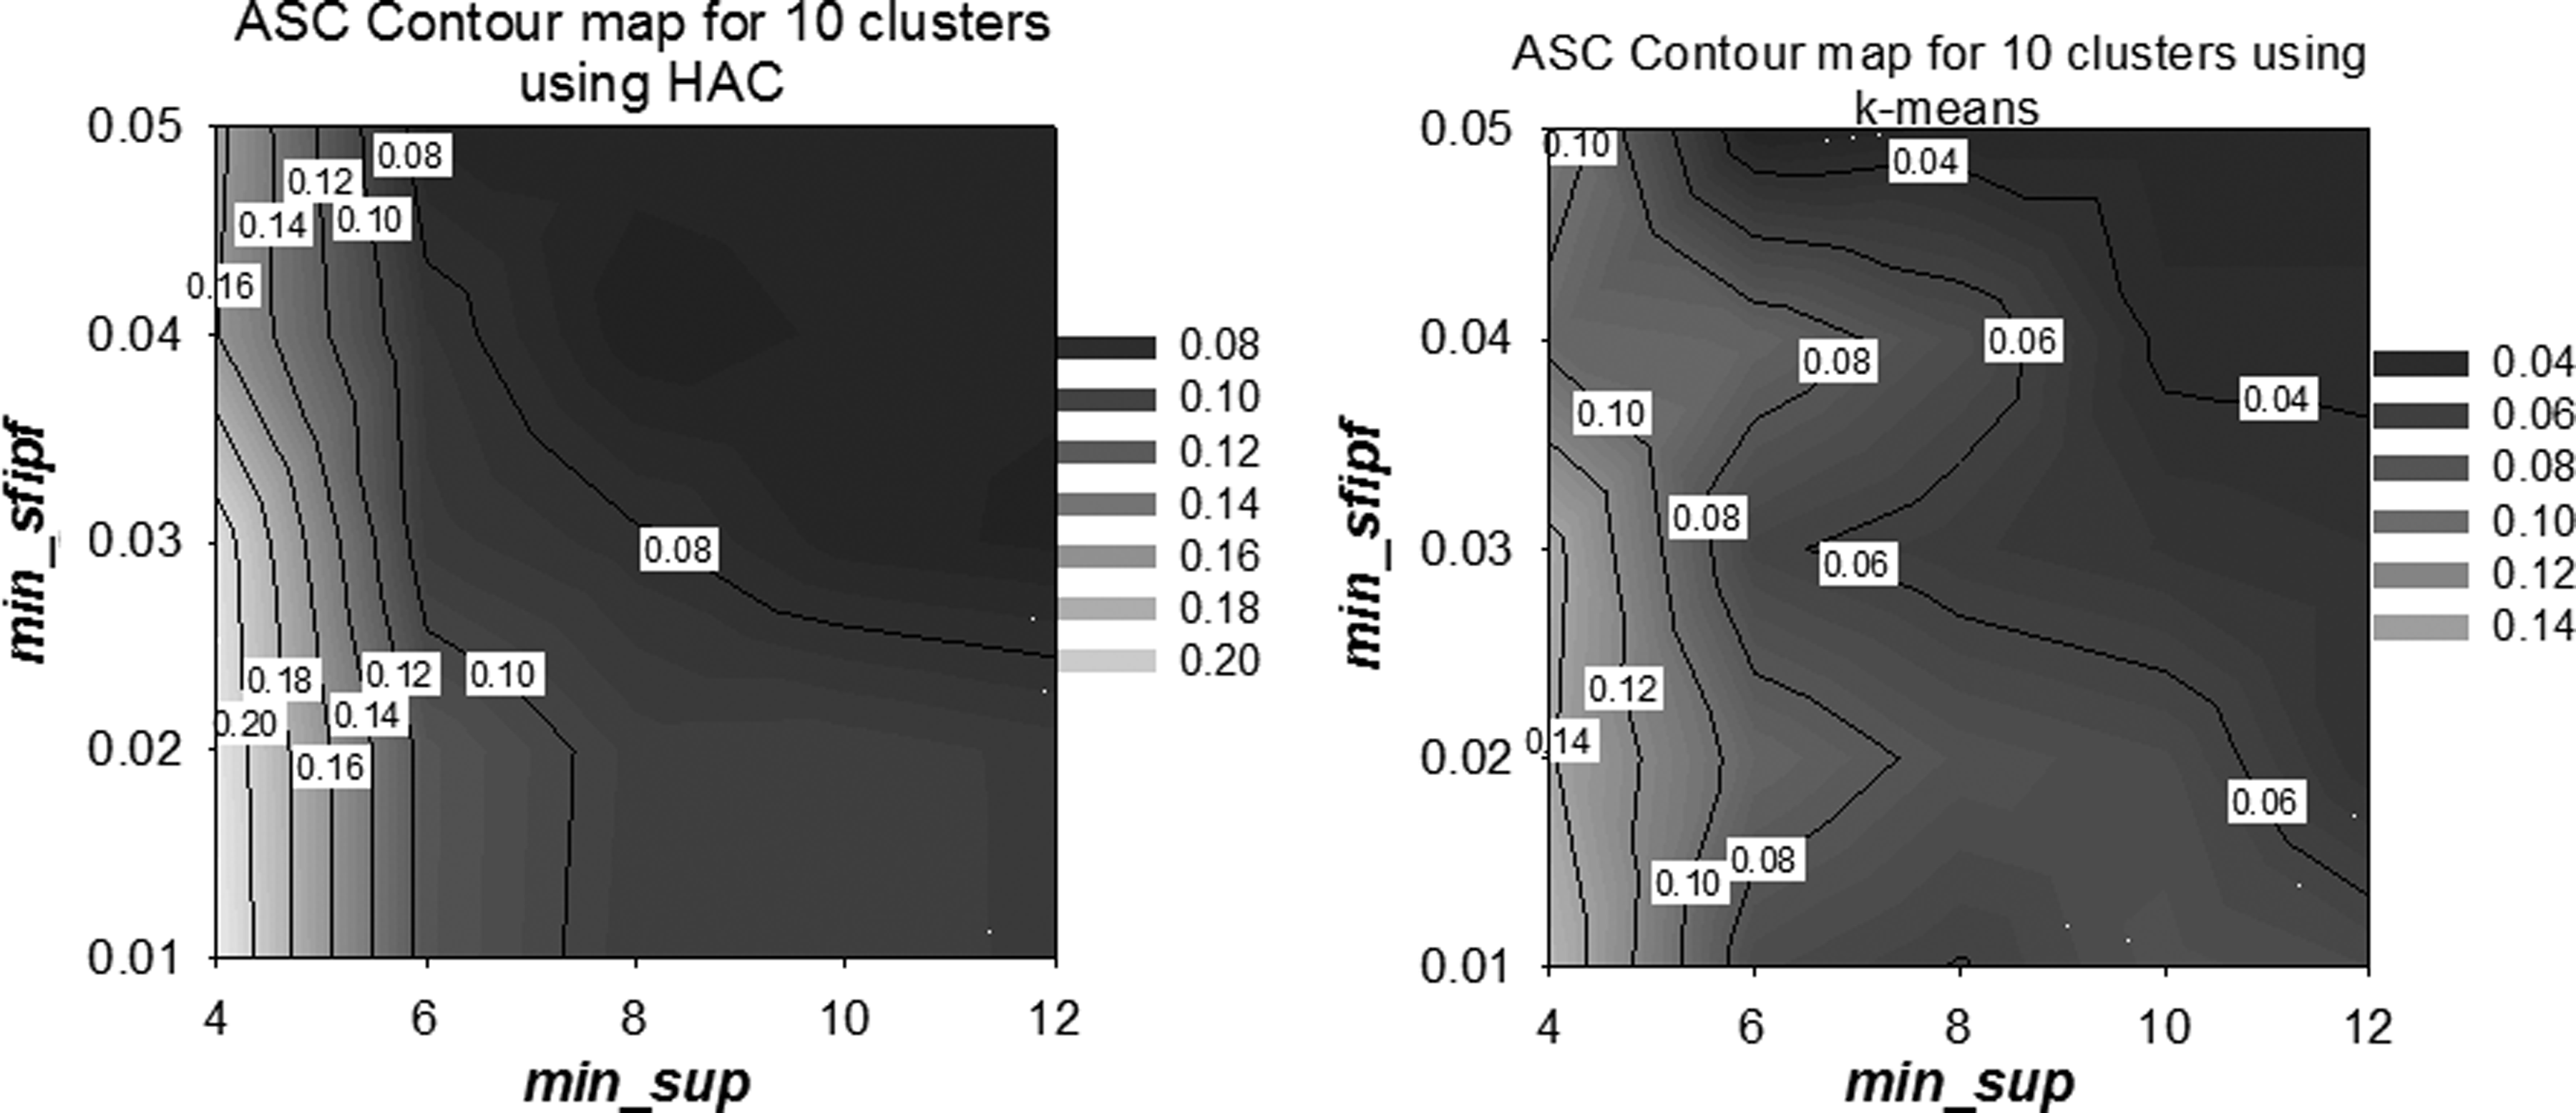
Contour maps for ASC at 10 clusters showing HAC
Earlier in Figure 9, we showed that lower min_sup and min_sfipf thresholds result in higher amount of subgraphs. Since lower min_sup and min_sfipf results in larger amounts of subgraphs, any clustering algorithm can better separate the groups, which results in high quality clusters. Figure 13 also shows that HAC performs better than the k-means clustering since HAC has higher ASC (0.20) than the ASC of k-means (0.14) in corresponding bottom-left corners.
4.4. Evaluating storytelling results
We attempted to generate stories for all possible pairs of pathways. But not all pairs have stories—some pairs do not have any relationship between them or with other pathways. The number of stories and story lengths vary with branching factor b used in the bidirectional search algorithm for storytelling. Figure 14(a) shows that a small branching factor has the tendency to generate few stories, and large branching factor generally generates lots of stories. Figure 14(b) also shows that the total number of generated stories is larger with high branching factor. Figure 14(c) depicts that large branching factor provides longer stories. Finally, Figure 14(d) shows the time to generate all possible stories using different branching factors. Although the bidirectional storytelling algorithm generates longer stories with higher branching factor, the process becomes slower.
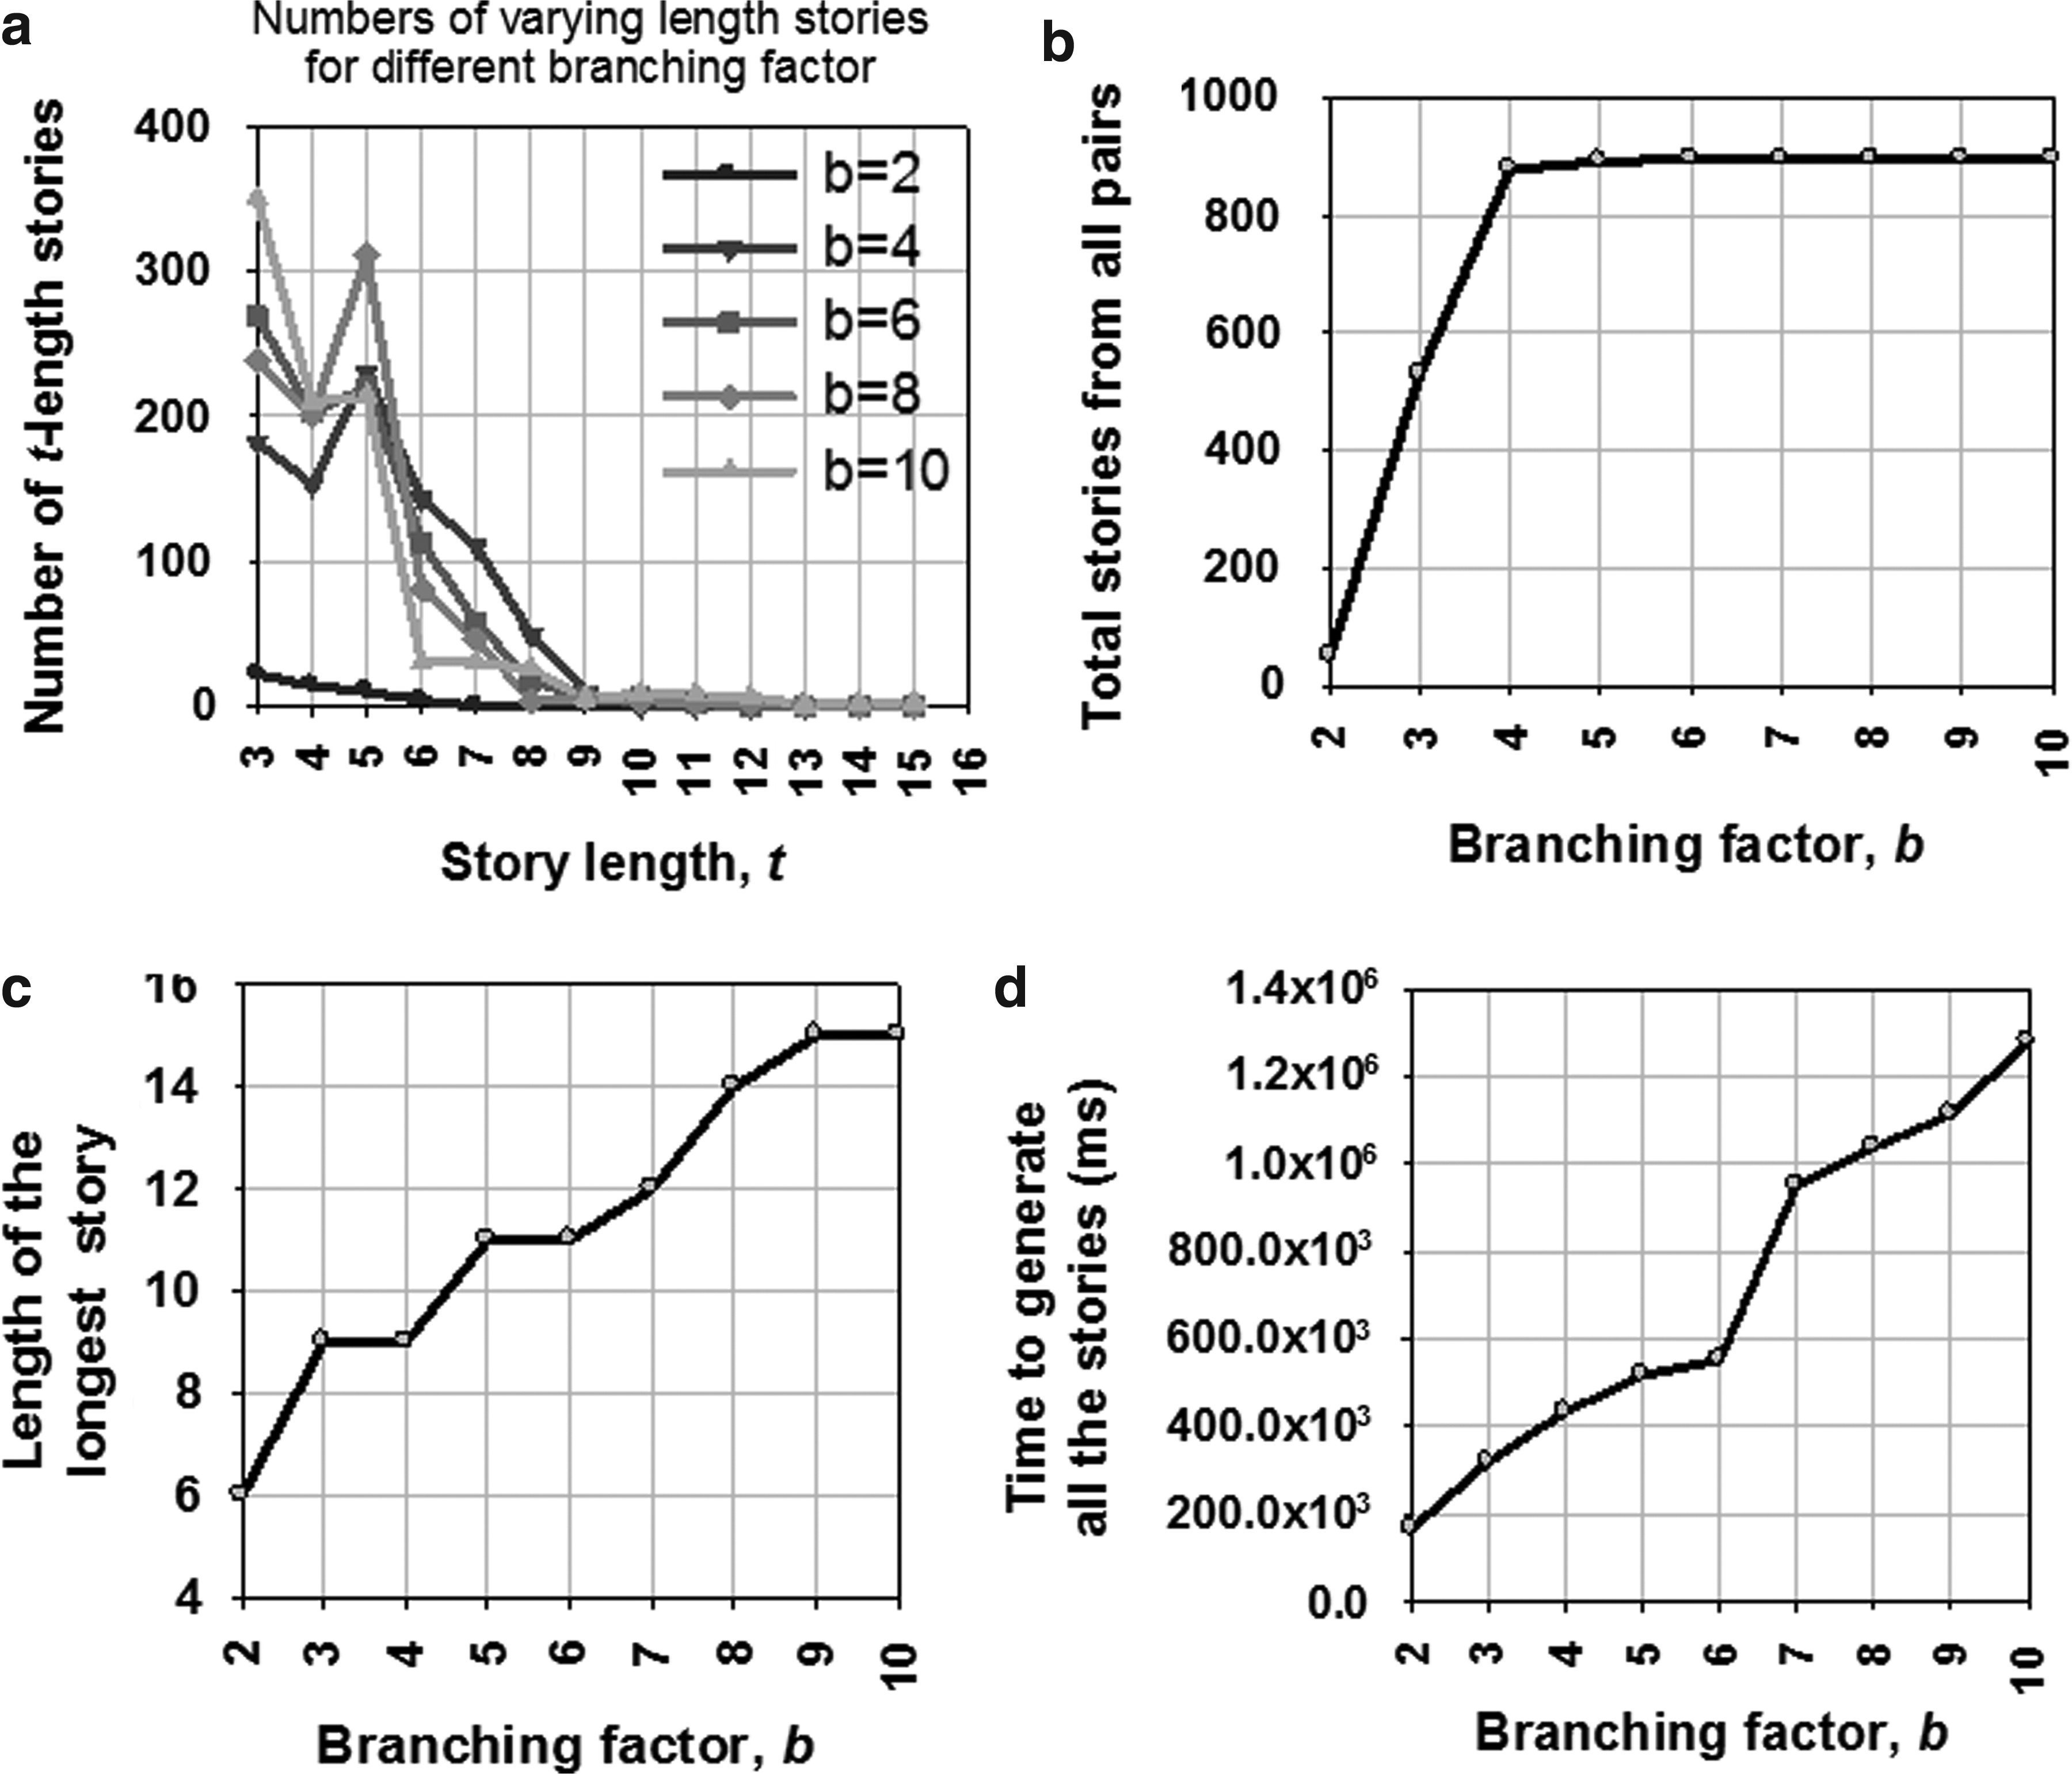
Storytelling results.
The total number of stories generated by our graph-based algorithm with a branching factor of 3 is 528. Figure 15(a) shows a histogram of the distribution of these stories in bins of Cohesion Coefficient (with bin width = 0.05). According to this plot, around 15% of the stories have high cohesion (0.95 to 1.0). The longest bar in this plot shows that about 22% of the stories have cohesion coefficient between 0.50 to 0.55. Each point of the plot of Figure 15(b) illustrates the percentage of stories above a certain cohesion coefficient, h. As seen from this plot, around 62% of the stories have cohesion coefficient greater than 0.5. However, some other information that these two plots do not specifically display are: the number of stories with exactly no cohesion (h = 0.0) and the number with complete cohesion (h = 1.0). A total of 43 stories (8.14%) have no cohesion in their pathway descriptions while 79 of the stories (14.96%) exhibit complete cohesion.
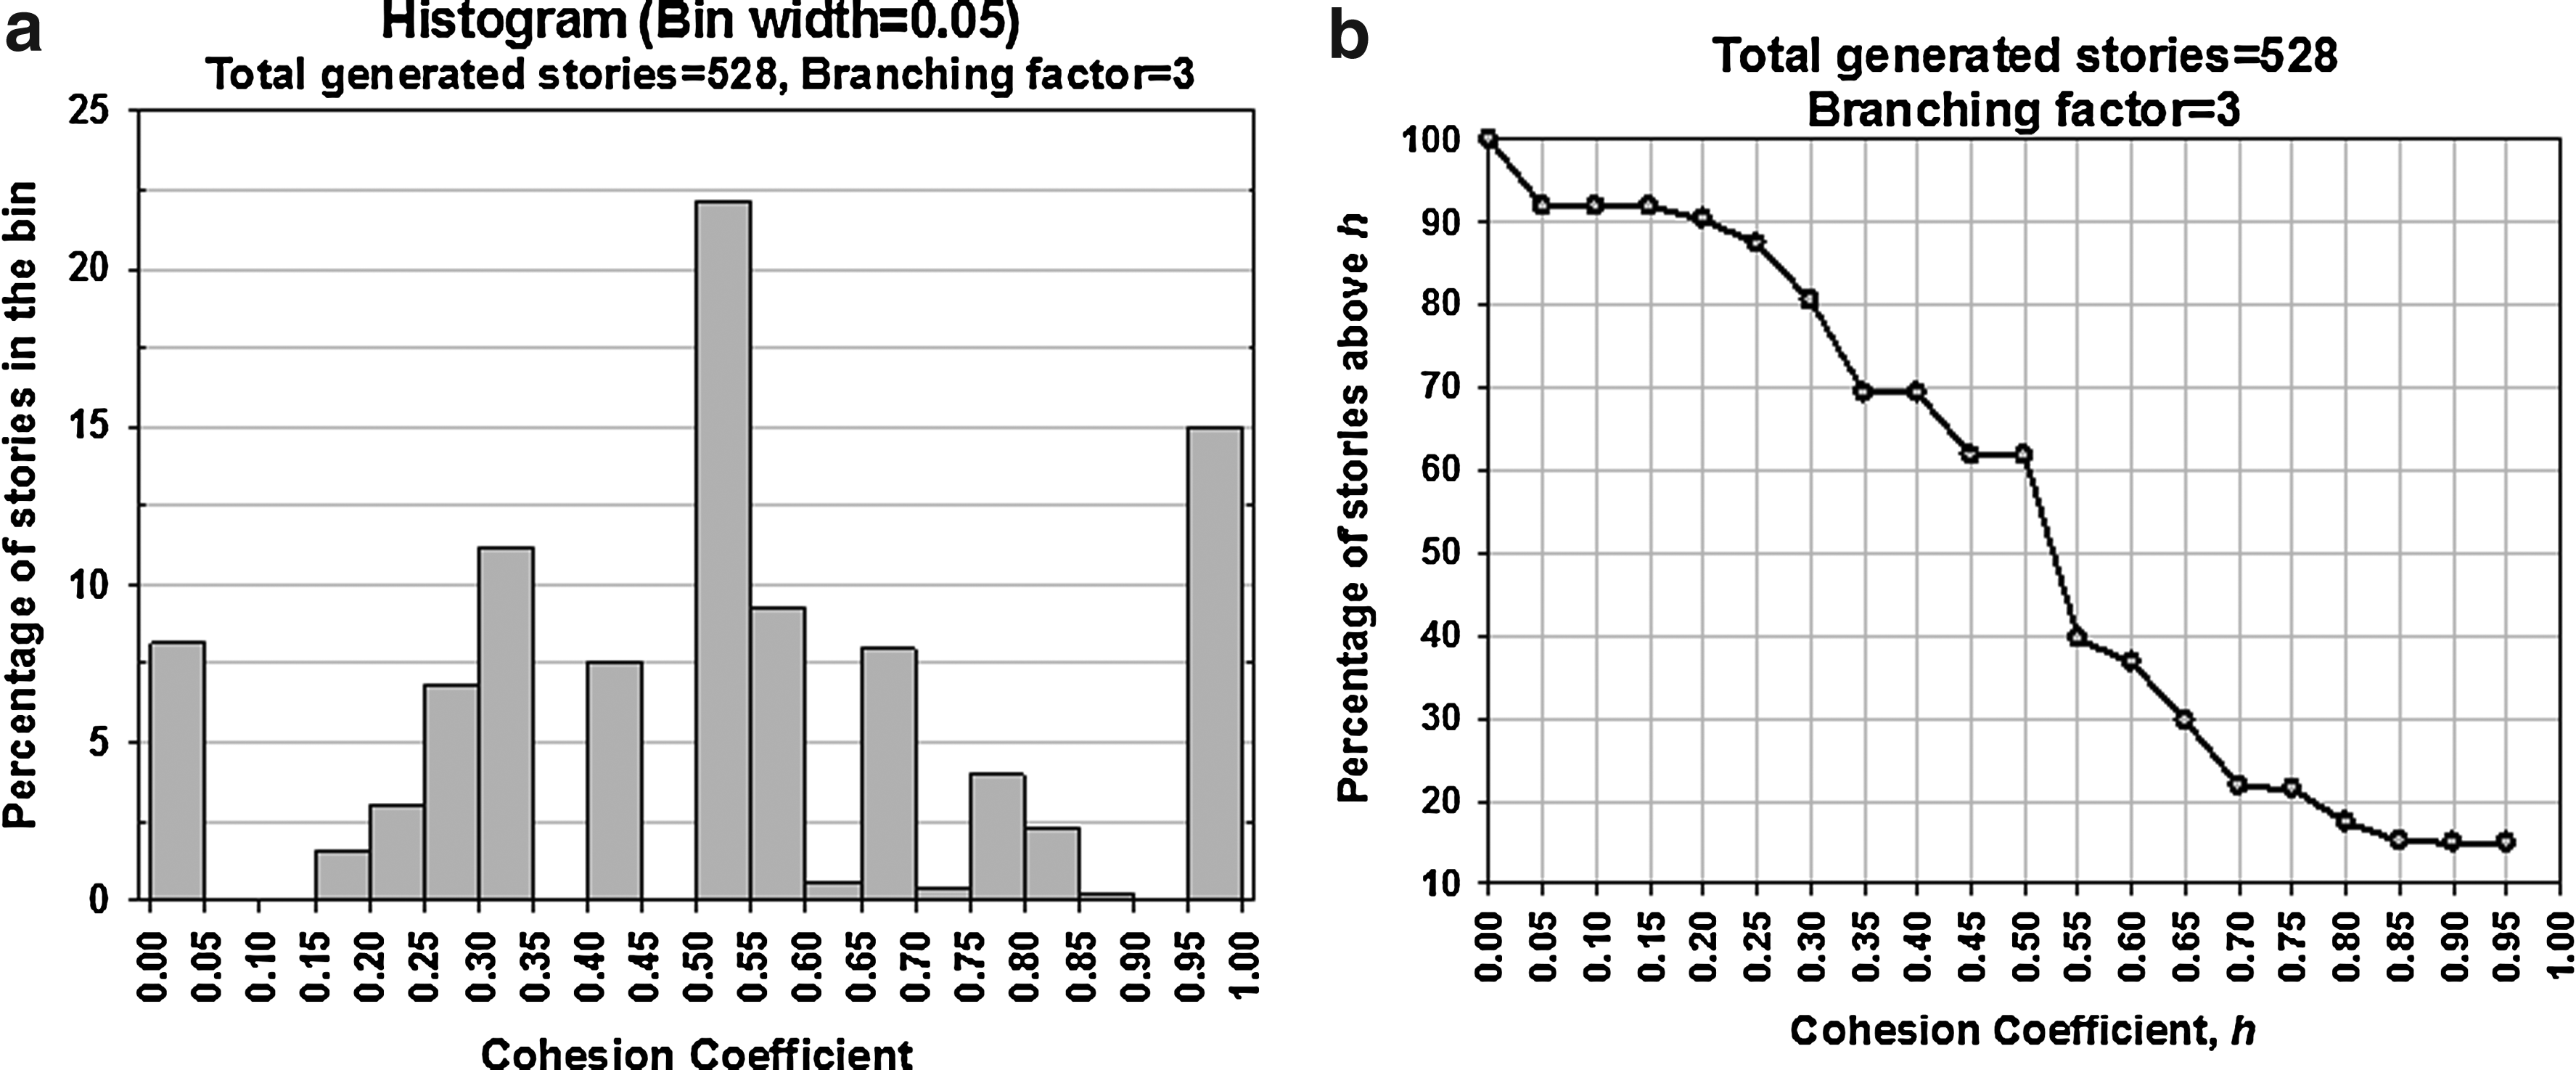
Evaluation of the stories.
We do not advocate the myopic view of cohesion in this context as a primary parameter of quality estimation for a story since cohesion considers only text descriptions provided in the original STKE dataset. While some descriptions are rich, others lack detailed information. Although a lot of chemical compounds can be associated with a pathway, its text description can be too short to analyze. For example, the B Cell Antigen Receptor pathway (CMP_6909 4 ) is a large pathway with 34 nodes of various kinds, but its text description contains only one sentence: “The B lymphocyte antigen receptor signaling pathway involves primarily positive signaling.” This might result in less cohesion than actually a biologist would discover. The final set of interesting stories should always be determined by the biologists and validated by formal experimentation. Our concept of cohesion can, however, assist investigators in narrowing down the set of automatically mined stories to good candidates.
5. Conclusions and Future Work
In this work, we developed a tool that would help biologists find non-obvious but significant relationships between cellular signaling pathways. These discovered relationships may provide new insights and new hypotheses to test. We have demonstrated enhanced algorithms in several phases of the work and given comparisons with traditional data mining approaches.
We addressed the problem of determining pathway relationships through clustering and storytelling techniques. We decomposed the problem of pathway-relation search into frequent subgraph discovery problems and provided a graph-based solution that depends on the structural overlaps between the pathways. Our tool and methods can help biologists, as well as data mining researchers, analyze the performance of different graph mining algorithms. Our tool also provides visualizations concerning the efficiency and outcomes of the mining algorithms and a quantitative way to evaluate the resulting clusters and stories.
Our mining methods and software framework have potential to be useful to other networks such as ontologies and semantic networks, social networks and online communities, and sensor networks. In the future, we hope to apply our methodology to some of these network types and use different corpi in order to evaluate their performance. In addition to applying our methods to other graph datasets, we are interested in the scalability of these mining algorithms. For example, future work will include larger networks and the marshaling of many machines to do the mining. The scalability of the SEG algorithm we have described is dependent on the machine and the support threshold defined by the analyst. We are also interested in introducing parallelization into the overall system. While the SEG and FSG approaches might be tough to parallelize (because each iteration depends on the results of the previous iteration), it is possible to parallelize the candidate generation of each iteration (individually) by distributing all the subgraphs of previous iterations to all the machines of a distributed network. Once we receive all the promising candidates from all the machines of the network, we can distribute them again to generate the candidates of the next iteration.
Visual analytics is gaining momentum in many research areas, but applying these visual analysis techniques to other knowledge bases and large network repositories (especially in biology like genomics, transcriptomics, proteomics, and metabolomics) remains a challenging and worthy problem.
Footnotes
Acknowledgments
Disclosure Statement
The authors declare that no competing financial interests exist.