
Abstract
ABSTRACT
The establishment and maintenance of proper gene expression patterns is essential for stable cell differentiation. Using unsupervised learning techniques, chromatin states have been linked to discrete gene expression states, but these models cannot predict continuous gene expression levels, nor do they reveal detailed insight into the chromatin-based control of gene expression. Here, we employ regularized regression techniques to link, in a quantitative manner, binding profiles of chromatin proteins to gene expression levels and promoter-proximal pausing of RNA polymerase II in Drosophila melanogaster on a genome-wide scale. We apply stability selection to reliably detect interactions of chromatin features and predict several known, suggested, and novel proteins and protein pairs as transcriptional activators or repressors. Our integrative analysis reveals new insights into the complex interplay of transcriptional regulators in the context of gene expression. Supplementary Material is available at www.libertonline.com/cmb.
1. Introduction
Chromatin immunoprecipitation (ChIP) followed by either microarray analysis (ChIP-chip) or high-throughput sequencing (ChIP-seq) enables researchers to produce whole-genome binding profiles of a variety of regulatory proteins. The model organism encyclopedia of DNA elements (modENCODE) consortium has recently published ChIP-chip and ChIP-seq profiles for a number of chromosomal proteins and histone modifications for Drosophila melanogaster and Caenorhabditis elegans (Kharchenko et al., 2011; Gerstein et al., 2010; Roy et al., 2010). For many of these features, the influence on gene expression and their functional relationships are yet to be discovered.
Statistical learning methods have been applied in order to model the structure of chromatin. Filion et al. (2010) used hidden Markov models to infer combinatorial chromatin states from the binding profiles of a variety of non-histone proteins plus the non-nucleosomal histone H1 and subsequently used these models to partition the genome of Drosophila melanogaster Kc167 cells in five distinct chromatin classes. Another clustering technique, namely subspace clustering, has been applied in order to identify combinatorial histone modification patterns in the human genome (Ucar et al., 2011).
Supervised learning methods have been used to identify single histone modifications and simple histone modification patterns which show either a marginal or a combinatorial association with gene expression (Karlić et al., 2010; Cheng et al., 2011). Most of the recently published work concentrates on the role of histone modifications in the context of gene expression, where strong involvement in transcription regulation has been shown for a number of these modifications. However, it is still unclear if histone modifications have a causal role in transcriptional regulation or if they are a consequence of it. The primary event for the regulation of gene transcription is the targeting of activating or silencing complexes to specific DNA elements, mediated by DNA binding proteins (Beisel and Paro, 2011). The biochemical functions of these complexes lead to the formation of an active or a repressed chromatin environment, a process in which characteristic histone modification patterns are established. Therefore, histone modification patterns can be interpreted as a readable code for the activity state of the underlying gene. Nevertheless, to understand how gene expression patterns are established during development and disease, it is necessary to decipher the concerted function of transcription factors and non-histone chromatin associated proteins which set the stage for proper gene regulation.
In this work, we focus on non-histone proteins and their influence on transcriptional regulation. The modENCODE consortium and we have recently generated a rich set of chromatin binding profiles for different transcriptional regulators in Drosophila melanogaster S2 cells including insulator proteins (BEAF-32, CP190, CTCF, Mod(mdg4), Su(Hw)), heterochromatin organizers (HP1a-c, HP2, Su(var)3-9, Su(var)3-7), Polycomb and Trithorax group (PcG and TrxG) proteins (Pc, Ph, Psc, Sce/dRing, E(z) Trx, Ash1, Fsh) and others (Table S.1) (Supplementary Material is available online at www.liebertonline.com/cmb). We integrated these chromatin maps based on ChIP-seq and ChIP-chip technology and assessed their predictive power in the context of transcriptional activity as well as promoter-proximal pausing.
We linked the protein binding profiles to gene expression via different regression methods. The fraction of the variance of transcriptional activity explained by the regression models varies between 70% and 80%. Analyses of these models in terms of feature selection and feature importance reveal chromatin features with high predictive power for expression and pausing of nearby genes.
We further applied stability selection (Meinshausen and Bühlmann, 2010), a robust feature selection method, in order to identify statistical interactions among features. Significant interactions suggest the joint action of chromatin-modifying proteins for controlling gene expression. We demonstrate that this approach is capable of identifying predictive features and feature interactions with low marginal correlation to transcriptional activity. In addition, it can be used to assign either activator or repressor roles to the selected proteins and pairs of interacting proteins. The prediction of both long and short RNAs, which represent transcriptional activity and promoter-proximal pausing, respectively, enabled us to discriminate features important for both processes and suggest new mechanisms for the regulation of gene expression at the rate limiting step of initiation to progressive elongation.
2. Results
We analyzed ChIP-chip and ChIP-seq profiles of 27 non-histone proteins from Drosophila melanogaster S2 cells in order to determine their regulatory effect on gene expression (Fig. 1). Six of them were generated with two different antibodies resulting in 33 analyzed chromatin maps in total (Table S.1) (Supplementary Material is available online at www.liebertonline.com/cmb). Additionally, we used five RNA-seq and two transcription start site (TSS) associated short RNA (shortRNA-seq) datasets generated in S2 cells (Table S.1) to determine the expression level and the extent of promoter-proximal pausing of all annotated genes (Supplementary Material is available online at www.liebertonline.com/cmb).
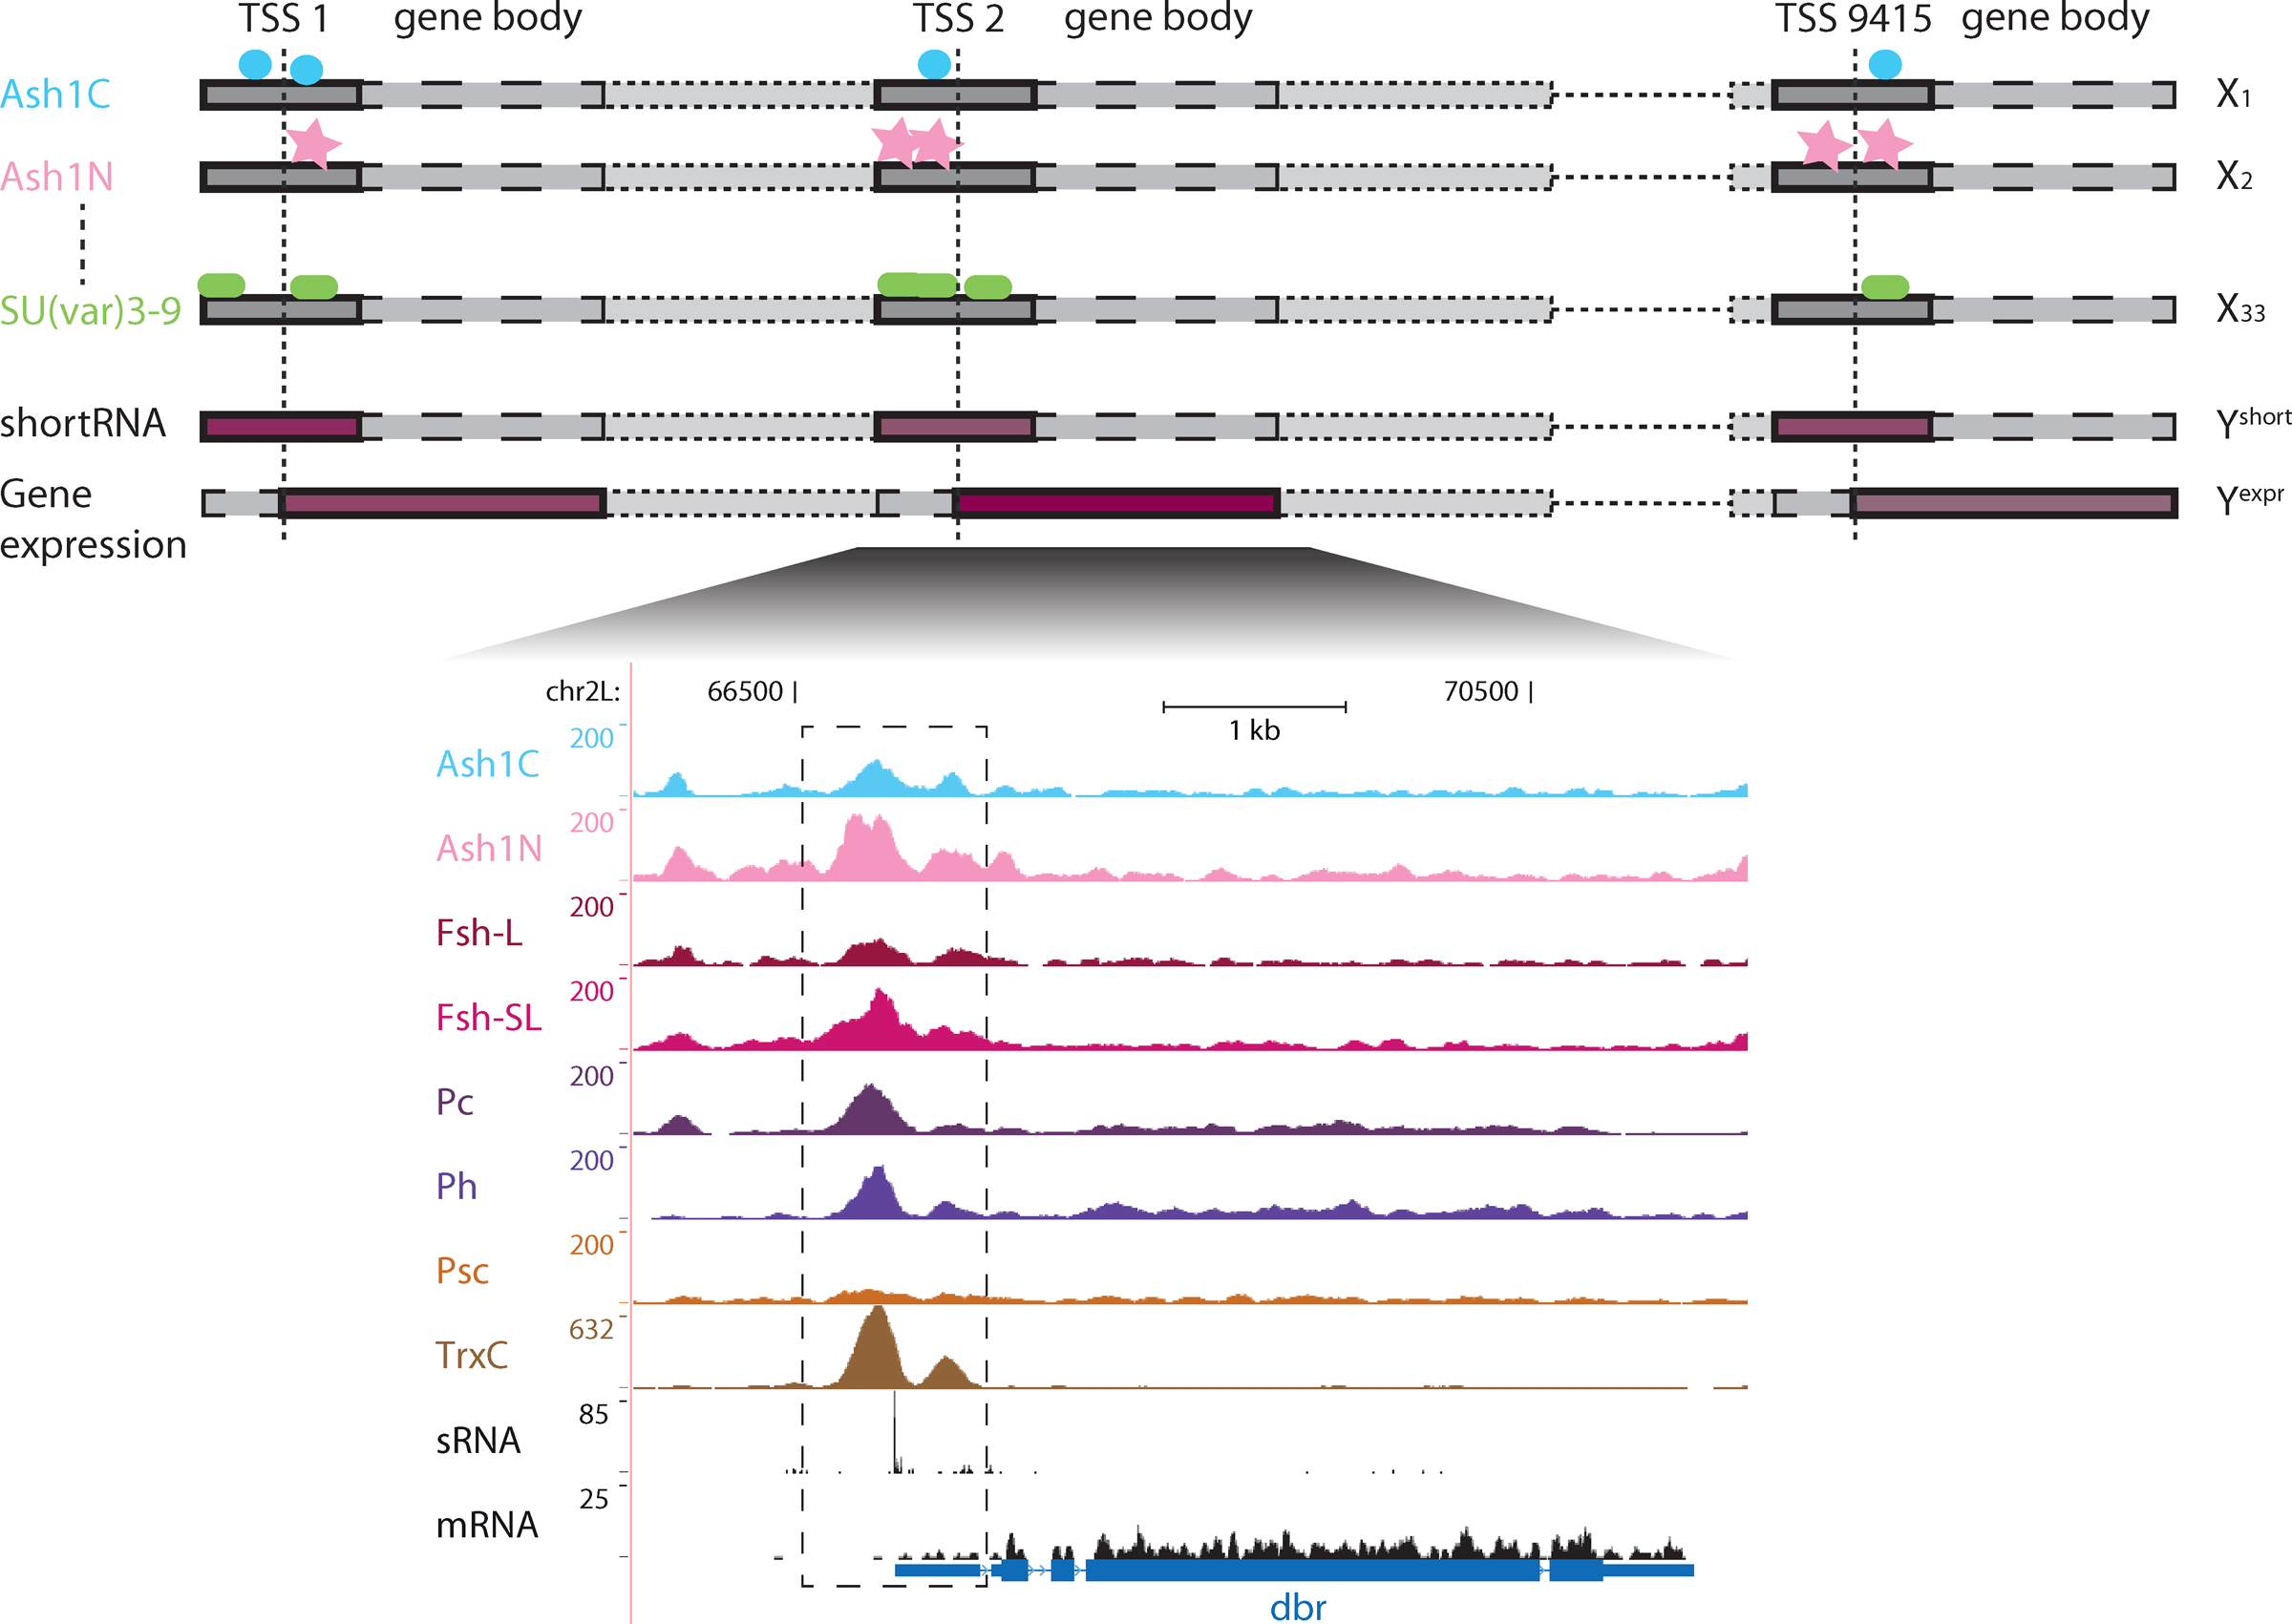
Schematic overview of the regression problem. Binding profiles of non-histone chromatin proteins (measured by ChIP-chip and ChIP-seq) are scored and the expression of the associated genes is estimated (RNA-seq). These promoter features are used as explanatory variables and the gene expression and short RNA expression, respectively, as dependent variables. The genes are regarded as independent and identically distributed samples. In the lower part of the figure, a UCSC browser zoom-in to one example gene is shown. It contains the tracks of all analyzed ChIP-seq, one RNA-seq (Enderle et al., 2011), and the shortRNA-seq (Nechaev et al., 2010) datasets for the dbr promoter and gene body.
To unambiguously assign the ChIP signals to their corresponding genes we focused our analysis on a 1kb window (±500 bp) around TSSs. These windows are referred to as promoters throughout this article. Transcripts which have overlapping non-identical TSS windows were omitted. This procedure resulted in 9415 TSSs that were used in all subsequent analysis steps. An alternative promoter definition of −1000 to +500 bp resulted in the loss of 1177 TSSs. However, the performance of the prediction models did not increase (data not shown); therefore we did not consider this more relaxed promoter definition further.
Log-transformed ratios of the ChIP and the respective chromatin input values in the promoter regions were used to quantify the respective ChIP signal for both the ChIP-chip profiles and the ChIP-seq read counts. We used the program Cufflinks to calculate the expression levels for all transcripts associated with a given TSS as FPKM values (i.e., fragments per kilobase of transcript per million fragments sequenced) (Trapnell et al., 2010). Expression values of transcripts starting at the same position were then summed and log-transformed. Throughout this article, the term gene refers to the set of transcripts starting at the same TSS and the promoter enrichment scores of the chromatin immunoprecipitated proteins are referred to as features. Promoter-proximal pausing levels were quantified by the log-transformed counts of the shortRNA-seq reads mapping to the promoters (Nechaev et al., 2010).
Linear models with and without interaction terms are a common choice for classification and regression problems resulting in simple, interpretable models. Our data set contains high-dimensional, continuous covariates with high noise levels and is therefore prone to overfitting. Regularization is an effective technique to deal with overfitting. We use L1 penalization (Lasso) for regularization (Tibshirani, 1996; Efron et al., 2004). Due to the geometrical properties of the Lasso, most of the coefficients in the regularized model will be zero and the resulting sparse solution is easy to interpret. Regularized regression methods have already been successfully employed to discover transcription factor binding motifs (Zamdborg and Ma, 2009).
Random Forests (RFs) can also be used for regression (Breiman, 2001). An RF is an ensemble of regression trees, where the leaves vote for the mean of the response values of the data partition that ended up in the particular leaf. RFs address overfitting by combining many weak learners. They are less interpretable; however, they often perform very well. They have recently been applied in order to decipher gene regulatory networks in Escherichia coli and scored best in the DREAM4 In Silico Multifactorial challenge (Huynh-Thu et al., 2010).
The two types of models are the basis for all analyses presented in the remainder of the article. The performance of all trained models are reported as R2 values, which quantify the fraction of variance of the response variable explained by the model.
2.1. Quantitative prediction of gene expression
We were interested in the specific contributions of chromosomal proteins to the level of gene expression. To address this question, we trained and validated linear regression models with Lasso regularization (Lasso) and RF regression models for predicting the means of the log-transformed expression values of five RNA-seq datasets.
Lasso models performed well with a 10-fold cross-validated R2 value of 0.70. The R2 value of the RF model was 0.73. These values correspond to Pearson correlations between the predicted and the actual expression values of 0.83 and 0.86 for Lasso and RF, respectively.
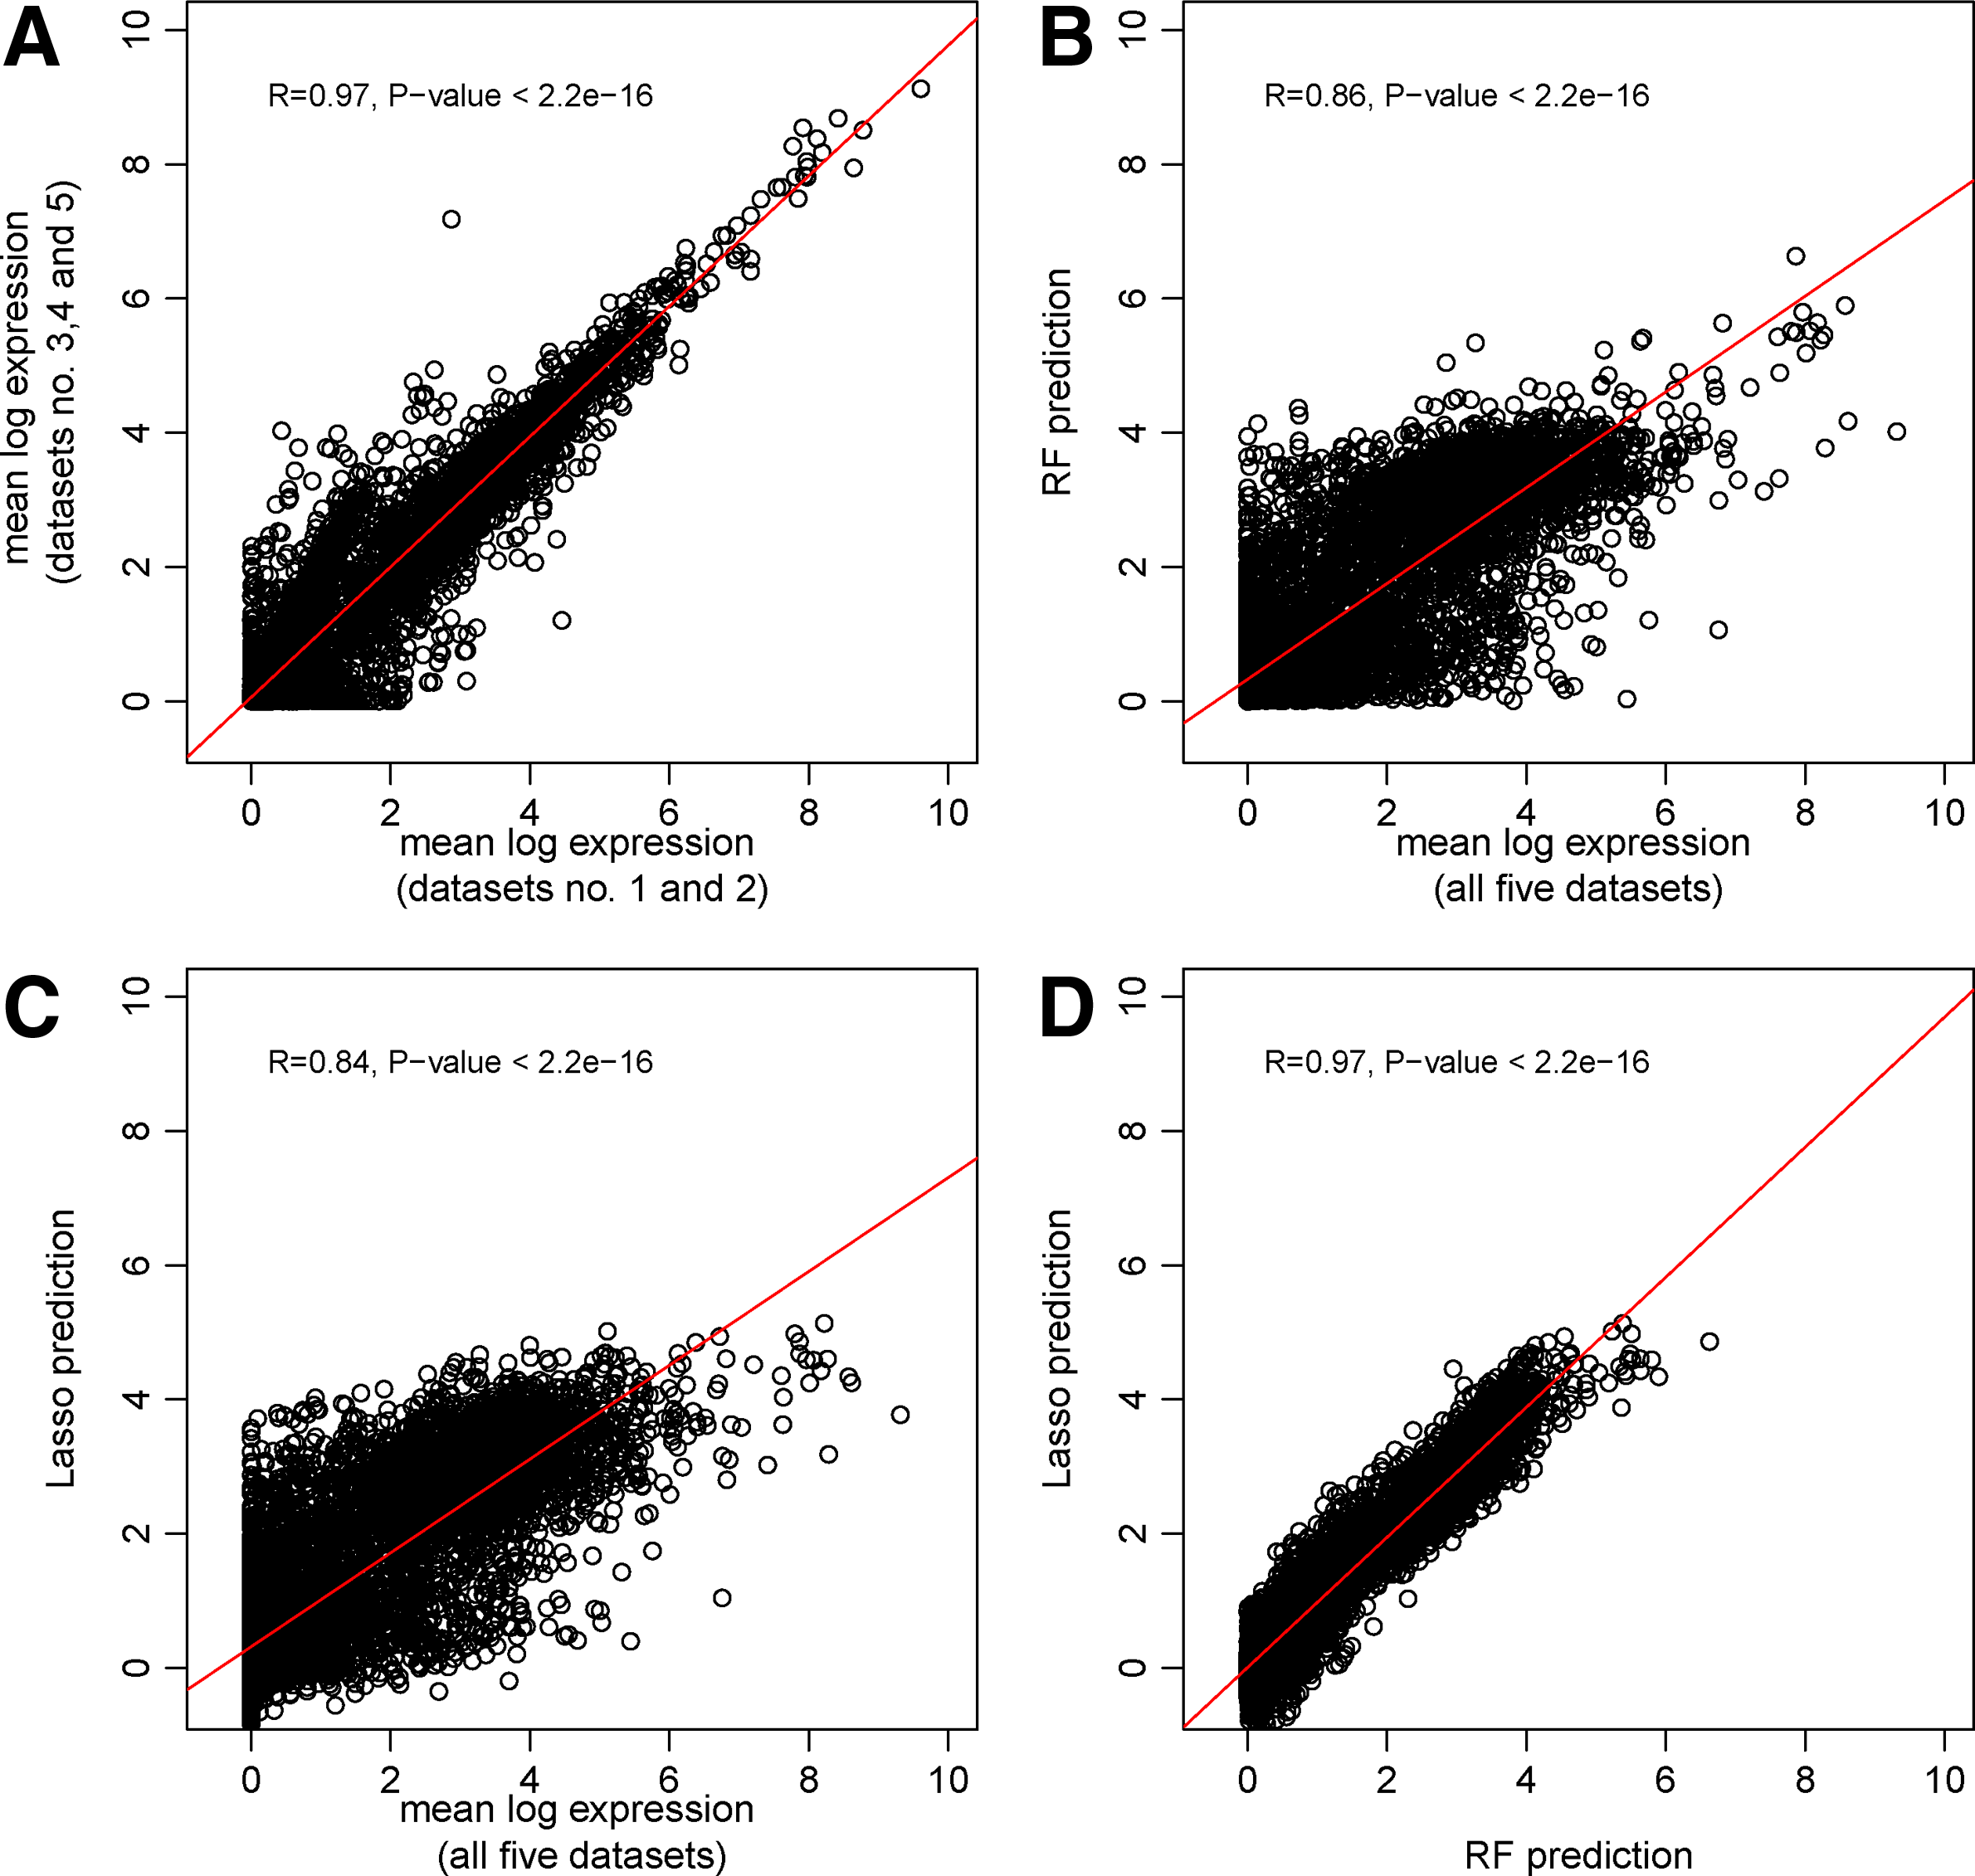
The variance among log-transformed RNA-seq replicates is higher for lowly expressed genes then for highly expressed genes (Fig. 2A). The RNA-seq datasets numbers 2, 3, and 4, which are replicates from modENCODE•983 submission (Table S.1) show the highest agreement (Fig. S.1) (Supplementary Material is available at www.liebertonline.com/cmb). The Lasso and the RF model both assign correctly to most genes a high or a low expression value (Fig. 2B, C). However, they seem to systematically underestimate the highly expressed genes (Fig. 2B, C). This bias may be due to their low number and therefore their relatively small influence on the training of the model. Another explanation is that they are upregulated by a mechanism that was not accounted for in the models (e.g., by chromatin associated factors which were not profiled). Although the Lasso and RF models are conceptually very different, there is high agreement (Pearson correlation of 0.97) between them (Fig. 2D). This observation suggests missing explanatory features rather than model shortcomings to explain the remaining variance.
(
In order to explore the effect of genes with a high variance on the regression performance, we removed all 847 genes with an empirical variance greater than 0.5. This modification led to an increase of the 10-fold cross-validated R2 values from 0.7 to 0.74 for the Lasso-based and from 0.73 to 0.78 for the RF-based predictions. As these changes constitute only minor improvements in performance, we conclude that the heteroscedasticity of the response variable has no significant negative effect on the employed regression models.
2.2. Interaction terms improve prediction accuracy
Transcriptional regulators are thought to act in concert to control gene expression levels (Weake and Workman, 2010; Lemon and Tjian, 2000). Therefore, we investigated interaction terms in our predictive models to identify functional interactions among the investigated proteins. One possible way to identify feature interactions is to consider all possible interactions of a specified order and then perform variable selection on this set of candidate interactions. Following this approach, we computed first-order and second-order multiplicative interaction terms and added them to the design matrix of the linear regression model.
We then computed Lasso models containing first-order interaction terms and subsequently also included second-order interaction terms. The 50-fold cross-validated mean squared error drops from 0.711 for the model with single features only to 0.636 (R2 = 0.73) for the model with single features plus pairwise interactions (p-value = 0.012, one-sided Wilcoxon rank sum test). The prediction performance of the Lasso models did not increase further (mean squared error of 0.638) after adding second-order interaction terms (Fig. S.2) (Supplementary Material is available at www.liebertonline.com/cmb). Thus we restricted the analysis to single features and pairs of features.
Lasso-regularized regression models perform an implicit variable selection by forcing most coefficients to be zero. Stability selection (Meinshausen and Bühlmann, 2010) can be used to assess the robustness of this selection. It was originally formulated for the p ≫ n case, where the number of predictor variables (p) is much larger than the number of samples (n). However, here we have about 15 times fewer predictors than samples, namely 561 single and paired features and 9415 genes. Most of the paired features will not exhibit a functional interaction in the context of transcriptional regulation, hence we can reduce the number of predictors. Direct application of Stability selection is not possible in the p < n regime. Therefore, we extended the Stability selection method to the p < n case (see Methods section). The result is a ranking of the predictor variables according to their stability, which is quantified by Boostrap-Lasso scores.
Random Forests can also be used to score the importance of covariates and interactions between them. We analyzed the trained RF, where the mean over the five RNA-seq datasets was used as response, and compared the RF edge enrichment scores (see Methods section) to the Boostrap-Lasso stability scores. For the top ranked features, there is a good agreement between the two methods (Fig. 3A). The ratio of the number of overlapping features versus rank cut-off declines from 0.8 to 0.4 around rank 40. Stable features (top 35) showed unambiguous tendencies in their sign of the coefficients in the Lasso models (Fig. 4). Therefore we classified them as predictors for the active (positive) and the repressed (negative) transcription state.
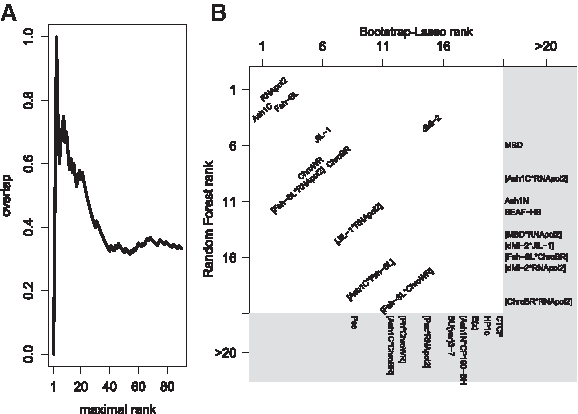
Agreements of feature ranking by Lasso and Random Forest. (
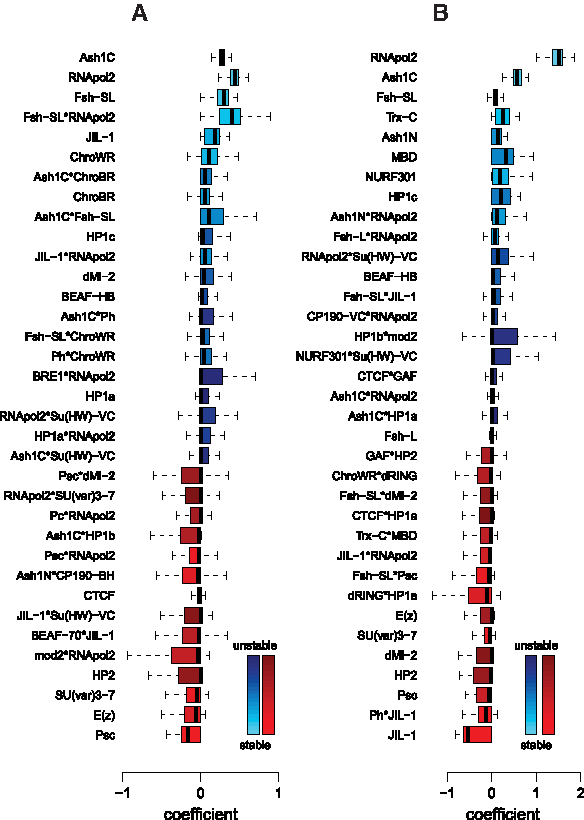
Boxplot of Lasso coefficients of top 35 ranked features. Outliers are omitted. The stability scores are color-coded. The list is sorted by descending z-score of the coefficients, i.e., highly activating features can be found at the top (blue), and highly repressive features can be found at the bottom of the list (red). (
Features with high RF enrichment scores tend to be more correlated to each other than features with high Boostrap-Lasso scores (Fig. S.3). (Supplementary Material is available at www.liebertonline.com/cmb). This suggests that the Boostrap-Lasso approach may capture functional or positional complementarity, while the RF score computation favors high marginal association.
Both methods agree on RNApol2, and the TrxG proteins Ash1 and Fsh-SL being most predictive features (Fig. 3B). Additionally, JIL-1, a histone H3S10 kinase, the chromatin remodeler dMi-2, and Chromator are selected by both models (Fig. 3). The Boostrap-Lasso model assigns positive coefficients to these proteins suggesting an activating function, which is in a agreement with recent studies (Jin et al., 1999; Rath et al., 2006; Regnard et al., 2011; Murawska et al., 2008). It also supports previous data for dMi-2 being linked with gene activation, although it has been initially found as a subunit of repressive complexes (Bowen et al., 2004; Kunert et al., 2009; Murawska et al., 2008). Important interaction terms include Fsh-SL*RNApol2, Ash1C*Fsh-SL, and JIL-1*RNApol2, all of which show activating functions. It seems that RF favors activating features for the modeling of transcription, whereas Boostrap-Lasso takes both, repressive and activating, features into account in a more balanced way. Importantly, Boostrap-Lasso reliably assigns repressory functions to the well-characterized PcG proteins Psc and E(z) as well as to the heterochromatin protein Su(var)3-7. In this respect it is interesting to see that HP1a and HP1c show an activating function as well as their interaction pair HP1a*RNApol2 (Fig. 4A). In contrast, Pc*RNApol2 and Psc*RNApol2 have been assigned a negative coefficient which is in agreement with the recent finding that PcG proteins are enriched at promoters associated with paused polymerase (Enderle et al., 2011).
2.3. Prediction of promoter associated short RNAs
Next, we focused on the prediction of promoter-proximal pausing and trained Lasso and RF models with normalized shortRNA counts as the dependent variable. The R2 values were 0.75 and 0.77 for Lasso and RF, respectively. Stability analysis on the Lasso models, including first-order interaction terms, was also performed for the shortRNA-seq dataset. As expected, RNApol2 is even more predictive here than for the RNA-seq dataset (Fig. 4B). Although the amount of short RNAs is a poor predictor of gene expression (Nechaev et al., 2010) (Fig. S.4), proteins predictive for transcriptional activity, such as Ash1 and Fsh, have also a significant impact on promoter-proximal pausing (Fig. 4B) (Supplementary Material is available at www.liebertonline.com/cmb). In addition, Trx, which was not predictive of transcriptional activity, is highly predictive for the presence of promoter associated short RNAs. Remarkably, JIL-1 changes the sign form expression to pausing prediction. It is the most stable predictor for “repressed” pausing. This result indicates that JIL-1 seems to be a critical factor for switching RNApol2 to the productive elongation phase of transcription.
3. Discussion
We have shown that ChIP signals of non-histone proteins in gene promoter regions are predictive of gene expression levels and the presence of promoter-proximal short RNAs, which are indicative for paused RNApol2. Of note, we have omitted chromatin maps of histone modifications, which may have a dominant effect on the regression models and therefore may suppress the effect of other proteins. Although the described method can be used to integrate any kinds of datasets comprising global chromatin maps and expression profiles, we were primarily interested in the predictive power of non-histone chromatin proteins which establish specific gene expression patterns in the first place.
Global chromatin profiling has just started recently, and we can expect a rapid increase in the amount of high-quality chromatin maps in many different model systems like Drosophila S2 or Kc tissue culture cells, mouse embryonic stem cells, and defined human blood cell lines, to name a few. Thus, it is crucial to devise computational methods, which enable the integration of multiple datasets for the purpose of modeling and predicting functional states. With increasing numbers of datasets, the power of these approaches will gain immensely, the accuracy of prediction will increase, and the underlying molecular mechanisms can be modeled more precisely.
With a limited dataset—albeit comprehensive compared to other model systems—we were able to correctly predict the expression state of genes in Drosophila S2 tissue culture cells. Both predictive models systematically underestimated the level of highly expressed genes, which most likely will improve in the future if we can include chromatin profiles of further hitherto unmapped proteins.
We used Stability selection on L1-penalized (Lasso) linear regression models to identify combinatorial chromatin features that are predictive of transcription or pausing. We have interpreted the selected features in terms of their stability-based rank order, but an absolute measure of significance remains to be developed. Toward this end, in their original work on Stability selection, Meinshausen and Bühlmann (2010) presented a theoretical approach to control the false discovery rate. However, the upper bound on the number of false positives they found is neither sharp nor directly applicable here.
The performance levels we reached with our regression models are comparable to those observed in a recent analysis in Drosophila, which was solely based on histone modifications (Roy et al., 2010). In an analysis of C. elegans chromatin features, most of which were ChIPs of different histone modifications, the performance of the trained Support Vector Machines was similar to the models described here (Cheng et al., 2011). The feature selection approach we have presented allows us to identify candidate features and feature interaction pairs, which do not necessarily show a high marginal association to gene expression but seem to have a clear role in the context of other features.
The interaction terms we used were formulated as multiplicative interactions. However, Bonneau et al. (2006) found that interactions defined by the minimum of the two participating feature scores work better then multiplicative interactions for inferring gene regulatory networks based on ODE models. We also fitted the L1-regularized linear model using the minimum score interaction term definition. The model performance was comparable to the multiplicative interaction terms with an R2 of 0.73.
ChroBR and ChroWR are chromatin maps generated with two different antibodies recognizing the same protein termed Chromator. As expected, both features are highly correlated (Pearson correlation > 0.99) and are usually not both selected in a specific Lasso run at a specific level of regularization. This behavior does not affect prediction; however, for feature selection, one wants to identify either both features or none. Here, summing over many bootstrap Lasso sequences enabled us to identify both features as important predictor variables. Bootstrap-Lasso also assigns positive coefficients to these features, which is in agreement with the localization of Chromator in active interbands of polytene chromosomes in Drosophila salivary glands (Rath et al., 2006).
Transcriptional activity and promoter-proximal pausing is highly dependent on the amount of RNApol2 present at a specific gene. The inclusion of RNApol2 ChIP data into the regression models could therefore have a strong influence on these performance of these models. In order to assess this possibility, we removed RNApol2 from the set of predictors and trained the models again. This computational experiment resulted in a drop of the performance (R2) of both methods, Lasso-regularized linear model and Random Forest, of 3% for transcriptional activity and 7% for promoter-proximal pausing. The small performance decrease shows that the transcriptional level of a gene can also be estimated well without using data on RNApol2 binding. On the other hand, consideration of the RNApol2 ChIP data enables the identification of interesting interaction pairs, which may address important biological functions. In the Boostrap-Lasso approach, we assigned negative coefficients to the Pc*RNApol2 and Psc*RNApol2 interaction pairs which supports the recent findings that the PcG complex PRC1 locates to promoters associated with paused polymerase (Enderle et al., 2011). However, these interaction pairs are not significant enough for the direct prediction of short RNAs and are overruled by other features.
In addition to Psc and Pc, the PcG proteins Ph and Sce/dRing constitute the core of PRC1. Whereas all PRC1 subunits are essential for proper repression of HOX genes in Drosophila, only Ph shows a robust tumor suppressor function (Oktaba et al., 2008; Classen et al., 2009; Martinez et al., 2009). The molecular reason for this phenomenon is still unknown. Here we have found that Ph also behaves differently in the Boostrap-Lasso model in which Ph appears as activating feature in interaction pairs with Ash1C and ChroWR, whereas Pc and Psc were assigned a negative coefficient as expected. This finding will stimulate further experiments to check the functional interaction of Ph with Ash1 and ChroWR in the process of de-regulated cell proliferation.
The S2 cell dataset also included chromatin maps of three different TrxG proteins: Ash1, Fsh, and Trx-C. This group of proteins is known to counteract PcG proteins by maintaining the active state of genes during many cell divisions in the process of development. Trx is a large protein which undergoes proteolytic cleavage resulting in a heterodimer that comprise the N- (Trx-N) and the C-terminal (Trx-C) part of Trx. Recently, it was shown that Trx-C is present at all PRC1 bound genes that are inactive or show a moderate activity level, and is additionally enriched at active genes (Enderle et al., 2011). Both regression models exclude Trx-C as it appears not necessary for predicting gene expression, whereas it is highly predictive for short RNAs, supporting previous data (Enderle et al., 2011). In contrast, Ash1 and Fsh exhibit high predictive power in both models with assigned activating function by Boostrap-Lasso. Both proteins are represented by two different antibodies, which recognize different parts of Ash1 and partially discriminate different isoforms in Fsh, respectively. Obviously, the antibodies generated different chromatin maps since they do not cluster together like ChroWR and ChroBR do. Ash1-C and Fsh-SL also form a highly predictive interaction pair. Details of the Ash1 and Fsh data and the functional impact of their interaction on gene activity will be presented elsewhere (Kockmann et al., unpublished results).
With JIL-1 and d-Mi2, there are two additional proteins highly predictive for the active state of gene expression. JIL-1 is a histone H3S10 kinase that is required for maintaining chromatin structure by counteracting heterochromatin (Lerach et al., 2006; Zhang et al., 2006; Bao et al., 2007). It has been reported that JIL-1 co-localizes with elongating RNApol2 and is enriched towards the 3′ end of genes together with H3K36me3 and K16-acetylated H4 (Regnard et al., 2011). In our models, the JIL-1 signal in the promoter proximal part seems to be powerful enough to connect it properly to active transcription. Furthermore, the behavior of JIL-1 in our model for promoter-proximal short RNA prediction indicates a role of JIL-1 in triggering the start of RNApol2 into the productive elongation phase. Accordingly, it has been reported for the mammalian kinase PIM1 to phosphorylate H3S10, which leads to H4K16 acetylation and the recruitment of BRD4, a double bromo domain protein that is homologous to Drosophila Fsh (Zippo et al., 2009). This series of events promotes productive elongation by stimulating the release of promoter-proximal RNApol2 (Zippo et al., 2009).
The result for d-Mi2 seems to be more surprising in the first place. The d-Mi2 protein is an ATPase subunit of repressive chromatin remodeling complexes (Bowen et al., 2004; Kunert et al., 2009). Nevertheless, d-Mi2 co-immunostains with active forms of RNApol2 on polytene chromosomes of Drosophila salivary glands (Murawska et al., 2008). The reason for this behavior has not yet been uncovered, but our modeling approach confirms this finding remarkably well. Similarly, Boostrap-Lasso identified HP1 proteins as being predictive for active transcription. Although HP1 has been initially identified as a defining feature for heterochromatin in Drosophila, several lines of evidence suggest a function of HP1 proteins in the activating part of transcription (Piacentini et al., 2003; 2009; Kwon et al., 2010). Again, our unbiased modeling approach of given chromatin profiles confirmed this function.
In summary, we have devised a reliable computational strategy that is based on the prediction of transcription states of long and TSS-associated short RNAs by an integrative analysis of chromatin profiles to uncover the functions and relationships of chromatin associated proteins. With available datasets for Drosophila S2 cells, we were able to identify many predictive features for transcription and promoter-proximal pausing of RNApol2, to pinpoint new directions for future experiments, and to support some controversial results, which have been previously reported by other approaches. The strength of applying two modeling methods, namely Lasso-regularized linear models and Random Forests, to the same dataset, is the increased chance to identify the most predictive features as those supported by both methods. Additionally, Boostrap-Lasso approach can predict whether a protein has a global activating or repressing effect on gene expression and promoter architecture, which together provides a powerful toolbox for integrating global maps of chromatin associated proteins and predicting their effect on gene regulation underlying development and disease.
4. Methods
4.1. Datasets
Transcript start site annotations were downloaded from ensembl biomart on November 30, 2010. These annotations are based on the BDGP version 5.13. The initial transcript set contained 23,054 transcripts starting from 18,453 different TSSs. Filtering out TSSs with overlapping non-identical 1kb windows centering at the TSSs resulted in 9,415 TSSs and 11,751 associated transcripts.
ChIP-chip datasets have been downloaded from the modENCODE data warehouse in the form of “.wig” files. These files contain normalized M-values in a 38 bp resolution of a single ChIP experiment for the whole genome. The identifiers or references of all datasets used can be found in Table S.1. (Supplementary Material is available at www.liebertonline.com/cmb).
4.2. Data preprocessing
ChIP-seq reads were quality filtered (FASTX Toolkit 0.0.13, http://hannonlab.cshl.edu/fastx_toolkit/index.html fastq_quality_filter, parameters -Q 33 -q 30 -p 75) and subsequently aligned with bowtie (default parameters) (Langmead et al., 2009) to the Flybase Drosophila melanogaster reference genome r5.22. For alignment file manipulation, Samtools were used (Li et al., 2009). The reads in the promoter regions were counted using the pysam library (wwwfgu.anat.ox.ac.uk/∼andreas/documentation/samtools/api.html). The natural logarithm of the difference of the ChIP-seq read counts and the Input read counts (M-value) has been used as feature enrichment score for the promoter regions. The average M-value across the promoter regions was used as feature enrichment score for the microarray datasets.
Replicates were merged by using the mean value of the read counts for the ChIP-seq data and the averaged M-values for ChIP-chip data in the promoter regions. Normalization of ChIP-seq datasets was done such that the counts in the promoter regions which were not bound by the given protein and the counts of the Input dataset in the according regions were the same. Bound regions were called by a binomial likelihood ratio test if the fraction of reads mapping to a given promoter region in the ChIP experiment exceeded that in the input. The fraction of ChIP reads in a promoter region was computed relative to the overall number of unbound reads, which was estimated by a maximum likelihood approach.
The RNA-seq reads were quality-filtered with the same criteria as the ChIP-seq reads and subsequently aligned to the reference genome (r5.22) using tophat (Trapnell et al., 2009). Cufflinks was used to estimate expression values on the transcript level (Trapnell et al., 2010). Expression values (FPKM) of all transcripts which started at a TSS of interest were summed and the natural logarithm of the FPKM value plus 1 was used as expression level for the associated TSS.
The 5′-shortRNA-seq reads were also quality-filtered with the same criteria and subsequently aligned to the reference genome with bowtie (default parameters) (Langmead et al., 2009). The reads mapping to the promoter regions were counted and the natural logarithm of the read counts plus 1 was used as respective shortRNA value.
4.3. Supervised models for expression prediction
R was used for computing models and producing plots (R Development Core Team, 2011). Random Forests were trained using the randomForest package (Liaw and Wiener, 2002). Random Forest functions were used with default parameters if not stated otherwise. For L1-regularized linear regression, Lasso sequences were computed using the glmnet package (Friedman et al., 2010). The reported R2 values are Lave/Efron pseudo-R2 values (Lave, 1970; Efron, 1978).
The regularization parameter λ for the Lasso-regularized linear regression model was chosen at the minimum 10-fold cross-validation score. For computing the 10-fold cross-validation error, we randomly grouped all genes into ten disjoint sets. Then, 10 models were trained on nine gene sets and the error made in predicting the remaining set was recorded. The average of the 10 errors was used as 10-fold cross-validation score.
4.4. Feature selection based on Lasso and Bootstrapping
Our feature selection approach is similar to Stability selection (Meinshausen and Bühlmann, 2010). In Stability selection, variable importance is scored by the maximum of the selection probabilities of the variable over the sequence of the regularization parameter, here denoted as the λ-sequence. The selection probabilities (how often is a coefficient non-zero) are computed on the boostrap/subsampling samples. This method was developed for the high-dimensional case where p≫n. Meinshausen and Bühlmann (2010) vary the regularization parameter “within reason” which, for example, in the case of Lasso models, was suggested to be from the empty model to the unregularized model (i.e., the basis pursuit solution).
In the case where the number of predictors is smaller than the number of samples (as for our dataset), the unregularized model, where λ is almost zero, is the full model where almost no coefficient is zero. As there is no obvious choice for the lower limit of the region in which the regularization parameter λ should be varied in this case and the unregularized full model would dominate the maxima of the selection probabilities, we defined a different measure of feature importance, namely the normalized sum over the counts of non-zero parameters over the whole λ-sequence and all bootstrap samples.
Using the predictor matrix extended by first-order interaction terms, we computed Lasso sequences on bootstrap samples of the full set of genes and recorded the non-zero parameters for the whole λ-sequence. The λ-sequence was computed for the original dataset such that we start from the empty model (corresponding to a λ value of 1.133 for our data) and progress to a λ value of 0.0001, an almost full model, after 100 iterations. The ratio of successive λ values is constant, in our case 0.91. This λ-sequence was subsequently used for all bootstrap samples. The Lasso sequences were computed on 100 bootstrap samples and the number of non-zero coefficients was counted for each of the single features and the interaction terms. In order to increase robustness, we used the five different RNA-seq datasets separately for the response variable Y . Twenty sequences were computed for each of the five datasets. For each feature, the number of non-zero coefficients was summed and subsequently normalized. The Boostrap-Lasso stability scores concentrate around 0.3 (Fig. S.5) (Supplementary Material is available at www.liebertonline.com/cmb). There was no shoulder or other apparent cut-off value.
4.5. Random Forest structure analysis
Tree-based learners, which RF is an ensemble of, have an intrinsic but implicit way of modeling interactions via the recursive partitioning paths; however, there is no standard way of mining them. A simple way of extracting interactions is to look for edges (successive splits) which have high frequencies and report the features used for the splits.
We define the edge enrichment as the ratio of the number of specific successive splits and the total number of both—parent and child—node counts. We computed the edge enrichment values for all interaction terms and the node enrichment for all single features and used these enrichment values for jointly ranking the single features and the pairwise interactions. The paths were analyzed only up to a node depth of four (Fig. S.6) (Supplementary Material is available at www.liebertonline.com/cmb). Deeper nodes often have very few samples assigned, therefore the specific splits are not very informative. Also, the number of nodes grows exponentially with the node depth, therefore, these low-informative splits would dominate the analysis.
4.6. Availability
Python and R code is available from the authors upon request.
Footnotes
Acknowledgments
We thank Ina Nissen for sample processing for Illumina sequencing and Manuel Kohler for data processing. Illumina sequencing was carried out at the Quantitative Genomics Facility, D-BSSE, ETH Zurich. We would like to thank Moritz Gerstung and Peter Bühlmann for insightful discussions. Project-related research in the laboratory of R.P. was supported by grants from the EU-NoE Epigenesys and the ETH Zurich.
Author Contributions
T.S., R.P., C.B., and N.B. designed the study. T.S. conducted the computational analysis. T.K. produced the Ash1C, Ash1N, Fsh-L, and Fsh-SL datasets. T.S., C.B., and N.B. analyzed and interpreted the data. T.S., R.P., C.B., and N.B. wrote the manuscript.
Disclosure Statement
No competing financial interests exist.
References
Supplementary Material
Please find the following supplemental material available below.
For Open Access articles published under a Creative Commons License, all supplemental material carries the same license as the article it is associated with.
For non-Open Access articles published, all supplemental material carries a non-exclusive license, and permission requests for re-use of supplemental material or any part of supplemental material shall be sent directly to the copyright owner as specified in the copyright notice associated with the article.