
Abstract
Abstract
Metabolic engineering (ME) efforts have been recently boosted by the increase in the number of annotated genomes and by the development of several genome-scale metabolic models for microbes of interest in industrial biotechnology. Based on these efforts, strain optimization methods have been proposed to reach the best set of genetic changes to apply to selected host microbes, in order to create strains that are able to overproduce metabolites of industrial interest. Previous work in strain optimization has been mostly based in finding sets of gene (or reaction) deletions that lead to desired phenotypes in computational simulations. In this work, we focus on enlarging the set of possible genetic changes, considering gene over and underexpression. A gene is considered under (over) expressed if its expression value is constrained to be significantly lower (higher) than the one in the wild-type strain, used as a reference. A method is proposed to propagate relative gene expression values to flux constraints over related reactions, making use of the available transcriptional/translational information. The algorithms chosen for the optimization tasks are metaheuristics such as Evolutionary Algorithms (EA) and Simulated Annealing (SA), based on previous successful work on gene knockout optimization. These methods were modified appropriately to accommodate the novel optimization tasks and were applied to study the optimization of succinic and lactic acid production using Escherichia coli as the host. The results are compared with previous ones obtained in gene knockout optimization, thus showing the usefulness of the approach. The methods proposed in this work were implemented in a novel plug-in for OptFlux, an open-source software framework for ME. Supplementary Material is available at www.liebertonline.com/cmb.
1. Introduction
Several GSMs of different microorganisms are currently available, such as Saccharomyces cerevisiae (Forster et al., 2003) and Escherichia coli (Reed, 2003). These include information on the set of reactions of the microbe's metabolism (metabolites consumed/produced, stoichiometry, reversibility) and transcriptional/translational information (in the form of gene-reaction associations).
Since the dynamic modeling of metabolic systems requires detailed kinetic information commonly not available, GSMs are still the main tools used for the simulation of the microbe's phenotype, under different environmental and/or genetic conditions. Typically, these methods make the assumption that the cell is in a pseudo-steady state, enabling the definition of constraints over the values of reaction fluxes (based on stoichiometry and reversibility) that allow to narrow the space of allowed flux distributions.
The most popular phenotype simulation method is flux balance analysis (FBA), which defines a particular flux to be optimized using linear programming. Typically, an artificial reaction for biomass production is added to the model and taken as the objective function (Ibarra et al., 2002). More recently, the parsimonious enzyme usage FBA (pFBA) method has been proposed, working by selecting from the space of optimal FBA solutions the one that minimizes the sum of all the fluxes. This has been shown to improve phenotype predictions (Lewis et al., 2010).
Other approaches, such as the ROOM algorithm (Shlomi et al., 2005), have also been proposed for mutant simulation, where the objective function is the minimization of the differences between mutant and wild-type flux distributions.
Using one of these simulation methods, it is possible to predict the behavior of a microorganism (given by the flux values for all reactions in the model), in its wild-type or mutant forms, under distinct environmental conditions (e.g., media conditions).
Thus, a bi-level optimization problem can be formulated, adding a layer that searches for the best mutant that can be obtained by defining a set of possible genetic changes. The overall conceptual framework is depicted in Figure 1. Early approaches for strain optimization have focused on searching for a set of reactions to delete from the model. This is the case with OptKnock (Burgard et al., 2003), which follows a mixed integer linear programming (MILP) formulation. This method is based on a bi-level structure, containing an inner optimization problem that aims at the maximization of biomass (as in FBA) and an outer problem seeking to maximize the product yield, by blocking fluxes of a limited number of reactions.
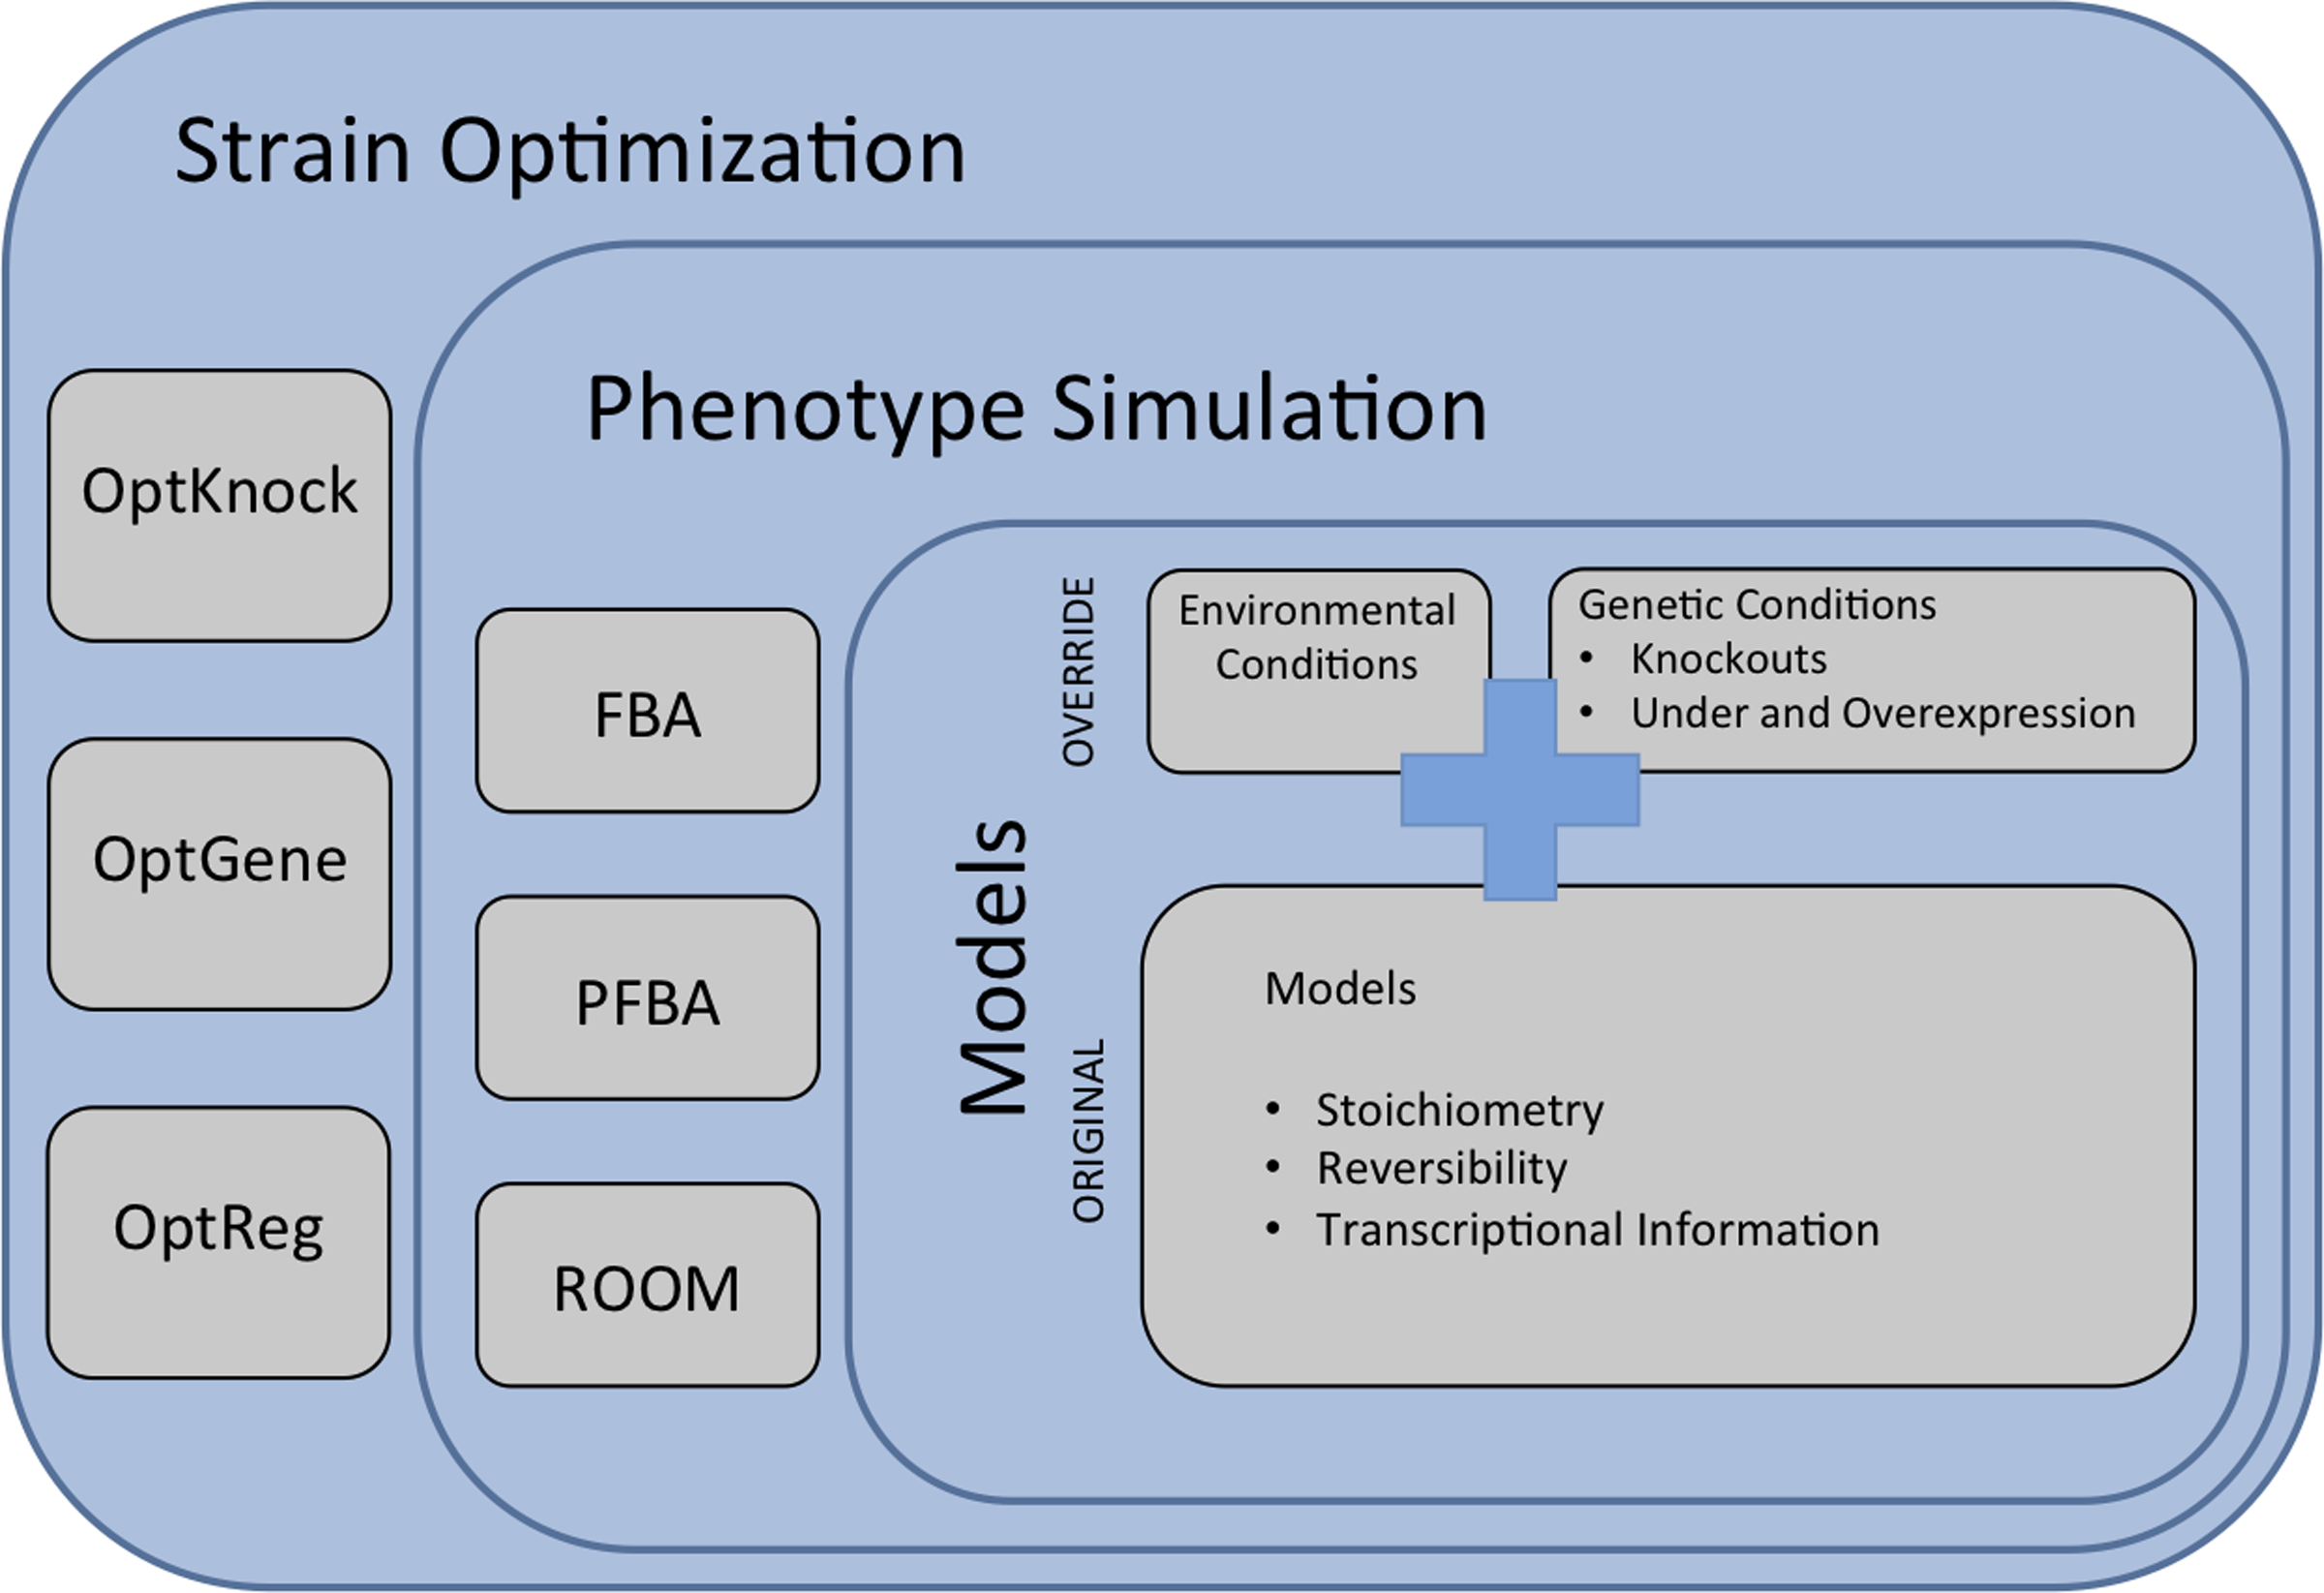
Conceptual framework of the strain optimization methods showing the three main layers in a metabolic engineering (ME) framework: metabolic models, phenotype simulation methods, and strain optimization algorithms. Examples are provided in each layer.
On the other hand, OptGene (Patil et al., 2005) resorts to the use of an evolutionary algorithm (EA) as the optimization method. EAs are capable of providing near optimal solutions for larger problems in a reasonable amount of time and allow nonlinear objective functions, thus providing an advantage over OptKnock. Recent work by the authors proposed new optimization methods using simulated annealing (SA) and developing a set-based solution representation scheme that allows variable sized solutions, thus enabling the automatic discovery of the best number of knockouts (Rocha et al., 2008).
Another recent improvement was the use of the transcriptional/translational information associated to some GSMs, which states how enzymes are encoded by their genes, allowing phenotype simulation to predict flux distributions for gene knockout mutants, instead of reaction deletions, as it was done previously. Adapting strain optimization methods to work with this information allowed to reach solutions that can be more easily implemented in the lab (Vilaça et al., 2010).
Although these previous approaches obtained good quality results, one of their limitations is the fact that genetic changes are restricted to gene deletions. An alternative way to optimize the production of metabolites is to regulate the expression of genes to a rate higher or lower levels when compared to the wild-type values.
OptReg (Pharkya and Maranas, 2006) is a first attempt to address this task, working directly with reaction over/underexpression. A reaction is considered under (or over) regulated in a mutant if it takes a flux value considerably lower (or higher) when compared with the wild-type steady-state fluxes. OptKnock is the basis for OptReg formulation, and therefore, the limitations of this approach are similar to the ones pointed out for this method. Also, both methods work with reactions, disregarding available transcriptional/translational information and thus generating many biologically unfeasible solutions. Given the advantages discussed above, the use of metaheuristics for strain optimization seems a fruitful path.
In this work, we focus on the development of EA and SA to select appropriate targets for genetic changes based on gene over/underexpression. This aim encompasses three major technological objectives: (i) to develop phenotype simulation methods for mutants with gene over/underexpression; (ii) to modify EA and SA to accommodate these optimization tasks; and (iii) to implement the previous methods within the OptFlux ME platform. The proposed methods are applied to study the optimization of succinic and lactic acid production using Escherichia coli as the host. The results are compared with the ones obtained with gene knockout optimization.
2. Methods
2.1. Phenotype simulation methods
FBA reduces the mass balances of internal metabolites to a set of linear equations. For M metabolites and N reactions, we have:
where vj corresponds to the flux of reaction j, and Sij stands for stoichiometric coefficient of metabolite i in reaction j. These constraints specify that for all internal metabolites the sum of all productions and consumptions is null. Thermodynamic and capacity constraints can be added as inequalities:
For most metabolic networks, this results in an underdetermined system.
The FBA method makes use of linear programming to determine the optimal flux distributions using an objective function:
This function to be maximized/minimized can correspond to different objectives, being the most commonly used the maximization of the biomass formation rate (Ibarra et al., 2002).
In this work, we have adopted the pFBA method for phenotype simulation. This method works according to the following stages: (i) the FBA formulation above is run, and an optimal biomass flux value is obtained; (ii) a constraint stating that the biomass flux value has to be equal to this optimal value is added to the constraint set; and (iii) a new optimization problem is created where the objective function is the minimization of the sum of all fluxes and it is solved. The fluxes obtained in this last step are the final result of the method.
2.2. Simulation with over/underexpressed genes
Here, a method for the simulation of mutants, in which a set of genes is over or underexpressed is presented. The input is a set of “mutated” genes, each with an associated expression level. These are relative values that relate to a set of reference values, typically from the wild-type strain. For each gene, if the expression value is smaller than 1, the gene is underexpressed (if it is zero, the gene is knocked out); otherwise, this represents gene overexpression.
The simulation is performed in two steps: (i) the gene expression levels are propagated to the reactions associated with them, using the transcriptional/translational information (gene-reaction rules), leading to constraints over reaction fluxes; (ii) these constraints are added to the pFBA formulation, and the linear programming optimization works as usual.
Figure 2 depicts the process of propagating gene expression values to reaction flux values. Since gene-reaction rules are given as Boolean expressions, a strategy was defined to convert Boolean operators to functions able to handle numerical expression values, as accurately as possible using the available transcriptional/translational information. In this work, AND operators are translated to the minimum between the two expression values, while OR operators are transformed to the mean. Typical examples of AND situations are the formation of protein complexes, where the expression of all the genes is necessary to produce the enzyme, and the gene for which the minimum number of copies are expressed will act as a bottleneck for the activity of the corresponding enzyme. On the other hand, typical examples of OR situations are genes encoding isoenzymes, where the genes involved work independently, and therefore, the different contributions regarding expression values should be averaged.
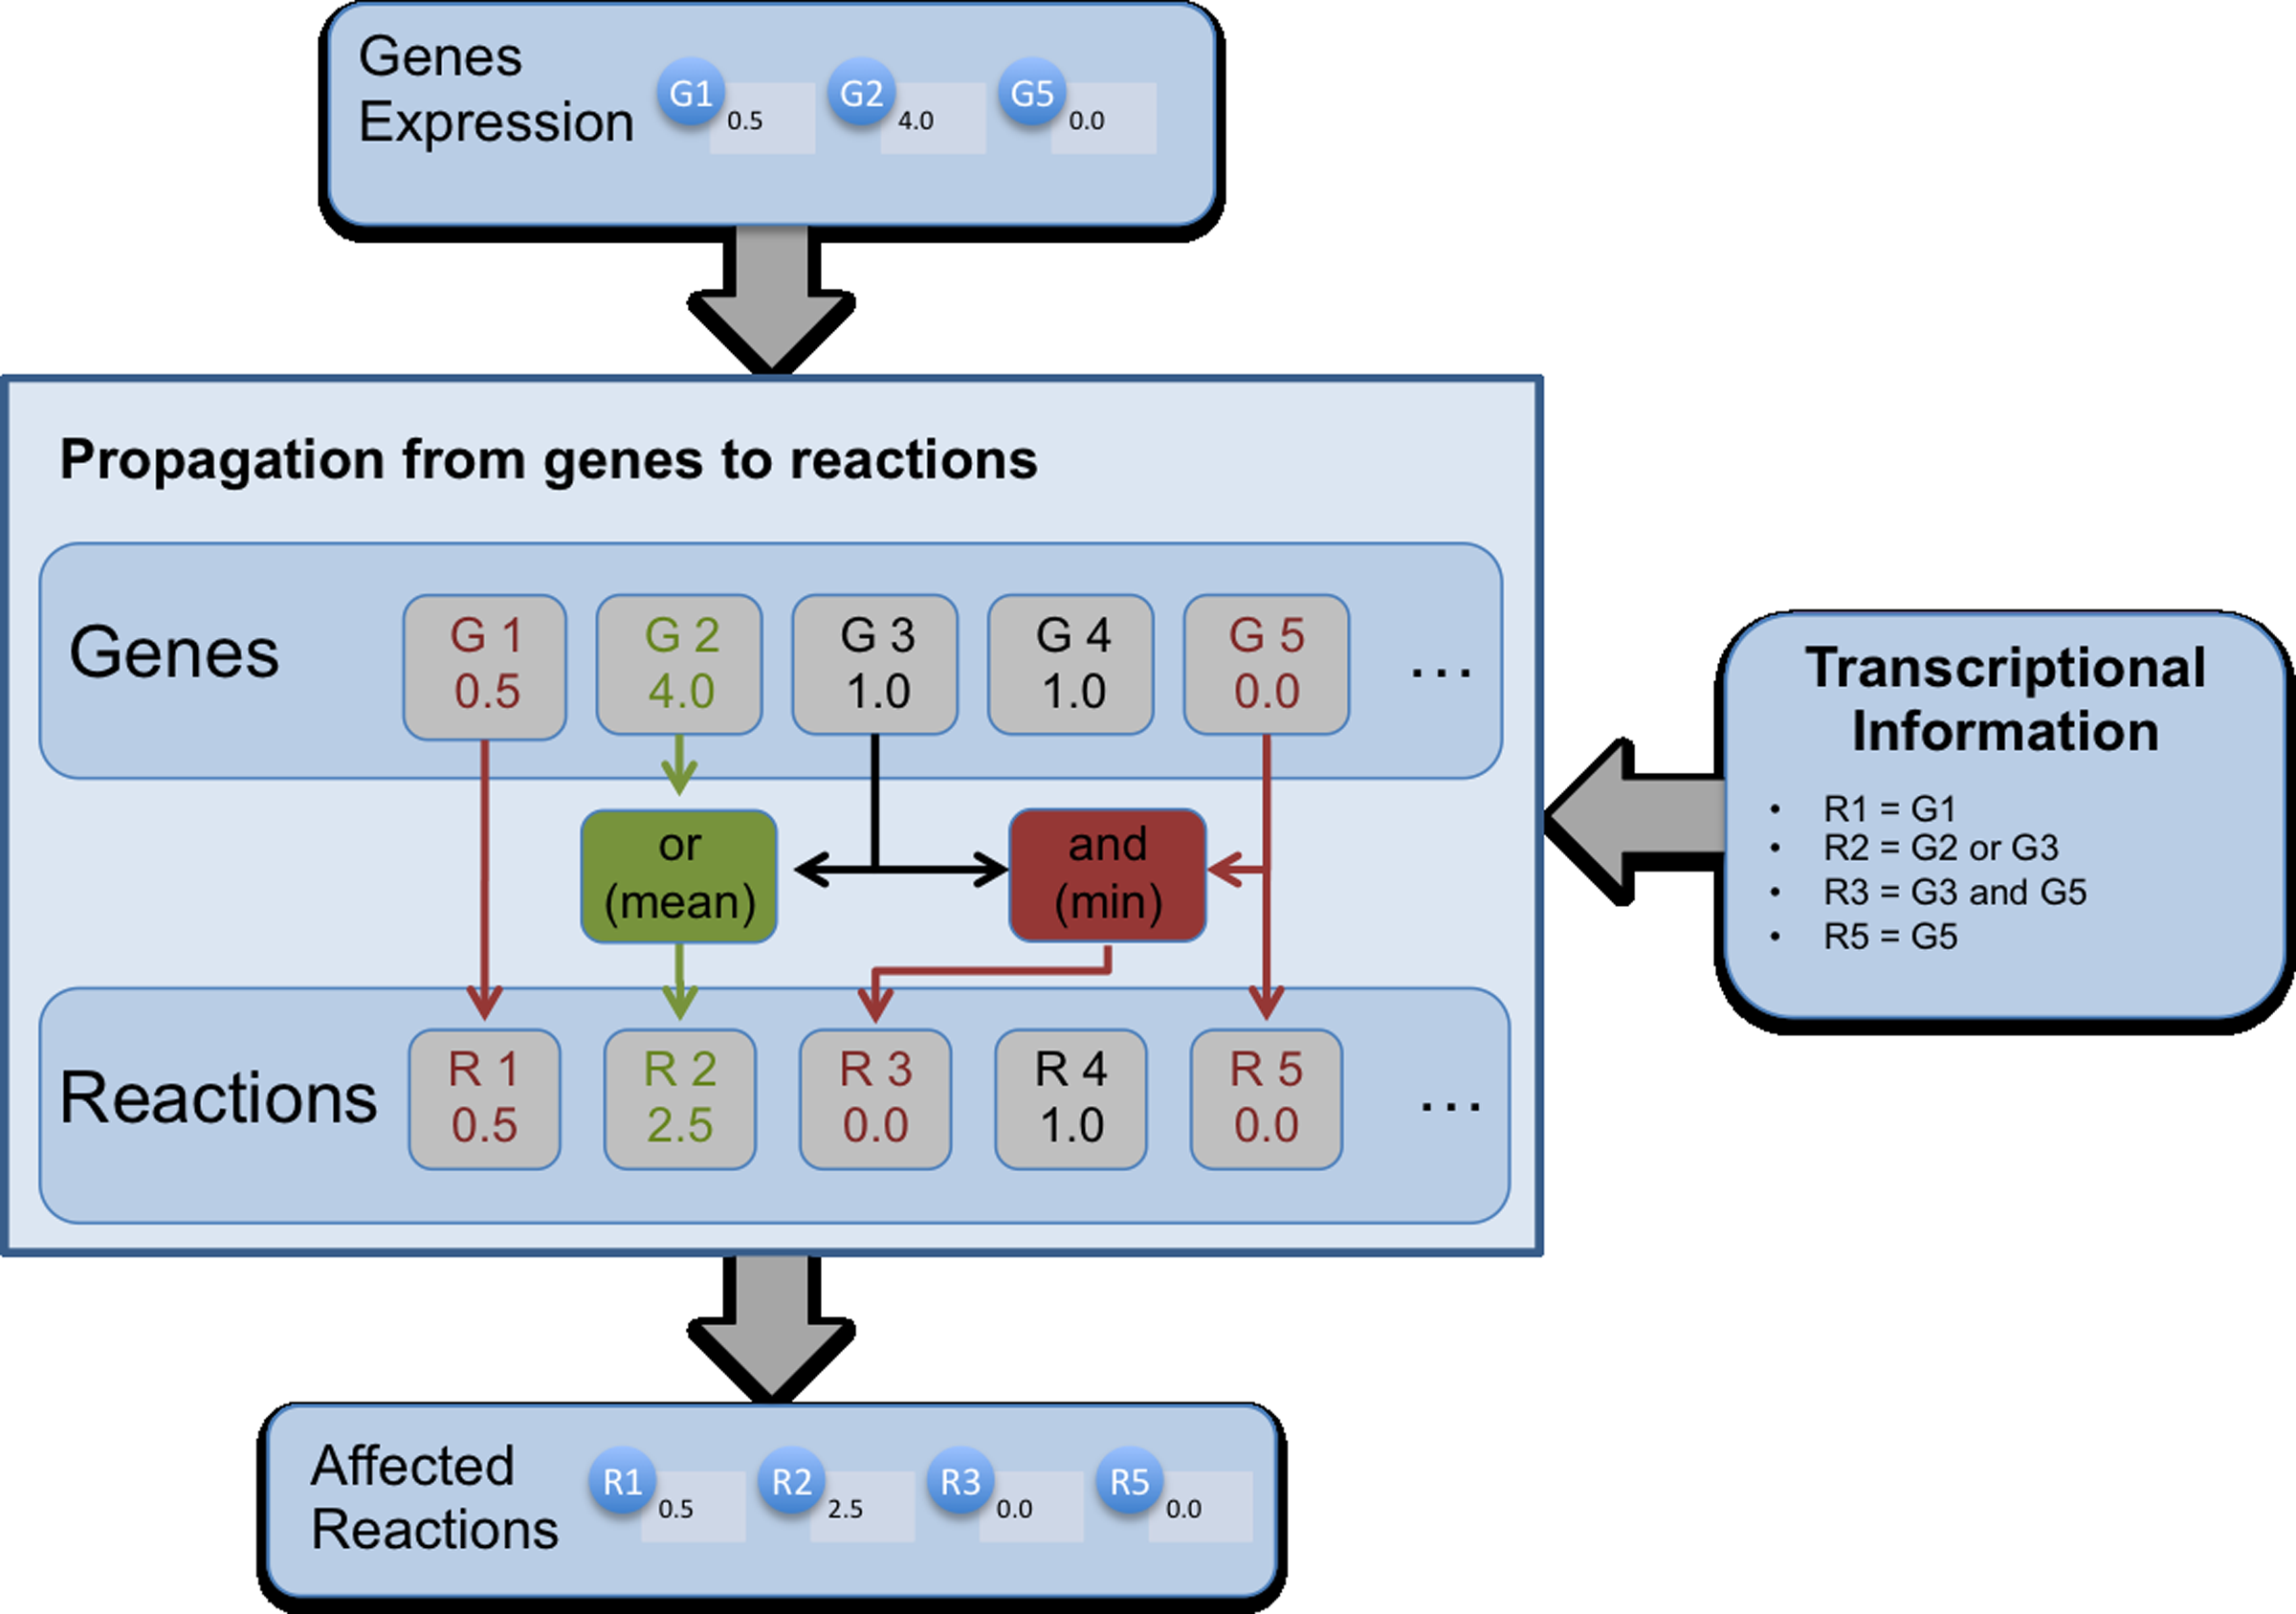
Illustration of the process followed when propagating gene expression values to constraints over reaction fluxes. The input of the process is the set of genes to be modified and their relative expression levels (in the example, G1, G2, and G5). The transcriptional information is taken from the gene-reaction rules from the model (in the right), being used to transform gene expression levels into reaction flux levels. Simple cases of one gene encoding one reaction are trivial, while AND and OR operators are interpreted as minimum and mean functions in the expression values. In the bottom, the affected reactions and their flux levels are the output of this process.
From the previous step, relative values are reached for each affected reaction that will be used to define constraints over their fluxes, by considering the reference flux distribution. In this work, this reference is obtained by running a pFBA simulation for the wild-type strain.
Figure 3 explains in detail the process of translating a relative value for a reaction to the constraints over its flux. A reaction will be overexpressed (underexpressed) constraining its flux to be significantly larger (lower) than the reference value.
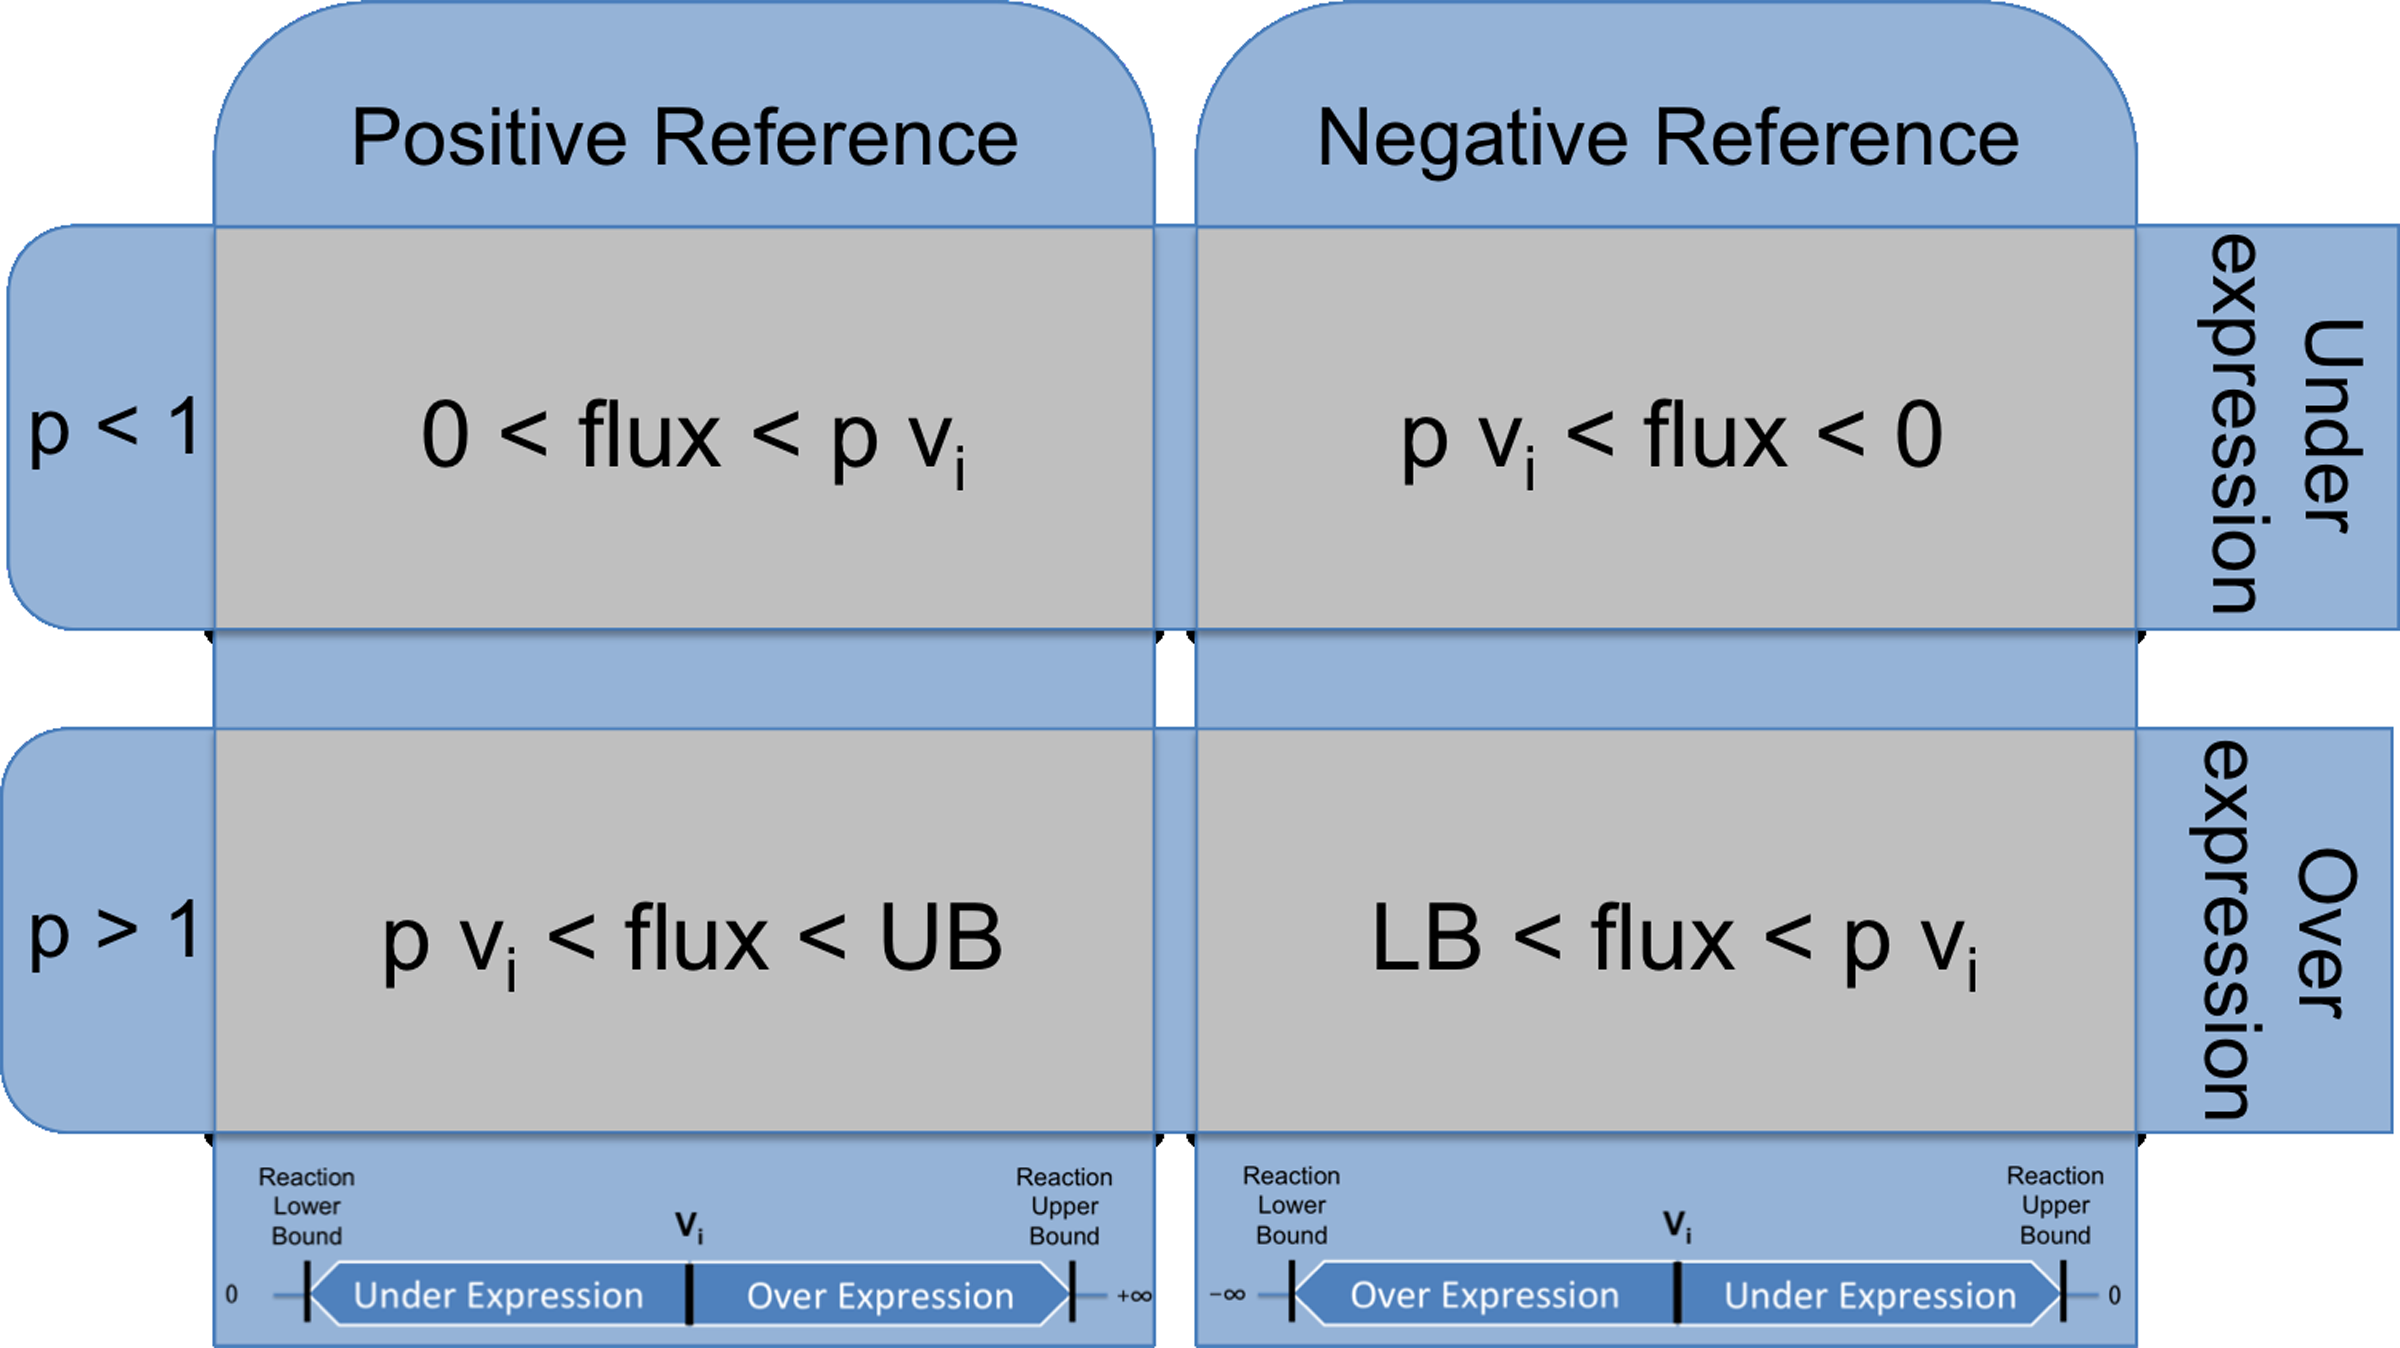
Definition of the constraints added to the formulation of the phenotype simulation problem for the over/underexpression cases for an individual reaction. The relative value for the reaction flux is denoted by p. If p is >1, the reaction will be overexpressed constraining its flux to be larger than the reference value multiplied by p. If p is <1, the reaction will be underexpressed, as its its flux is constrained to be lower than the reference multiplied by p. UB and LB, original upper and lower bound of the reaction flux; vi, reference flux for this reaction.
2.3. Algorithms for strain optimization
The optimization methods used for strain optimization were originally developed within the authors' research group (Rocha el al., 2008) to handle knockout optimization problems. These are based on SA and EA, two metaheuristics that were adapted accordingly.
2.3.1. Solution representation and evaluation
Since the optimization problem is to identify a set of genes that will undergo changes in their expression levels, a new representation was developed able to encode a set of pairs, each with a gene (its index in the model) and its expression value, also an integer working as an index to a table with a set of possible values. Indeed, the possible expression values are constrained to belong to a discrete set, since this reduces the number of possibilities (and the complexity of the optimization task). Moreover, when implementing the resulting genetic manipulations in the lab, it is impossible to fine tune the expression levels after a given precision, meaning that many solutions obtained using a continuous representation would be impossible to distinguish in vivo.
Given the nature of gene expression values, this set is provided in a logarithmic scale containing the values: 0, 2−n, 2−n+1, …, 2−1, 2, 22, … 2n. The parameter n will define the maximum range of allowed over/underexpression, which is set to 5 in the experiments. It should be noted that the value 0 in the set means that performing gene knockouts is still a possibility that can be encoded in the solution, while the value 1 (20) is not included since it would mean to maintain the expression value of the wild type.
The process of decoding a solution and evaluating it is depicted in Figure 4. The decoding process and the constraints added were explained in Section 2.2. The process proceeds with the simulation of the mutant using pFBA. The output is the set of values for the fluxes over all reactions that are further used to compute the objective function. Here, the objective function used is the biomass-product coupled yield (BPCY) (Patil et al., 2005):
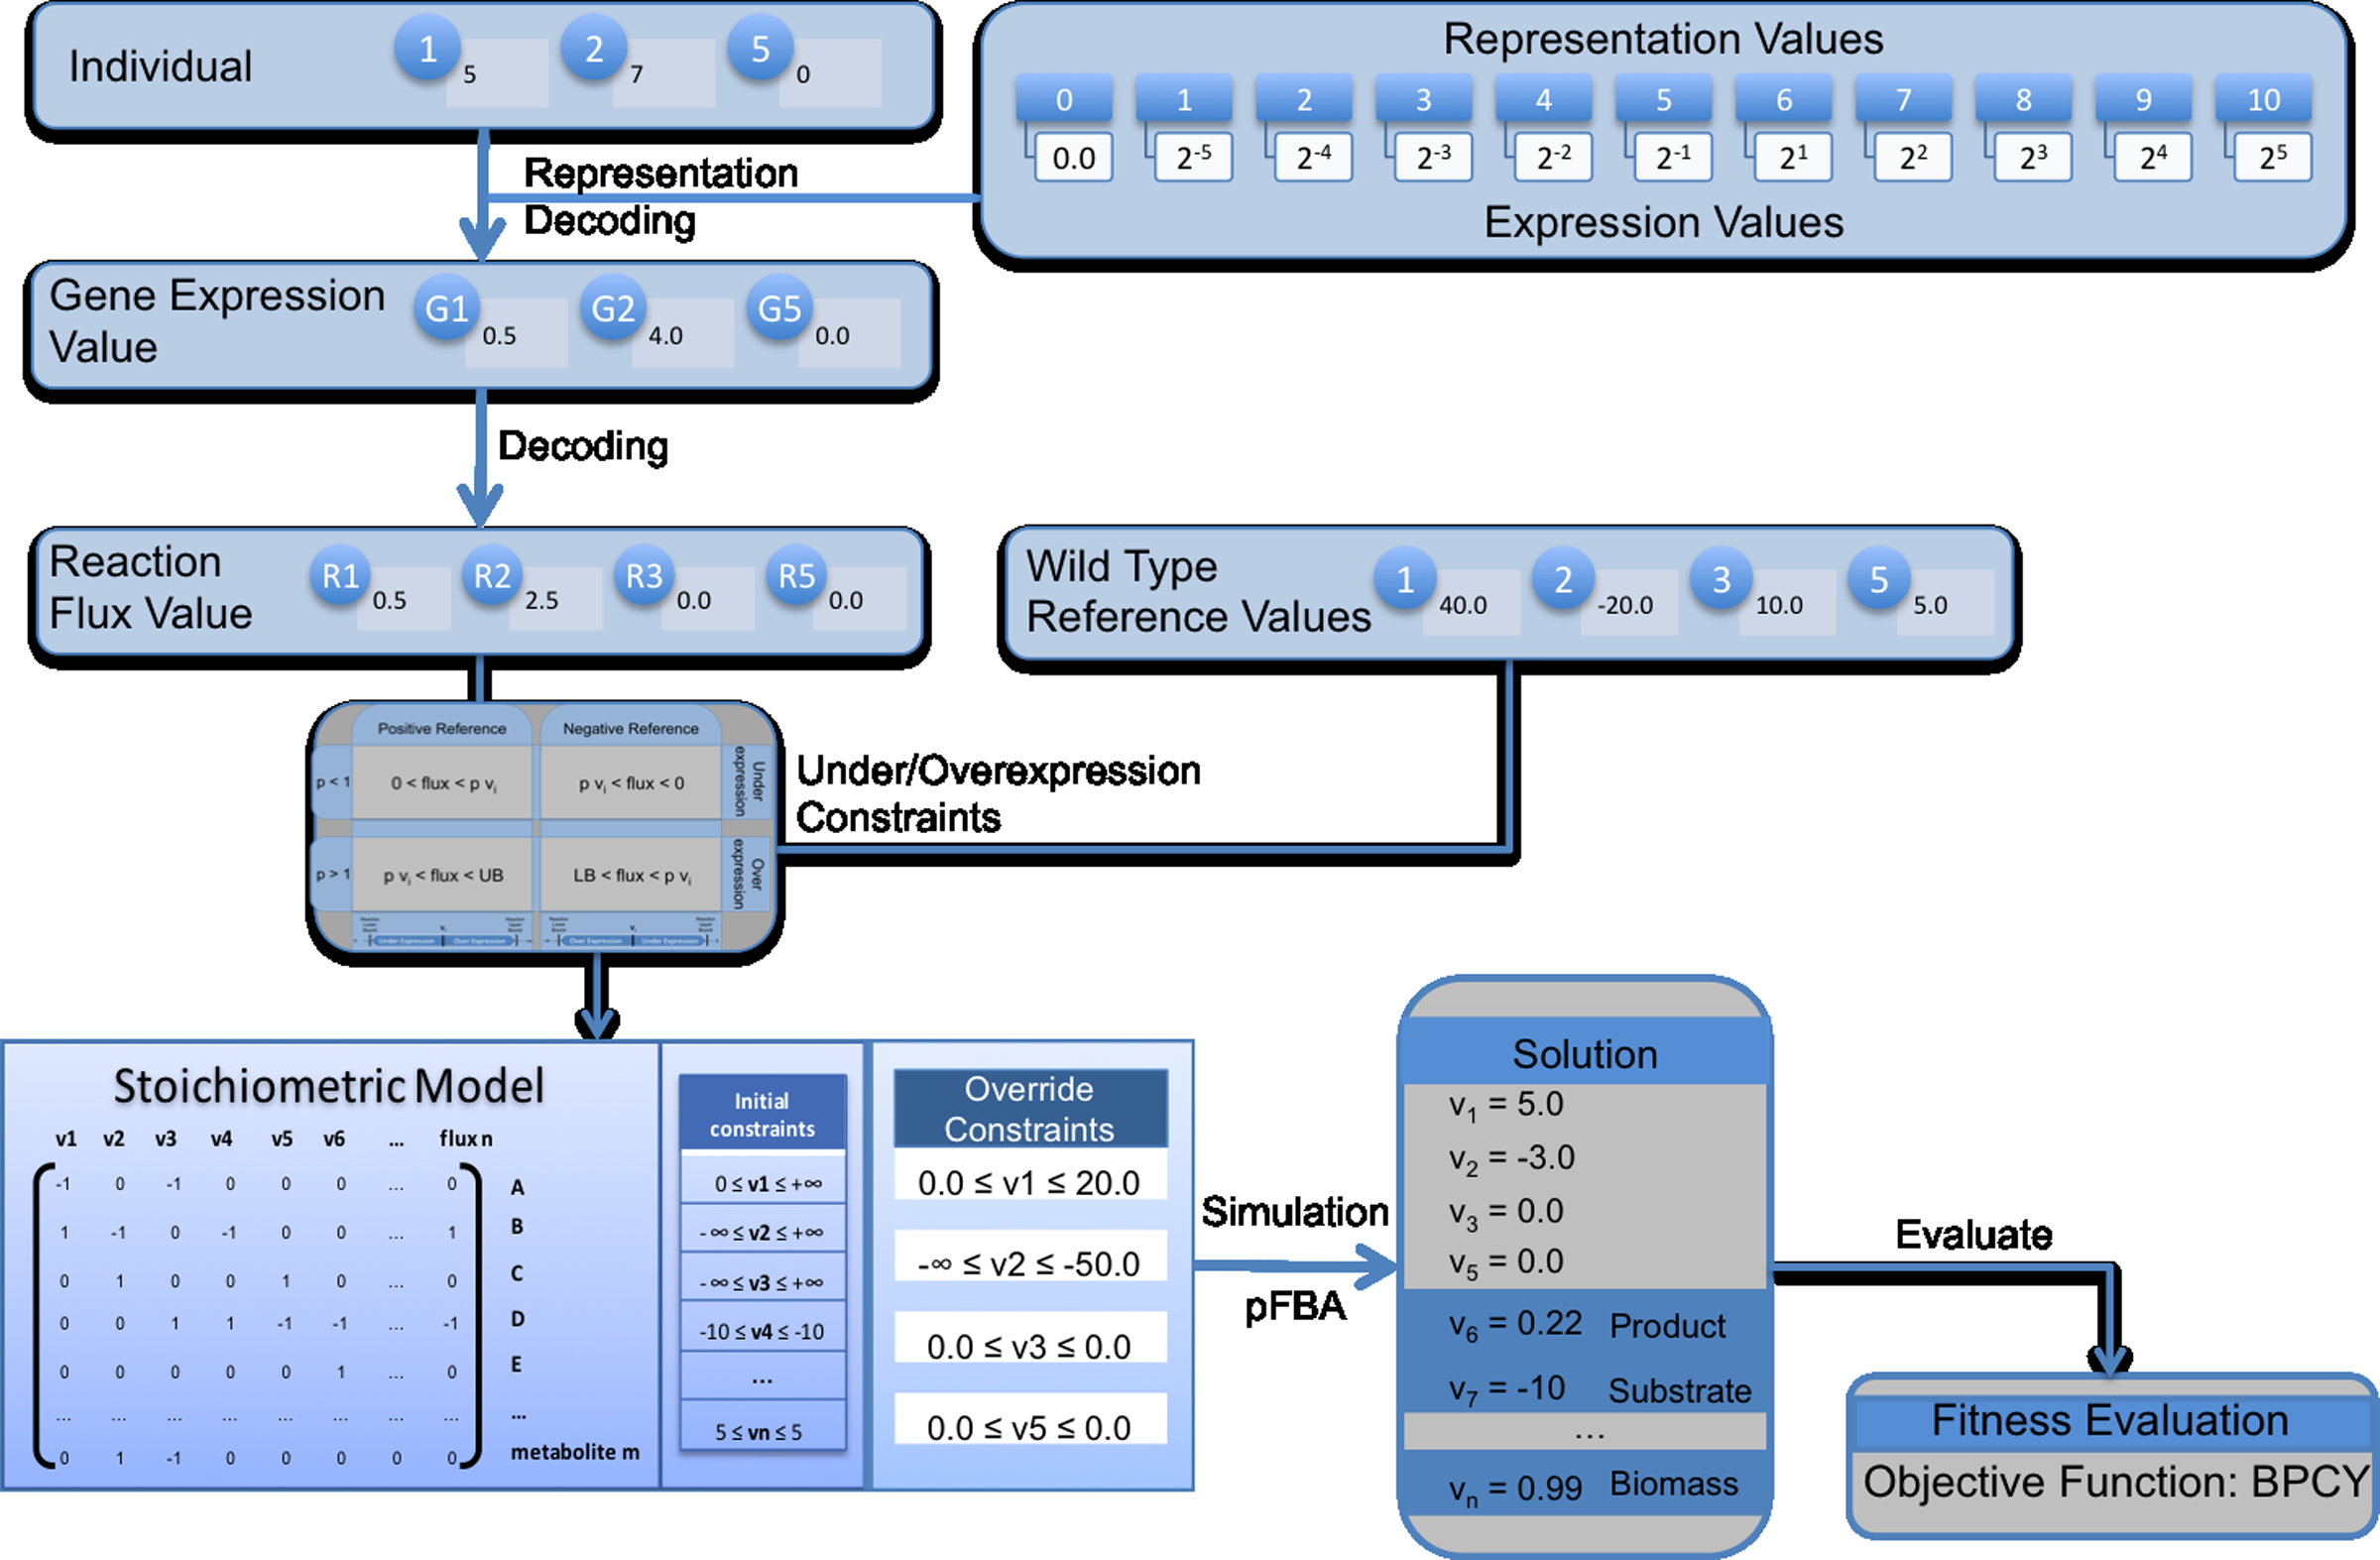
Representation of the process followed in decoding and evaluating a solution in both optimization algorithms. The input of the process is a solution encoded in the representation used for the evolutionary algorithm (EA) and the simulated annealing (SA; upper left corner). These values are decoded into pairs of genes and their relative expression values according to the table on the upper right corner. These values are then converted into reaction flux values (Fig. 2), and afterwards, the constraints for the affected reactions are generated (Fig 3). The linear programming process of parsimonious enzyme usage flux balance analysis (pFBA) follows and generates flux values for all reactions, which are then used to compute the value of the objective function (biomass-product coupled yield [BPCY] in this case).
where P stands for the flux representing the excreted product, G for the growth rate (biomass flux), and S for the substrate intake flux.
Besides optimizing for the production of the desired product, this function also allows one to select mutants exhibiting high growth rates (i.e., that are likely to exhibit a high productivity). It should be noticed that this is a nonlinear objective function.
2.3.2. EA and SA
EAs are optimization methods based on Darwinian concepts of evolution (Michalewicz, 1996). These algorithms keep a population of individuals, each encoding a solution in a certain representation, evolving through the use of reproduction operators (mutation and crossover) that work over selected solutions to create new ones. The fittest solutions have a higher probability to be selected and propagate the features encoded in their genomes to the offspring. To quantify the quality of each individual, an evaluation function is used returning a value that represents its fitness. The EA uses a selection procedure that consists in converting the fitness value into a linear ranking of the individuals, and then applying a roulette wheel scheme. In each generation, half of the individuals are kept from the previous generation, and the remaining are bred by the application of reproduction operators. An initial population is randomly created and the termination criterion is based on a fixed number of solution evaluations.
On the other hand, SA is based on an analogy with the annealing process, evolving a single solution through a series of mutations. In each step, it applies a mutation operator to the current solution, leading to a new solution. Better solutions are always accepted, while worse solutions are accepted based on a probability. This is calculated based on the current temperature, a parameter that decreases along the algorithm execution, making more difficult to accept worse solutions. Here, an exponential smoothing cooling schedule is used. SA does not make use of crossover operators, but several mutation operators can be used.
The reproduction operators used in this work are as follows:
• An operator inspired on uniform crossover, working as follows: the pairs containing gene indexes present in both parents are each sent to one of the offspring; the pairs containing gene indexes present in only one of the parents are sent to one of the offspring, selected randomly with equal probabilities.
• Two random mutation operators: one replaces a gene index by another randomly generated; the other replaces an expression value by a randomly generated value in the allowed range.
• A mutation operator that changes the expression value of a selected pair by the next/previous value in the allowed set.
• Two additional mutation operators able to create solutions with a distinct size, one adding a new pair into the genome whose values are randomly generated and the other removing a randomly selected pair from the genome.
All operators are used with equal probabilities. The main structure of the EA and SA algorithms is depicted in Figure 5. The full configuration details can be found in Rocha et al. (2008).
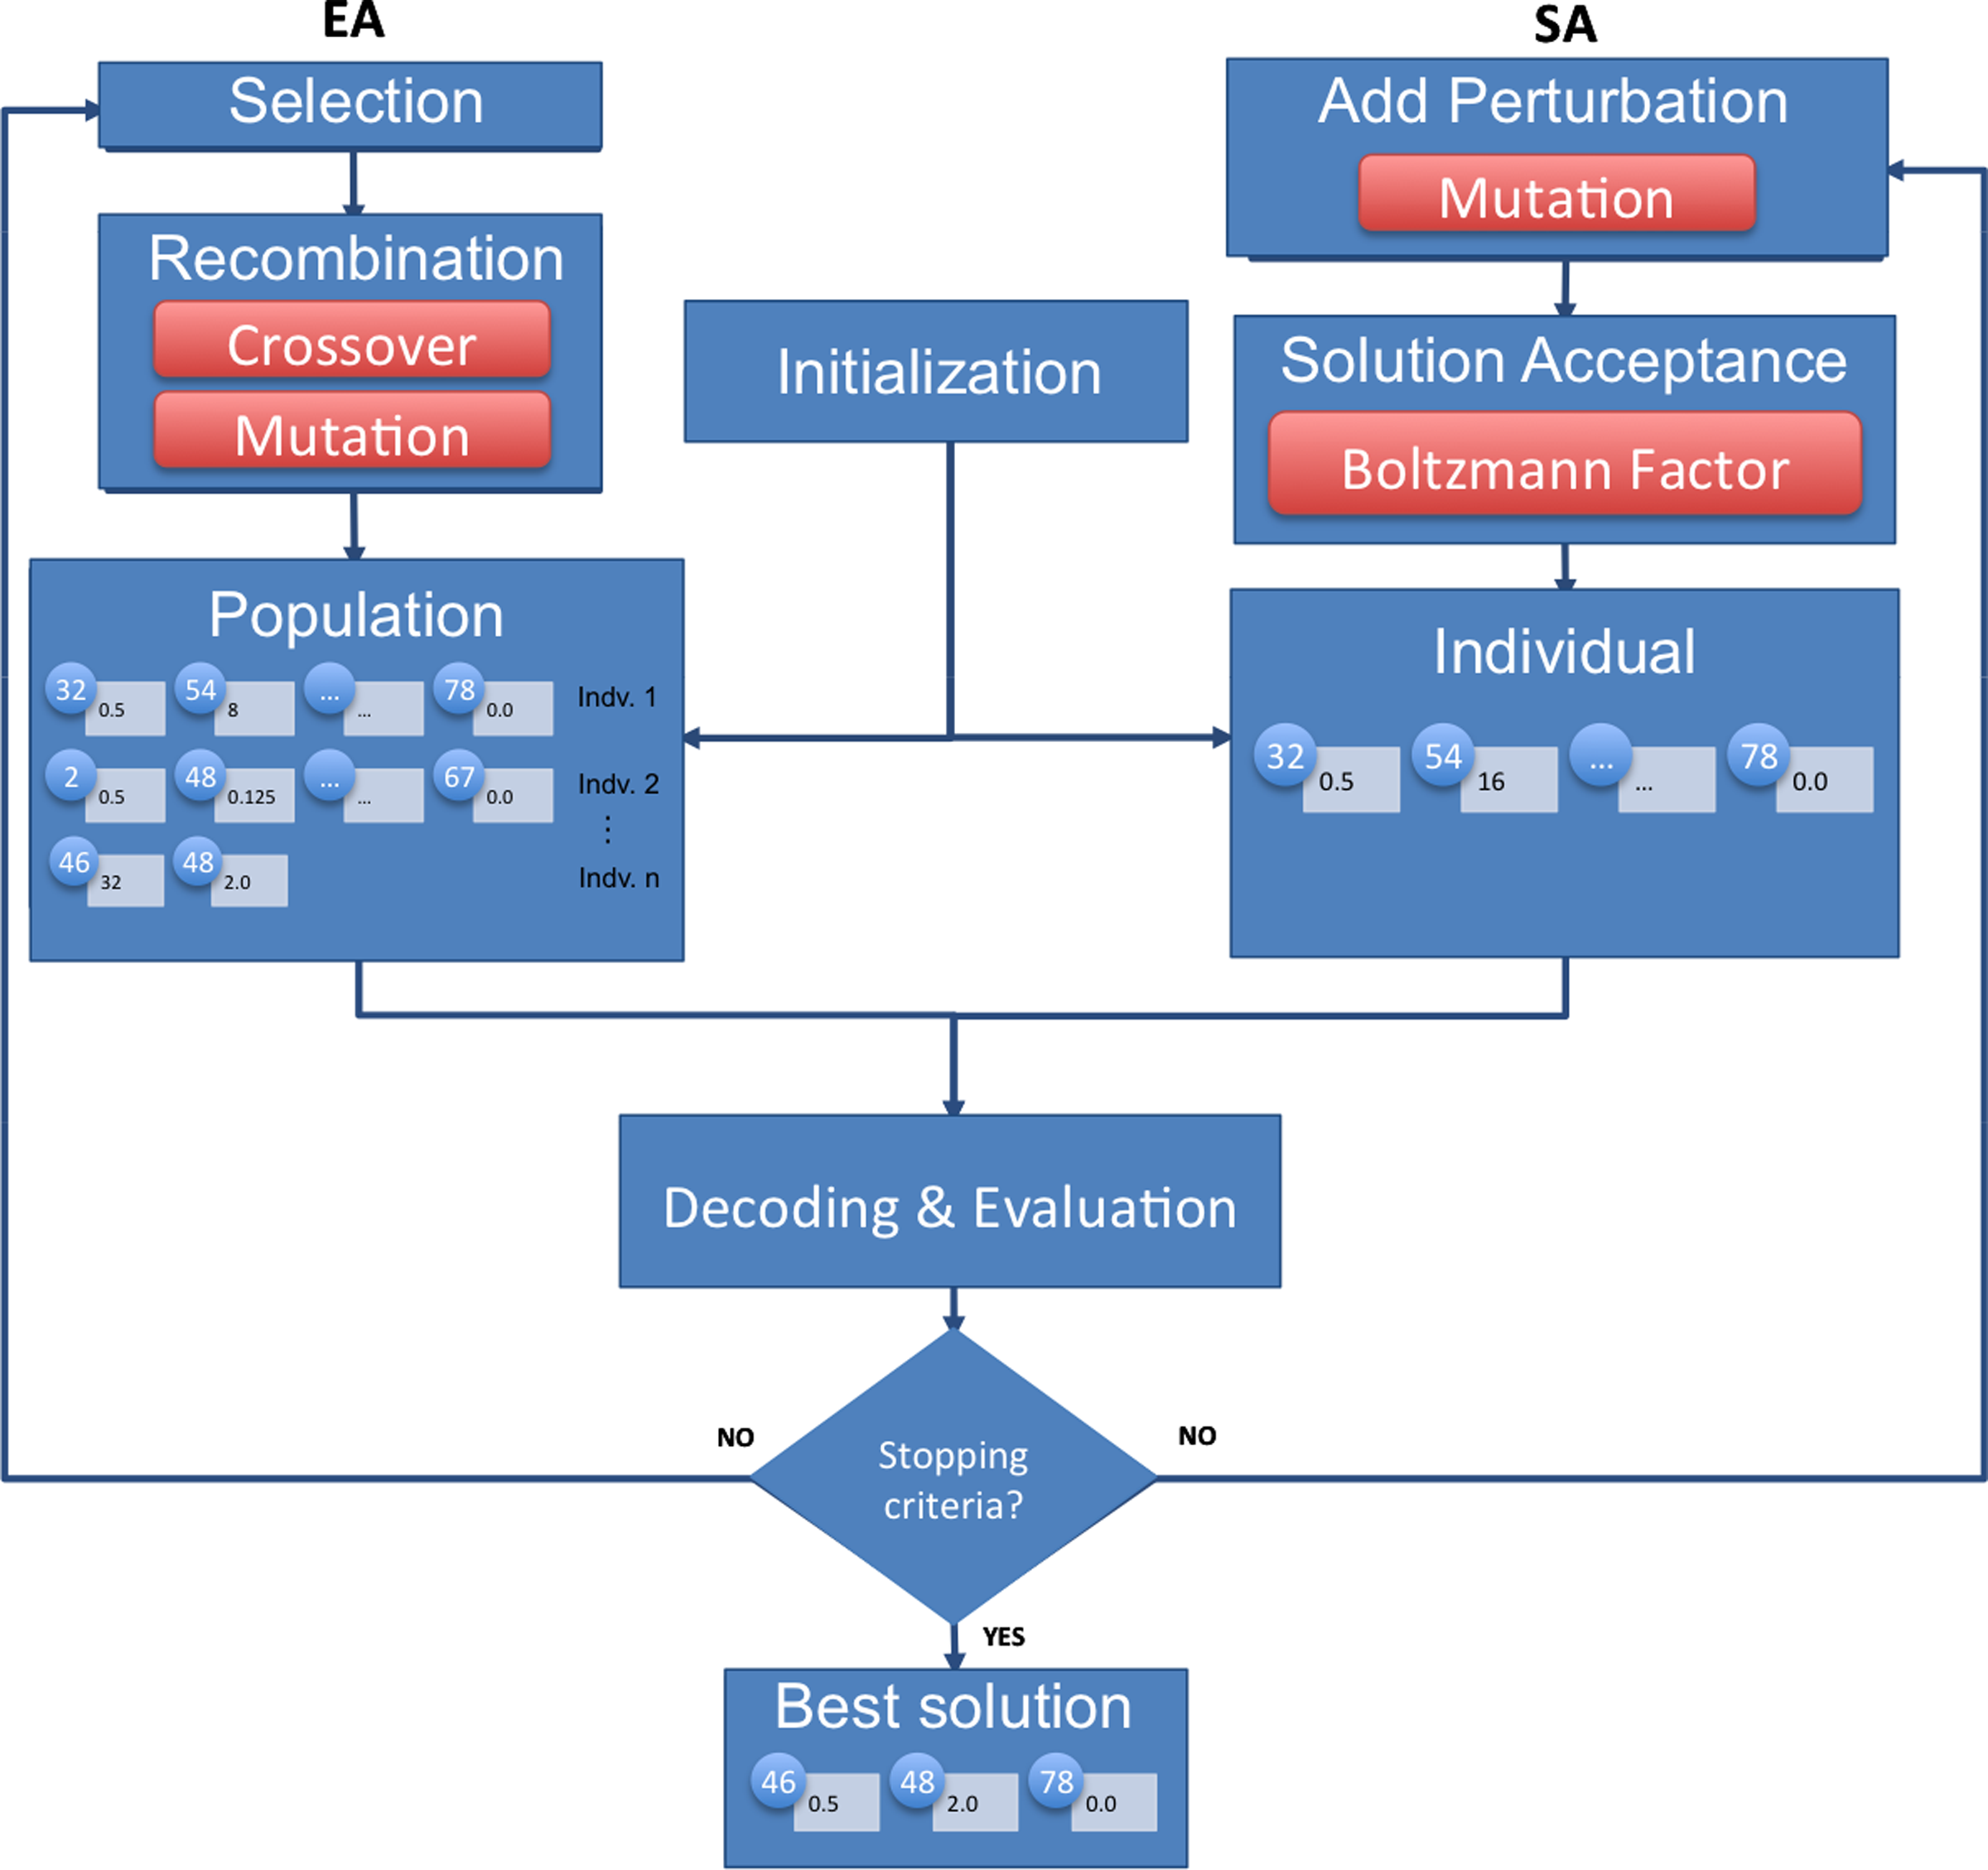
Schematic representation of the main steps of the optimization algorithms used in this work: evolutionary algorithm (EA)
3. Results
3.1. Implementation
The methods proposed in this work have been implemented, using the Java programming language, within the framework of the OptFlux open-source platform (http://www.optflux.org) (Rocha et al., 2010). This provides free user-friendly tools for the ME community aiming to be the reference platform in the field.
The set of functionalities related to phenotype simulation and strain optimization described in Section 2 are made available in a new plugin for OptFlux, freely available at the website. Documentation is also available for download stating how to use these features and providing examples.
3.2. Case studies and experimental setup
Two case studies were used, both considering Escherichia coli as the host microbe. The aim is to produce succinic and lactic acid with glucose as the limiting substrate. The model used in this work is from Reed (2003), and it contains 1075 reactions, 761 metabolites, and 904 genes. A number of pre-processing steps were conducted to simplify the model and reduce the number of targets for the optimization (Rocha et al., 2008), leaving the simplified model with 610 reactions, 383 metabolites, and 617 genes.
Succinic acid and its derivatives are widely used as supplements for pharmaceuticals, chemicals to synthesize polymers, and a large range of other industrial applications. Since its production processes are dependent on oil prices and have significant environmental impacts, obtaining a mutated microbe optimized to produce succinic acid represents an alternative to the petrochemical processes.
Also, lactic acid and its derivatives have been used in a wide range of food-processing and industrial applications such as meat preservation, cosmetics, and oral and health care products. Additionally, and because it can be easily converted to readily biodegradable polyesters, it is emerging as a potential raw material for producing environmentally friendly plastics from sugars.
A series of experiments were set to analyze the behavior of the proposed optimization algorithms, using both EA and SA. The same experiments were also conducted for gene knockout optimization for comparison purposes. For each of these four configurations and each case study, 30 independent runs were performed, given the stochastic nature of the algorithms. The maximum number of genes targets for regulation in each solution was set to 20. The defined termination criterion in all cases was set to 50,000 objective function evaluations.
4. Discussion
Table 1 summarizes the results obtained in both case studies with the proposed gene over/underexpression methods, whereas Table 2 presents similar results using gene knockouts. In both tables, a summary of the 30 runs conducted for each case study is shown, including the best solution obtained, the mean, and the standard deviation (SD) over the runs. For each configuration, the BPCY value (objective function) and the solution size (number of genes target of regulation) are given. The detailed results obtained in each of the 30 runs are also provided in supplementary files 1 and 2 (Supplementary Material is available at www.liebertonline.com/cmb). Another view of these results is provided by Figure 6, which shows boxplots of both the BPCY values and solution sizes obtained by each method over the 30 runs.
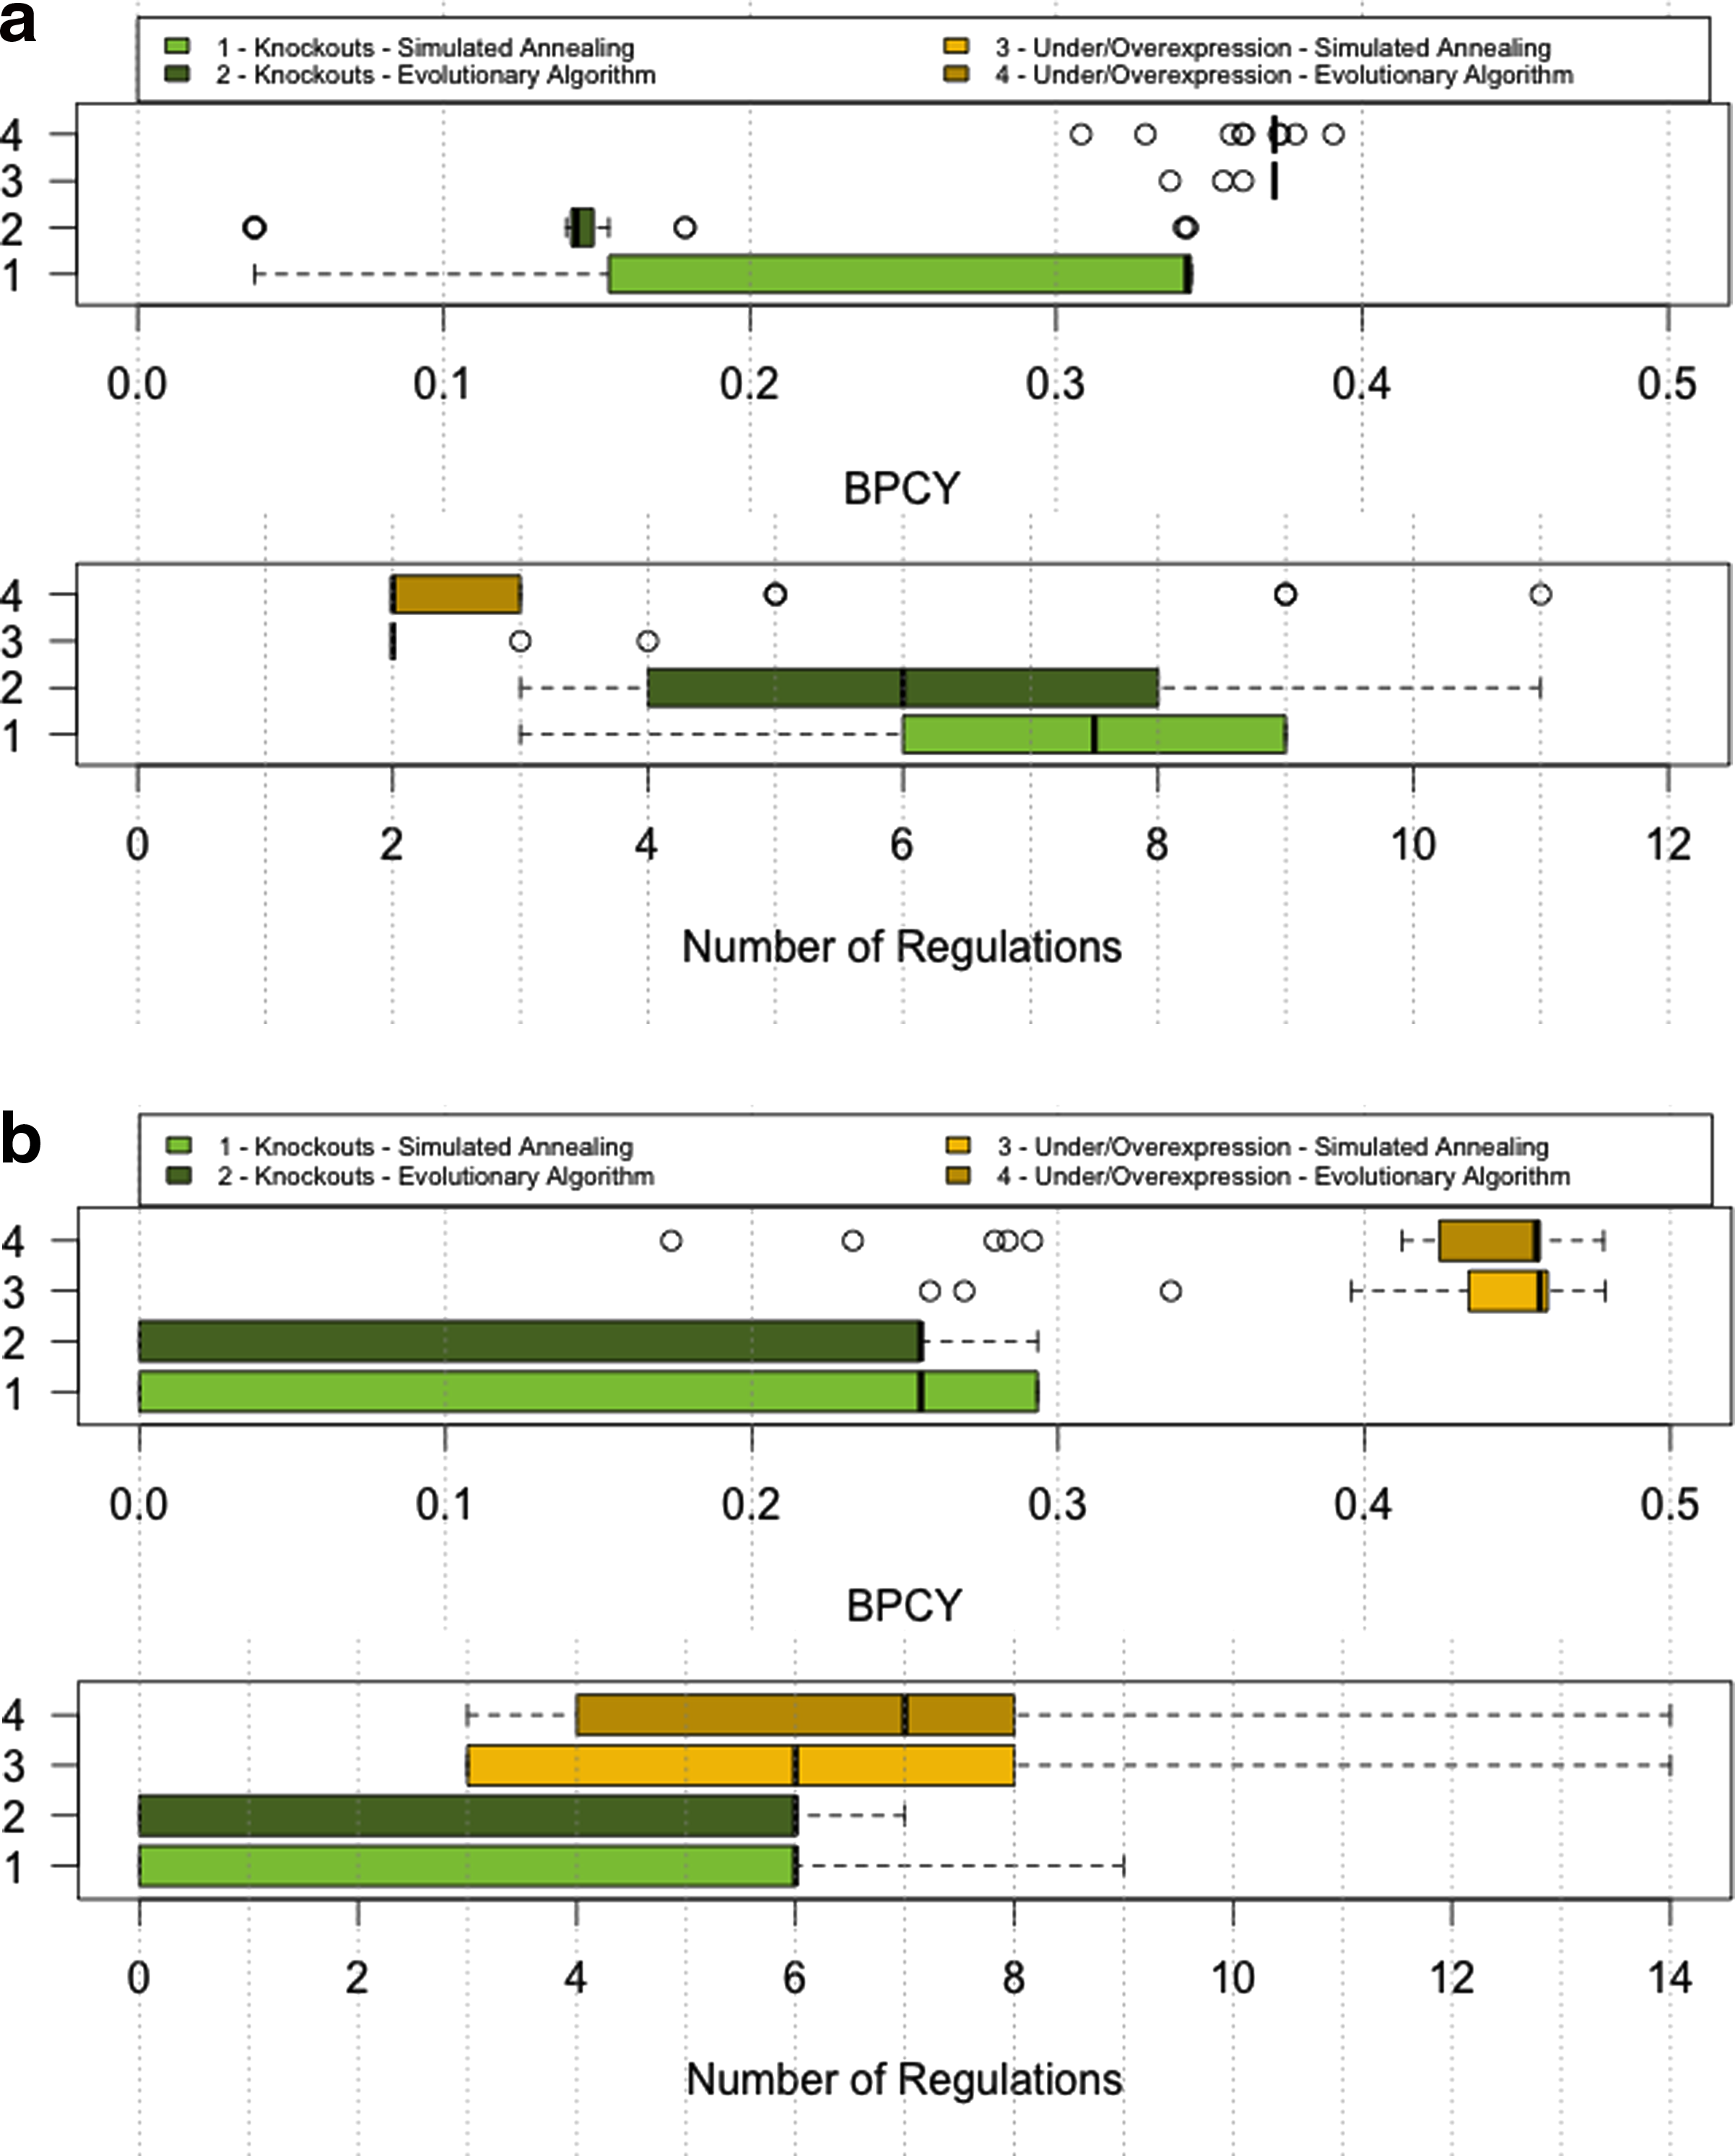
Boxplots containing the results of the strain optimization methods for both case studies. In each case, the upper boxplot refers to the biomass-product coupled yield (BPCY) values, and the lower boxplot refers to the number of regulations.
EA, evolutionary algorithm; SA, simulated annealing; SD, standard deviation; BPCY, biomass-product coupled yield.
EA, evolutionary algorithm; SA, simulated annealing; SD, standard deviation; BPCY, biomass-product coupled yield.
The first conclusion to draw from these results is that, in all cases, the over/underexpression methods were able to find results better than the knockout optimization best results, in terms of the BPCY values. This difference is significant in both case studies, but substantially larger in the case of lactic acid production. This fact shows that the approach followed can be useful in strain optimization, since it provides a significant added value when compared to previous alternatives.
One important aspect is the size of the solutions that are, in general, quite small, which means that good solutions can be obtained with few genes being manipulated, a feature that also increases the viability of the solutions for their practical implementation.
A closer look on the solutions that were obtained is provided in Figure 7, where the best overall solutions obtained by each algorithm, in each case study, are given. Also, in supplementary files 3 and 4, the frequency of the genes selected for over/underexpression, in the best solutions for each run, is provided (Supplementary Material is available at www.liebertonline.com/cmb).
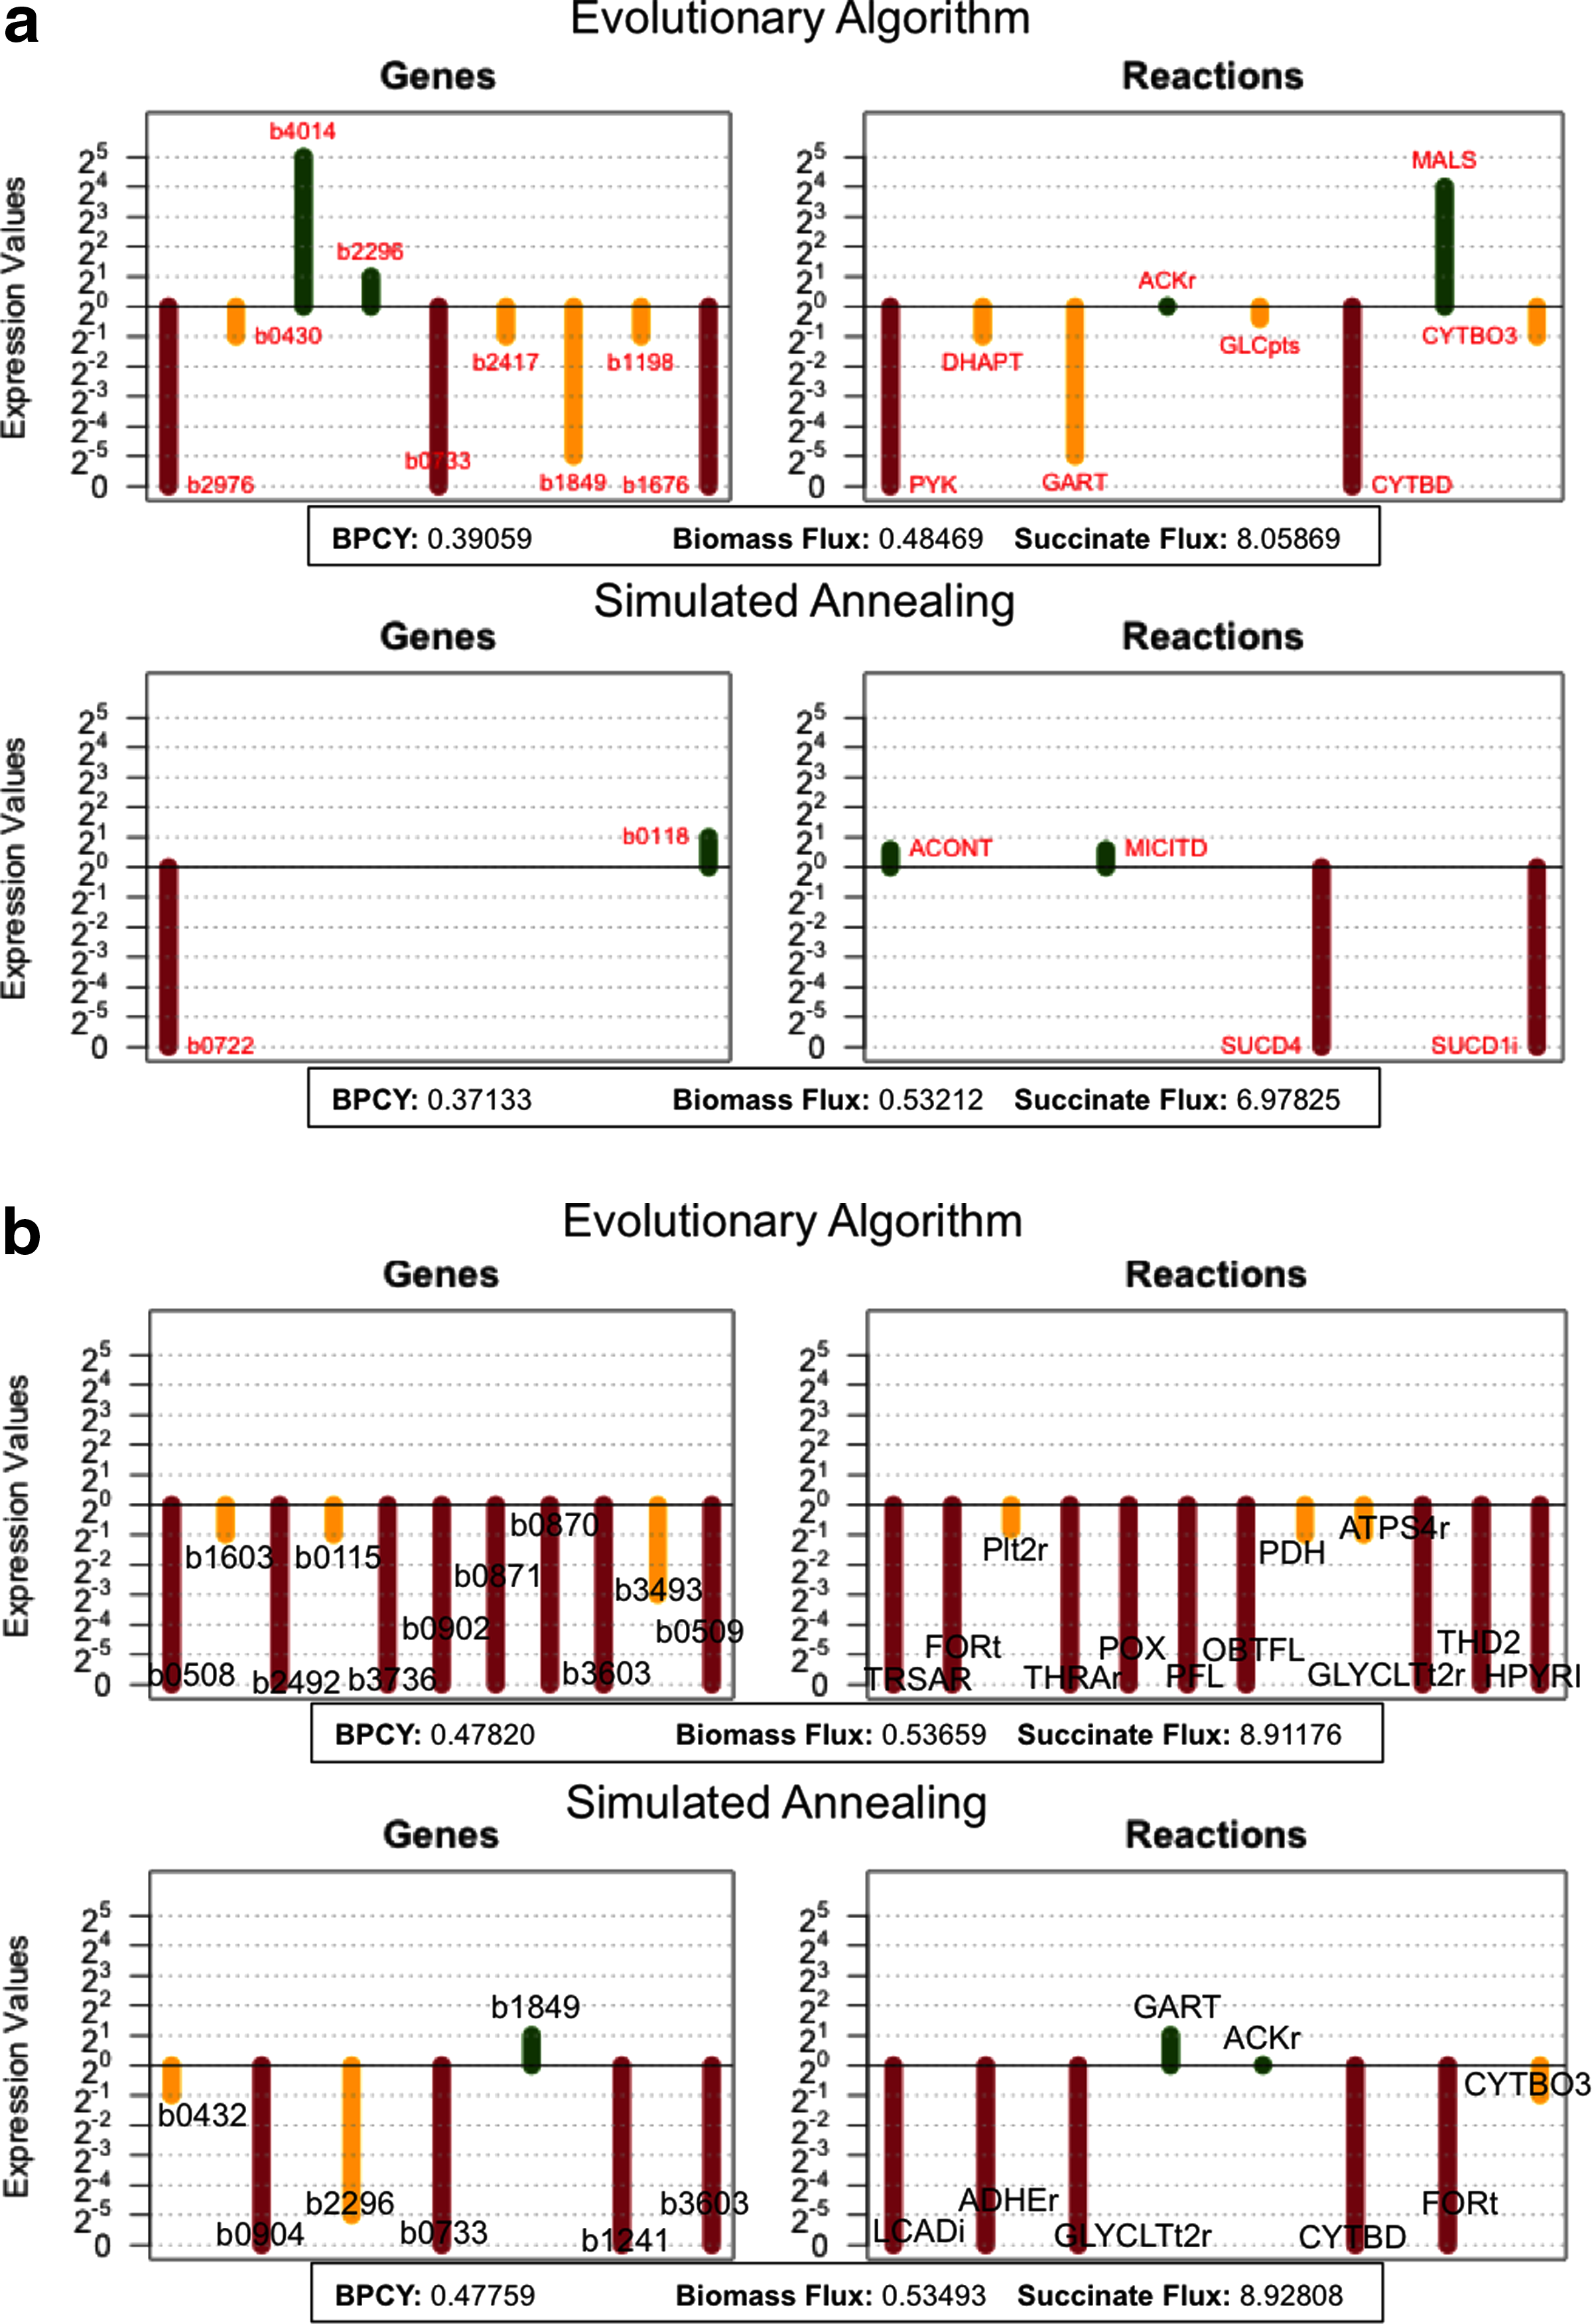
Representation of the best solutions obtained for the two case studies.
The best solutions from Figure 7 will next be analyzed, seeking an illustration of the strategies followed by these mutants. Starting with the best solution for lactic acid obtained with the EA (Fig. 7b), the core of the solution is the underexpression of ATP synthase (AS) by reducing the expression of b3736/atpF to 50% of the wild-type value. This is the final step of the oxidative phosphorylation, where the proton gradient is converted into ATP production. By restraining the amount of flux through this reaction, an excess of NADH is created inside the cell, just like in anaerobic conditions. Coupling this modification to the knockout of the gene b1603/pntA coding for pyridine nucleotide transhydrogenase (TH) is an essential part of the solution, because it prevents NADH to reduce NADP+ to NADPH. Consequently, the cell needs to find a way to recycle its NADH. With the underregulation of pyruvate dehydrogenase (b0115/aceF codifies a subunit of PDH), the inactivation of pyruvate formate lyase (b0902/pflA codifies for PFL) and the inactivation of pyruvate oxidase (b0871/poxB codifies for the POX reaction), the carbon flow is redirected from pyruvate to form lactic acid, recycling NADH in the process. The remaining modifications only contribute about 1% to the total lactate production. These minor improvements can be explained, for example, by the inhibition of carbon excretion as formate (deletion of formate exporter, b2492/focB) or glycolate (deletion of glycolate exporter, b3603/lldP).
This strategy has clearly benefited from the possibility of over/underexpressing genes, because it could fine-tune the amount of NADH available (underexpression of atpF and aceF) to promote lactic acid production, which would not have been possible by just knocking out genes. In fact, this solution resembles the oxidative bottleneck concept, by diverting part of the carbon flux to lactate by decreasing the oxidative capacity. Figure 8 shows in a simplified scheme the main reactions affected in the solution described concerning the central carbon metabolism, as well as some of the oxidative phosphorylation enzymes.
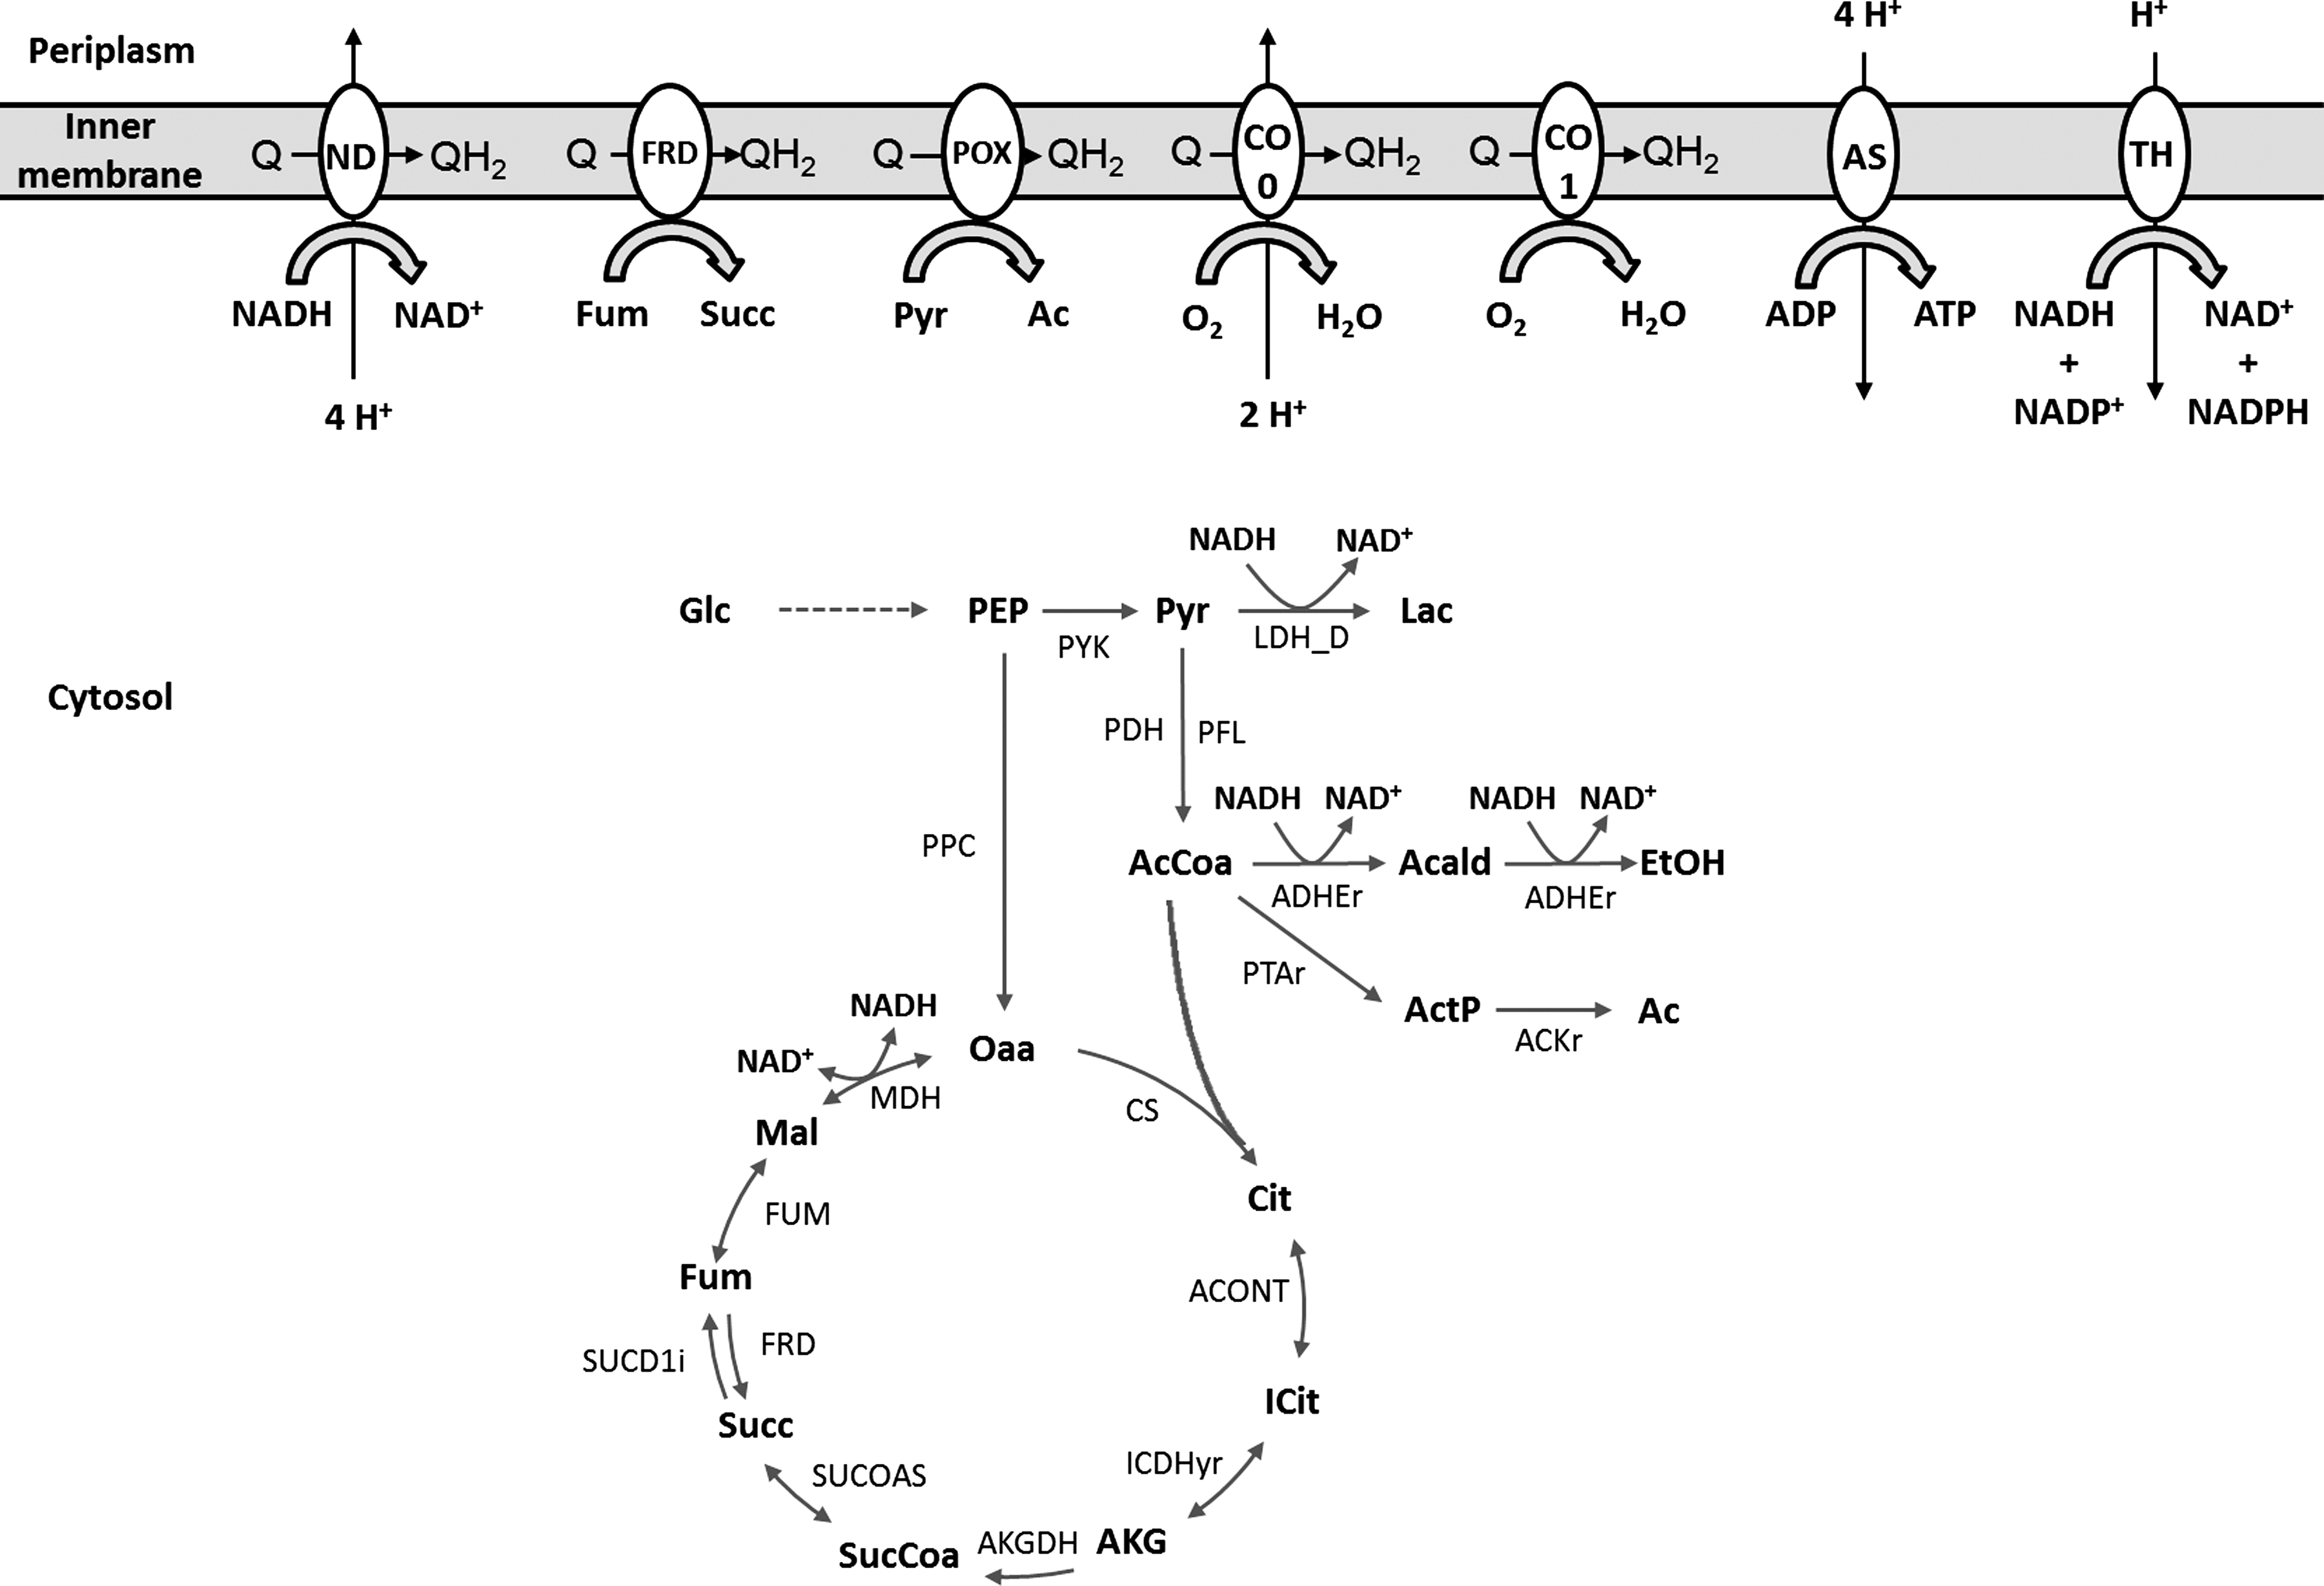
Schematic representation of the major reactions altered in the solutions described for lactic acid. ACKr, acetate kinase; ACONT, aconitate hydratase; ADHEr, alcohol dehydrogenase; AKGDH-2, oxoglutarate dehydrogenase; AS, ATP synthase; CO 0, cytochrome bo terminal oxidase; CO 1, cytochrome bd-I terminal oxidase; CS, citrate synthase; FRD, fumarate reductase; FUM, fumarate hydratase; ICDHyr, isocitrate dehydrogenase; LDH-D, lactate dehydrogenase; MDH, malate dehydrogenase; ND, NADH dehydrogenase; PDH, pyruvate dehydrogenase; PFL, pyruvate formate lyase; POX, pyruvate oxidase; PPC, phosphoenolpyruvate carboxylase; PTAr, phosphotransacetylase; PYK, pyruvate kinase; SUCD1i, succinate dehydrogenase; SUCOAS, succinyl-CoA synthetase; TH, pyridine nucleotide transhydrogenase; Acald, acetaldehyde; ActP, acetylphosphate; Ac, acetate; AcCoa, acetyl-Coa; ADP, adenosine-5′-diphosphate; AKG, 2-oxoglutarate; ATP, adenosine-5′-triphosphate; Cit, citrate; EtOH, ethanol; Fum, fumarate; Glc, glucose; ICit, isocitrate; Lac, lactate; Mal,
The other solution identified for lactic acid, but obtained with SA is quite similar to the solution described above. In this case, Cytochrome bo terminal oxidase (CO 0), from the oxidative phosphorylation, is underregulated (b0432/cyoA codifies a subunit). When coupled to the deletion of cytochrome bd-I terminal oxidase (b0733/cydA codifies a subunit of CO 1 reaction), it has the same effect in the cell of creating an excess of NADH. Contrasting with the first solution, the redirection of the carbon flux to lactic acid is achieved by three regulations: deleting alcohol dehydrogenase (b1241/adhE codifies for ADHEr reaction) and forcing the flux through acetate kinase (ACKr) in the assimilation direction by overexpressing b1849/purT and underexpressing b2296/ackA. The deletion of alcohol dehydrogenase is important to avoid NADH to be recycled using this reaction. The simultaneous over and underexpression of two different genes coding for acetate kinase, fine-tunes it to its optimal value. Once again, the two remaining deletions account for only a small portion of the objective function and were already explained above.
Switching to succinic acid, the best solution obtained with the EA (Fig. 7a) is also similar to the ones described above for lactic acid. At the core of the solution is the excess of NADH caused by the underregulation of the oxidative phosphorylation. In this solution, this is achieved by underregulating cytochrome bo terminal oxidase (b0430/cyoC codifies a subunit) and the deletion of the alternative cytochrome bd-I terminal oxidase (b0733/cydA codifies a subunit). The flux of carbon is, in this case, fully directed to the citric acid cycle by forcing phosphoenolpyruvate to the phosphoenolpyruvate carboxylase reaction (PPC). This is achieved with the inactivation of pyruvate kinase (PYK) by deleting b1676/pykF, underregulating dihydroxyacetone kinase (b1198/dhaM codifies a subunit) and underregulating the glucose-specific PTS permease (b2417/crr codifies a subunit). Then, malate dehydrogenase (MDH) converts oxaloacetate to
Finally, analyzing the best solution for the SA in the succinic acid case study, we can see that the gene b0118/acnB is overexpressed by a factor of 2. This causes the flux through aconitate hydratase reaction (ACONT) to be higher than the wild-type reference, which forces the carbon flow into the citric acid cycle.
It is interesting to notice that this reaction was already identified as a good target for overexpression in a study by Ranganathan et al. (2010), which was also targeted at succinic acid production.
The other gene involved is b0722/sdhD with an expression value of 0, which means that this gene is knocked out, causing succinate dehydrogenase (SUCD1i) to be inactivated. This interruption in the citric acid cycle combined with the increased carbon flow elicited by b0118 overexpression induces succinic acid production. This is also a common target identified by previous approaches in knockout optimization (Rocha et al., 2008) for this case study. The reaction rule for this reaction is as follows: b0721 AND b0722 AND b0723 AND b0724, meaning that the same regulation over genes b0721, b0723, and b0724 would have similar results (note that in this case, the AND will be treated as the minimum of the expression values).
One drawback of the formulation described herein is that, if a reaction has a flux of zero in the wild-type, by making it over/underexpressed by the algorithm, it would have the same effect as a reaction deletion (because its expression value will be multiplied always by zero and the reaction will be incorporated in the set of reactions to manipulate). However, it is obvious that in reality, this inactivation would only be achieved by knocking out the genes associated with the reaction. This is important when the genes rules associated with a reaction contain OR operators, because the whole reaction can be inactivated by regulating only one of the genes, which does not respect the biological meaning. In the above analyzed solutions, this happened with the PFL reaction, as well as with FORt, GLYCLTt2r, PIT2r, TRSAR, and THRAr. Nevertheless, the user can quickly identify such glitches in the solutions and replace such over/underexpression with the equivalent deletions.
Other potential sources of erroneous results is the fact that the all procedure is based, on one side, on a flux distribution obtained by the application of pFBA methods that can be far away from reality and, on the other side, on the fact that a similar linear relation is considered for all genes regarding gene expression and flux values. While, in the first case, the accuracy of the results can be greatly improved with the aid of experimental flux data (e.g., from 13-C measurements) and/or better simulation methods, the second case has to be looked with caution. In fact, many assumptions have to be made to consider such a linear relation, including: similar translation rates for all genes, similar rates of protein degradation for all enzymes, and a linear relation between enzyme concentration and reaction rates, which could only be assumed if, among other considerations, all reactions would be operating close to the maximum rates and with no enzymatic inhibition. However, with the insufficient number of enzymes kinetically characterized and lack of knowledge on the dynamics of protein degradation and synthesis, it is still impossible to make use of approaches that take into consideration eventual nonlinearities between gene expression and flux data. Nevertheless, this should be taken in consideration when implementing in vivo the in silico results obtained with the approaches presented in this paper. Also, the basic methodology will be still usable when more complex relationships between gene expression and flux values are incorporated within the models.
5. Conclusion
Strain optimization is an essential task in ME, since it can contribute to substantially reduce the production cost of industrial compounds in Biotechnology applications, by pinpointing desired genetic modifications in selected host microbes.
In this work, we have proposed a novel approach for strain optimization, based on the use of meta-heuristics such as EA and SA, for the identification of (near) optimal genetic changes based on gene over/underexpression. The results show that there is an added value on this approach, when compared with the previous work that was limited to the optimization of reaction/gene deletions, both in reaching solutions with higher levels of BPCY and in providing alternative strategies in the design of mutants.
Thus, this work significantly enlarges the toolset at the disposal of ME experts.
Future work will mainly focus on the further validation of this approach with other case studies and the implementation of the solutions obtained in the lab, for selected case studies. Also, the work will proceed with the improvement of the available tools for the analysis of the solutions obtained in silico aiming at an improved capability to understand the strategies followed by the mutants. A complementary line of work will address the development of phenotype simulation methods using models enriched with the available regulatory information, already available for model organisms such as Escherichia coli.
Footnotes
Acknowledgments
This work was supported by the Portuguese FCT and Programa COMPETE (project PTDC/EIA-EIA/115176/2009).
Disclosure Statement
No competing financial interests exist.
References
Supplementary Material
Please find the following supplemental material available below.
For Open Access articles published under a Creative Commons License, all supplemental material carries the same license as the article it is associated with.
For non-Open Access articles published, all supplemental material carries a non-exclusive license, and permission requests for re-use of supplemental material or any part of supplemental material shall be sent directly to the copyright owner as specified in the copyright notice associated with the article.