
Abstract
Abstract
Given the important role of microRNAs (miRNAs) in genome-wide regulation of gene expression, increasing interest is devoted to mixed transcriptional and post-transcriptional regulatory networks analyzing the combinatorial effect of transcription factors (TFs) and miRNAs on target genes. In particular, miRNAs are known to be involved in feed-forward loops (FFLs), where a TF regulates a miRNA and they both regulate a target gene. Different algorithms have been proposed to identify miRNA targets, based on pairing between the 5′ region of the miRNA and the 3′UTR of the target gene, and correlation between miRNA host genes and target mRNA expression data. Here we propose a quantitative approach integrating an existing method for mixed FFL identification based on sequence analysis with differential equation modeling approach that permits us to select active FFLs based on their dynamics. Different models are assessed based on their ability to properly reproduce miRNA and mRNA expression data in terms of identification criteria, namely: goodness of fit, precision of the estimates, and comparison with submodels. In comparison with standard approaches based on correlation, our method improves in specificity. As a case study, we applied our method to adipogenic differentiation gene expression data providing potential novel players in this regulatory network. Supplementary Material for this article is available at www.liebertonline.com/cmb.
1. Introduction
Given the important role of miRNAs in genome-wide regulation of gene expression, increasing interest is devoted to mixed transcriptional and post-transcriptional regulatory networks analyzing the combinatorial effect of transcription factors (TFs) and miRNAs on target genes. In particular, miRNAs are known to be involved in feed-forward loops (FFLs), where a TF regulates a miRNA and they both regulate a target gene (Shimoni et al., 2007; Shalgi et al., 2007; Tsang et al., 2007; Re et al., 2009). The dynamic of FFL has been extensively studied in transcriptional networks (Mangan and Alon, 2003; Kalir et al., 2005; Kaplan et al., 2008; Macia et al., 2009; Alon, 2007) since this regulatory pattern is overrepresented in biological networks with respect to random networks (Milo et al., 2002; Shen-Orr et al., 2002) and thus represents a basic building block, favored by evolution and playing important functional roles. For example, FFLs involving miRNAs permit us to accomplish target gene fine tuning and noise buffering (Li et al., 2009; Wu et al., 2009). In Tsang et al. (2007), correlation between miRNA host genes and target mRNA was assessed together with conserved 3′UTR motifs to define putative regulatory relationships between a miRNA and a set of target genes sharing the same TF. A quantitative description of the regulatory interactions (e.g., based on differential equation models) was helpful to characterize putative miRNA-mediated FFLs. A similar approach has been adopted elsewhere (Vu and Vohradsky, 2007; Chen et al., 2004, 2005), where differential equations were fitted to expression data for transcriptional networks not involving miRNAs. As regards small RNA-mediated FFL, a differential equation-based model has been used in Shimoni et al. (2007), only to simulate the dynamic of a generic circuit using plausible parameter values derived from literature.
In this work, we propose a general analytical framework that is based on the use of differential equations to extensively characterize a list of putative miRNA-mediated FFLs. Our approach, when applied to a list of putative FFLs, provides some criteria to select active FFLs based on their ability to reproduce dynamic expression data. In this context, we do not use the data to validate the models, but, on the opposite, three models are used to fit the data and select active FFLs based on the goodness of fit. The first model M1 is borrowed from previous literature (Khanin and Vinciotti, 2008; Shimoni et al., 2007; Levine et al., 2007a,b). Models M2 and M3 are linear simplifications of model M1 since, as shown in the following, the choice of the most appropriate model strictly depends on the available dataset.
We estimate the significance of our method in comparison with random FFLs obtained by randomly selecting links between miRNAs, TFs, and target mRNA and in comparison with a more standard approach, based on correlation between TF, miRNA, and target mRNA.
2. Models
In the miRNA-mediated FFL circuit (Fig. 1A), a transcription factor TF (X1) regulates a miRNA (X2), and they both regulate a target mRNA (X3). Three models based on ordinary differential equations (ODEs) are examined to describe the miRNA and target mRNA expression kinetics. All models consider X1 as forcing function and describe the rate of change of X2 and X3 as the balance between their synthesis/transcription (Si) and degradation (D
i
) with the basal expression level (X
ib
) as initial condition; the correspondent compartmental model is shown in Figure 1B. Thus, for i = 2,3, the differential equation describing the variables is
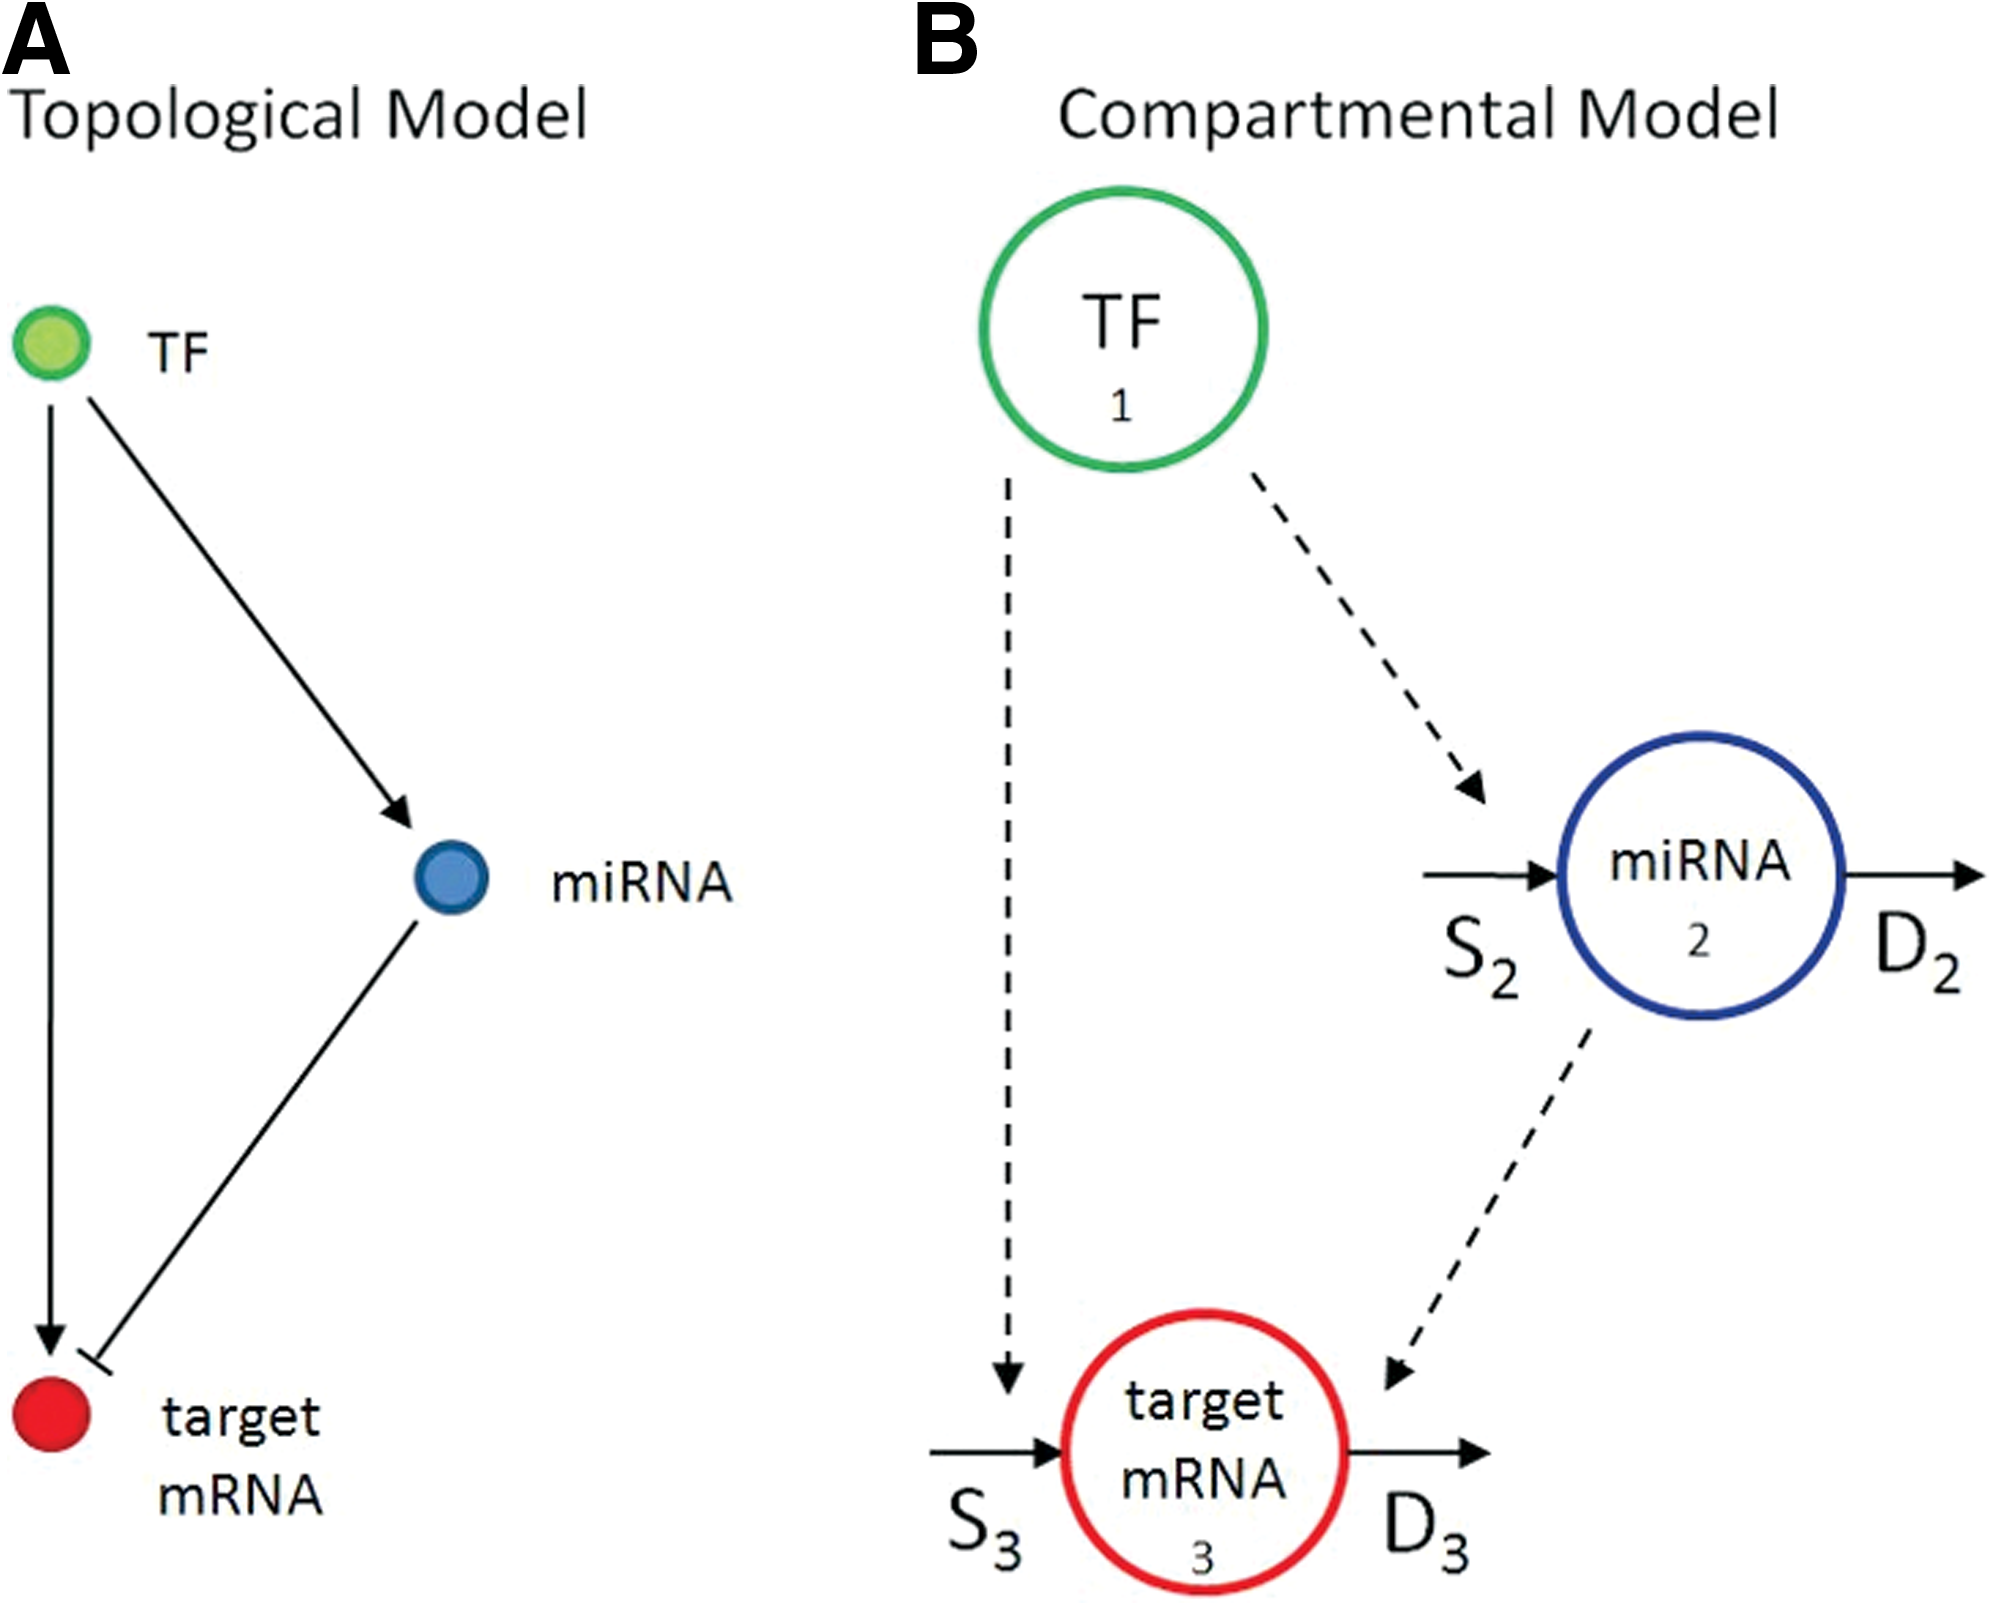
miRNA-mediated FFL.
The synthesis is expressed as the sum of a basal term (Sib), plus a positive (activation) or negative (repression) term (ΔSi) encoding the effect of the specific TF on the transcription of miRNA and target mRNA. As regards degradation (D
i
), for miRNA it is assumed to be a function only of its expression, while for the target mRNA the effect of the miRNA level is also modeled.
The three models adopt the same description for miRNA degradation (i.e., a first order process with constant rate d2), while they differ in the functional description assumed for ΔS2, ΔS3, and D3.
(1) Model M1 describes the TF regulation on the miRNA (ΔS2) and the target mRNA (ΔS3) by a saturative Michaelis-Menten function, and the miRNA-mediated degradation of the target mRNA (D3) as the sum of a first order process, with constant rate, with respect to X3 and a nonlinear term that depends also on X2 as provided elsewhere (Khanin and Vinciotti, 2008; Shimoni et al., 2007; Levine et al., 2007a,b). (2) Model M2 assumes TF regulation (ΔS2, ΔS3) to be linearly dependent on its level, while the functional description of target mRNA degradation (D3) has nonlinear dynamics as in M1. (3) Model M3 is derived from M2 linearizing the miRNA-mediated degradation model (D3); thus, the kinetics of the whole model is linear.
Since in log scale spot array data are expressed as differences with respect to a basal pre-differentiation state, it is convenient to consider as state variables xt = Xi − Xib for i = 1,2,3, where Xib is the reference, collected at day −3. Considering that at the basal state
Model M1:
Model M2:
Model M3:
The mathematical derivation of Equations 3, 4, and 5 and the meaning of each parameter in terms of synthesis and degradation rate are detailed in the Supplementary Material (Supplementary Material is available at www.liebertonline.com/cmb).
Model identification
A priori identifiability of M1, M2, and M3 (Equations 3, 4, and 5), tested using the software DAISY (Bellu et al., 2007), indicates that all three models are a priori globally identifiable; in other words, it is theoretically possible to estimate the set of unknown parameters θ from the data, at least under ideal conditions (noise-free data, continuous time observations, and error-free model structure).
where zi(tj) is the observed datum at time j, xi(tj, θ) is the predicted datum at time j computed using the model (Equations 3, 4, and 5), ω
i
(tj) is the weight assigned to datum j (inverse of the variance of the measurement error), and Ni is the number of time points. The external summation takes into account that residuals for both miRNA and target mRNA are simultaneously minimized; thus, miRNA and mRNA time series collected under the same experimental conditions are required for model identification. The measurement error is assumed to be Gaussian with zero mean and a known variance. The variance is experimentally determined by analyzing replicates of each measure. A general model for the error variance is
where α, β, and γ are parameters to be estimated from replicates by plotting the mean of each replicate against its variance and fitting on these data the unknown parameters of the error model (Equation 7), as described in Cobelli et al. (2000).
Since data are affected by a measurement error, also
where
FFLs selection
For each model, selection of active FFLs from a large set of putative ones exploits identification results in terms of consistency with the three following criteria:
1. Goodness of fit. A valid model should provide an adequate fit to the data. The goodness of fit can be evaluated on residuals, based both on their whiteness, (i.e., residuals should be uncorrelated) and on their amplitude (i.e., deviation between predicted and observed values should be comparable to the measurement error). To evaluate the whiteness of the residuals, the number of runs (i.e., subsequences of residuals having the same sign) are analyzed for both miRNA and mRNA residual patterns. For the amplitude property, a global measure is provided by WRSS divided by the degree of freedom (i.e., difference between the number of data and the number of parameters); since weighted residuals should be independent with unit variance, WRSS should be the outcome of a random variable with Chi-Square distribution. 2. Precision of the estimates. FFLs having all parameter estimates with CV < 100 are considered reliable. 3. Comparison with submodels. In order to verify that the FFL model (Fig. 1B) is the optimal description of the circuit, its performance is compared with that of two submodels (Fig. 2) with missing regulatory links: in Submodel 1 the regulatory link between the TF and the target mRNA is missing, while in Submodel 2 the effect of miRNA on target mRNA degradation rate is not considered. Once the two submodels are identified, their performance is assessed versus the original one based on the Akaike Information Criterion (AIC), which implements the principle of parsimony (i.e., selects the model best able to fit the data with the minimum number of parameters):
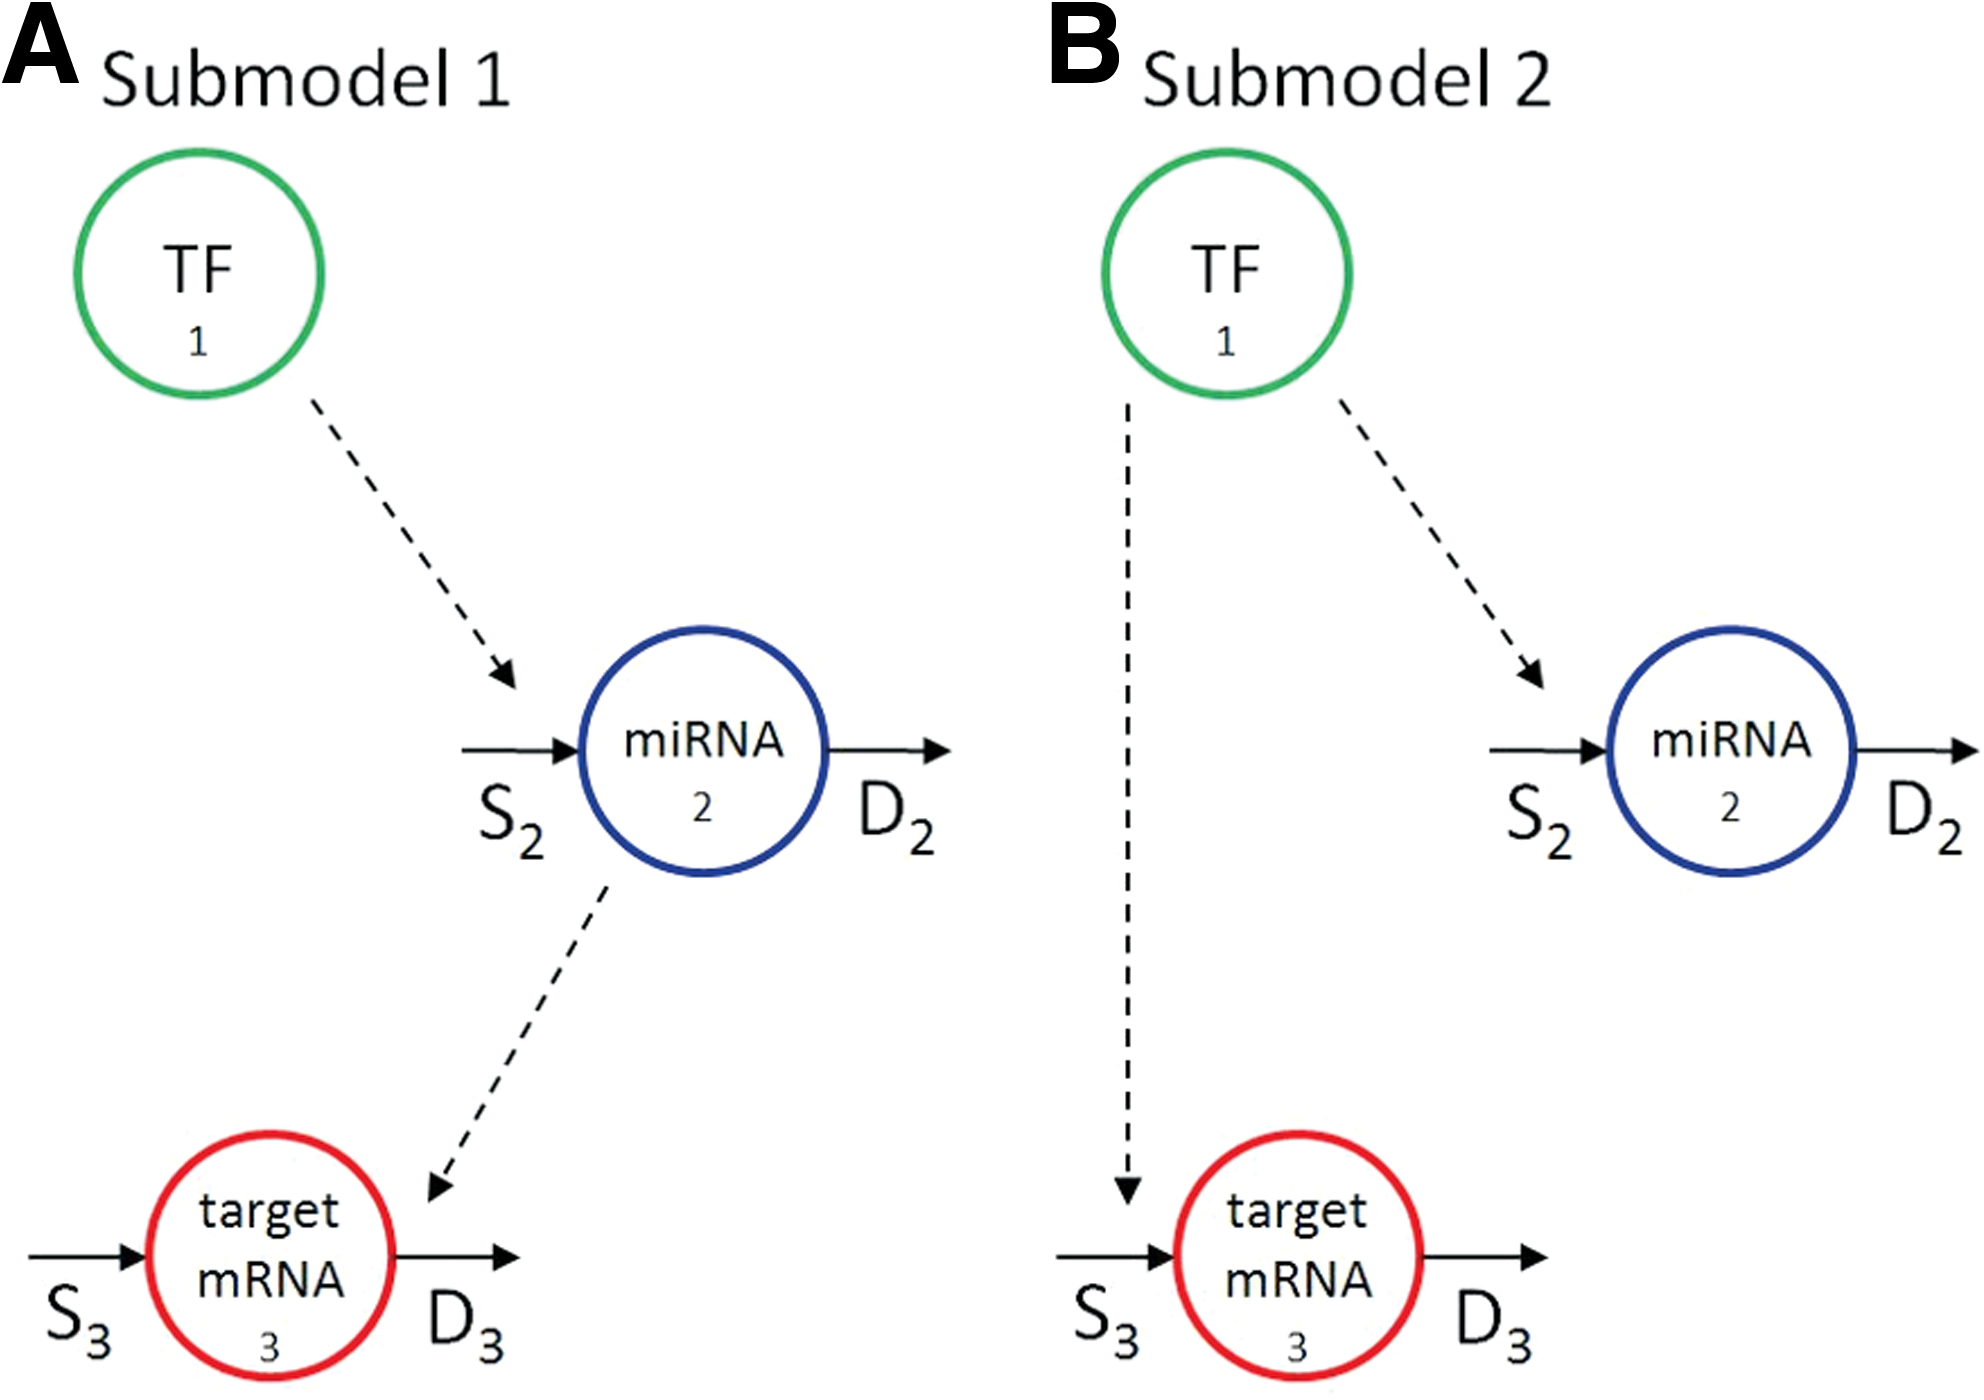
Submodels with missing regulatory links with respect to the FFL.
The FFL model is selected if its AIC is the lowest compared with submodels.
Summing up, if criteria 1 and 2 are satisfied for a dataset of putative FFL data (i.e., the model satisfactorily reproduces the data with all parameters precisely estimated from them), criteria 3 is applied and the FFL topology is finally selected as active provided that the complete model results in being the optimal model according to the AIC.
3. A Case Study on Adipogenesis
To discuss a practical application of the proposed method, we applied it to miRNA and mRNA expression time series of human multipotent adipose-derived stem cells (hMADS) upon adipogenic differentiation. The initial panel of putative FFLs was selected based on sequence analysis; therefore, it includes also false positive matches and/or FFLs nonactive during adipogenesis.
Data
Two independent cell culture experiments were performed as biological replicates during adipogenic differentiation of human mesenchymal stem cells as previously described (Scheideler et al., 2008; Karbiener et al., 2009). Cells were harvested at the pre-confluent stage as reference (day −3) and at seven subsequent time points during human adipogenic differentiation: day −2 and 0 before, and 1, 2, 5, 10, and 15 days after induction of differentiation. All hybridizations were repeated with reversed dye assignment (dye-swap). Background subtraction as well as global mean and dye swap normalization were applied. The resulting ratios were log2 transformed and the independent experiments were averaged. Complete miRNA and mRNA time-series expression data used for this study conform to the MIAME guidelines and are available in GEO database (GSE29186).
A list of mixed TF/miRNA FFLs was generated by means of a bioinformatic pipeline mainly based on an ab-initio sequence analysis of human and mouse regulatory regions as described in Re et al. (2009) using CircuitsDB (Friard et al., 2010). Briefly, in CircuitsDB, a catalogue of non-redundant promoter regions for protein-coding and miRNA genes in the human and mouse genomes were first constructed (for additional details, see Supplementary Material, available at www.liebertonline.com/cmb). In parallel to that, a catalogue of non-redundant human and mouse 3′-UTR regions for protein-coding genes was defined. A transcriptional regulatory network and, separately, a list of post-transcriptionally regulated genes was then generated for human by looking for conserved overrepresented motifs in the human and mouse promoters and 3′-UTRs previously assembled. The two networks were subsequently combined looking for mixed feed-forward regulatory loops (i.e., all the possible instances in which a master transcription factor regulates a miRNA and together with it a set of joint target coding genes).
Associating to the list of 474 miRNA-mediated FFLs obtained using CircuitsDB with the available miRNA and mRNA time series data, the final dataset consisted of 329 putative FFLs (Table S1) including 33 TFs, 35 miRNAs, and 184 target mRNAs (Supplementary Material is available at www.liebertonline.com/cmb).
Measurement error
The measurement error models for miRNA and mRNA expression data were derived from the replicates, shown in Figure 3A,B, as the mean of the intensities versus their variance. To better define the dependence of the variance on the intensity, the positive x-axis was divided in intervals, and for each interval, the variance mean values were averaged as shown in Figure 3C,D. By fitting Equation (7) on these data, the resulting models are
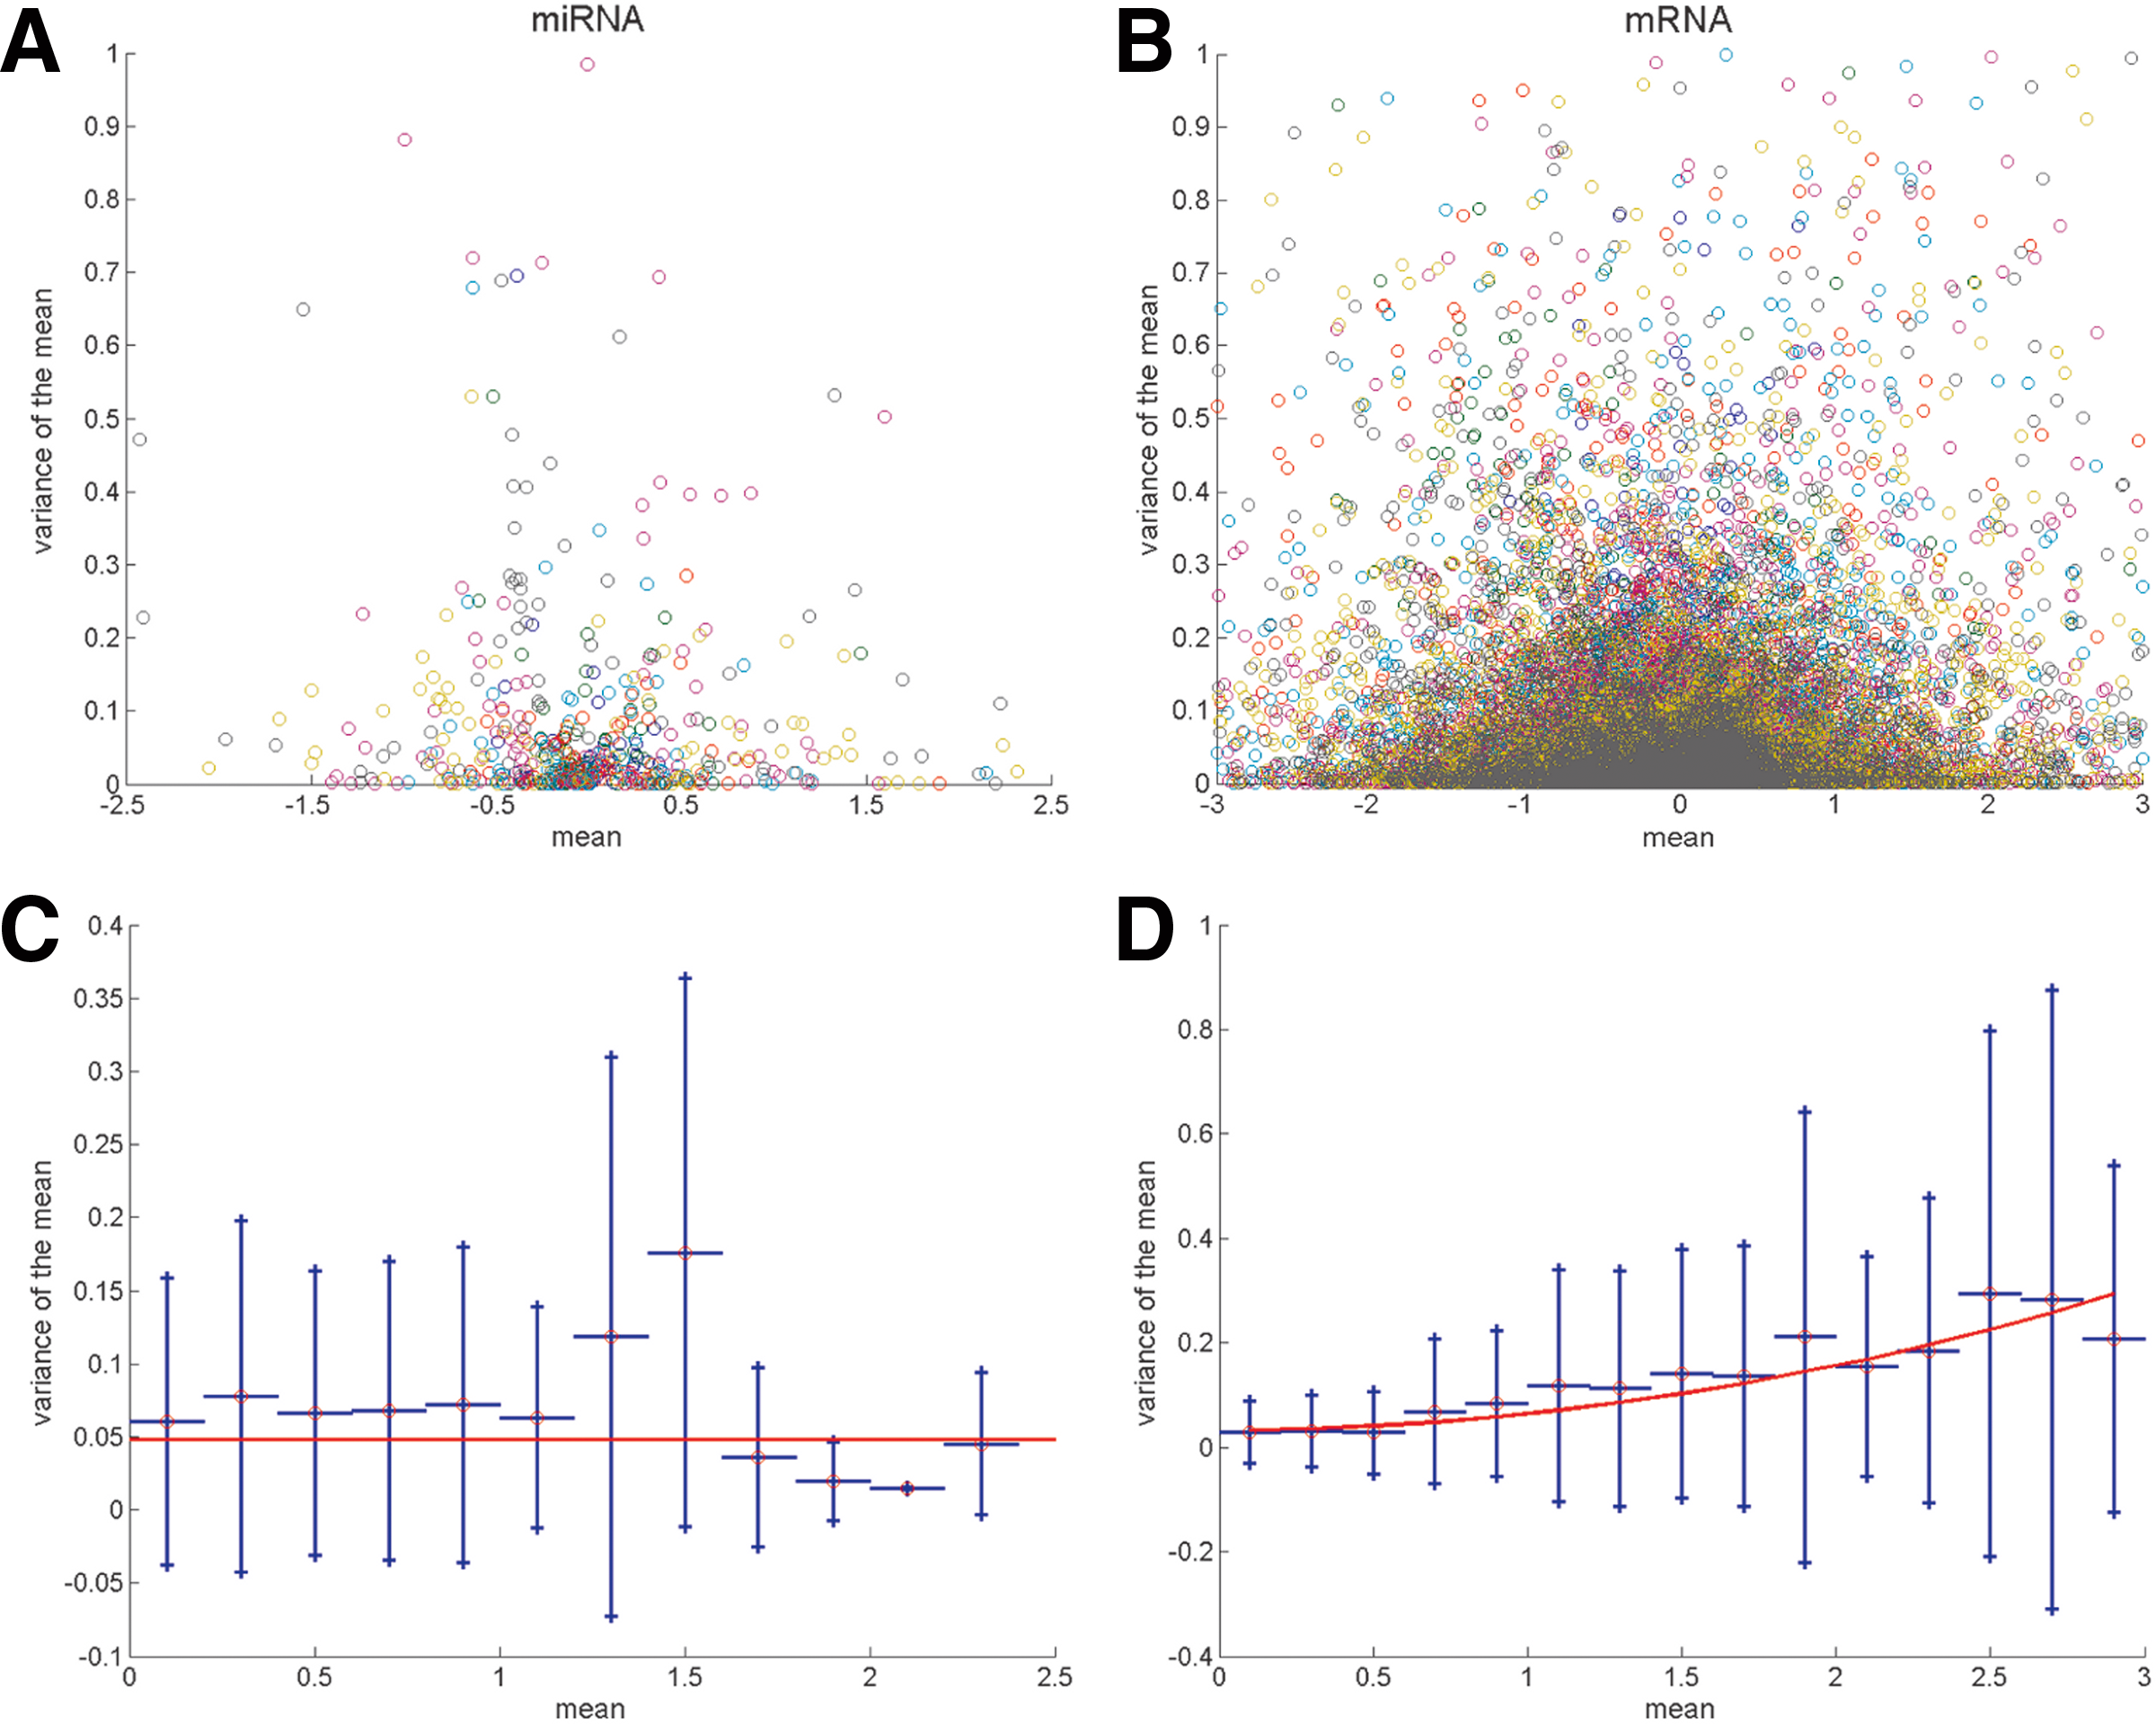
Measurement error variance against expression estimated from the replicates for miRNA
where v2 and vi in Equation (10) are referred to the miRNA and to the mRNA (valid for both TFs, and target mRNAs) datasets, respectively.
Implementation
To assess criterion 1 (i.e., whiteness and amplitude of the residuals), statistical tests could not be applied due to the low number (seven) of samples. Thus, conservative empirical thresholds were set to satisfy criterion 1: both miRNA and target mRNA residuals time series must have at least 3 runs and WRSS divided by the degree of freedom lower than 2. All computations were performed in the Matlab environment (Matlab R2010a); further details are supplied in the Supplementary Material (Supplementary Material is available at www.liebertonline.com/cmb).
4. Results
When the three criteria were applied to M1, no FFLs were selected as active, essentially because criterion 2 failed, indicating that the functional descriptions built in the model were too complex to be resolved from the available data. Conversely, three FFLs were selected with M2 and 23 with M3 as summarized in Tables 1 and 2, respectively, where estimated parameters and their precision are reported. Two out of the three FFLs selected using M2 were identified also with M3; thus, the total number of active FFLs is 24. It is interesting to notice that most of selected FFLs (21 out of 24) are incoherent. This type of FFL is known to play a significant role in biological regulation conferring precision and stability to gene expression regulation (Mangan and Alon, 2003; Wu et al., 2009; Hornstein and Shomron, 2006; Osella et al., 2011). As discussed in Macia et al. (2009), the target gene of incoherent FFLs generally shows a pulser response characterized by a rapid increase/decrease of its concentration followed by the return to a new basal level, while the target gene of coherent FFLs tends to exhibit a grader response characterized by a transient increase/decrease from the initial to the final state. These behaviors were confirmed by our data, as evident from Figure 4, where expression profiles of two incoherent (A) and two coherent (B) FFLs are shown along with the mean target gene expression levels (considering absolute values) between selected incoherent (C) and coherent (D) FFLs. Analyzing the active FFLs from a biological point of view, it was found that, out of the 24 selected FFLs, nine FFLs involve TFs and six involve miRNAs (marked with an x in Tables 1 and 2), which are already known from the literature to be regulators of adipogenesis and adipocyte-related functions. A discussion of the results in comparison with the biological literature is available as Supplementary Material (Supplementary Material is available at www.liebertonline.com/cmb).
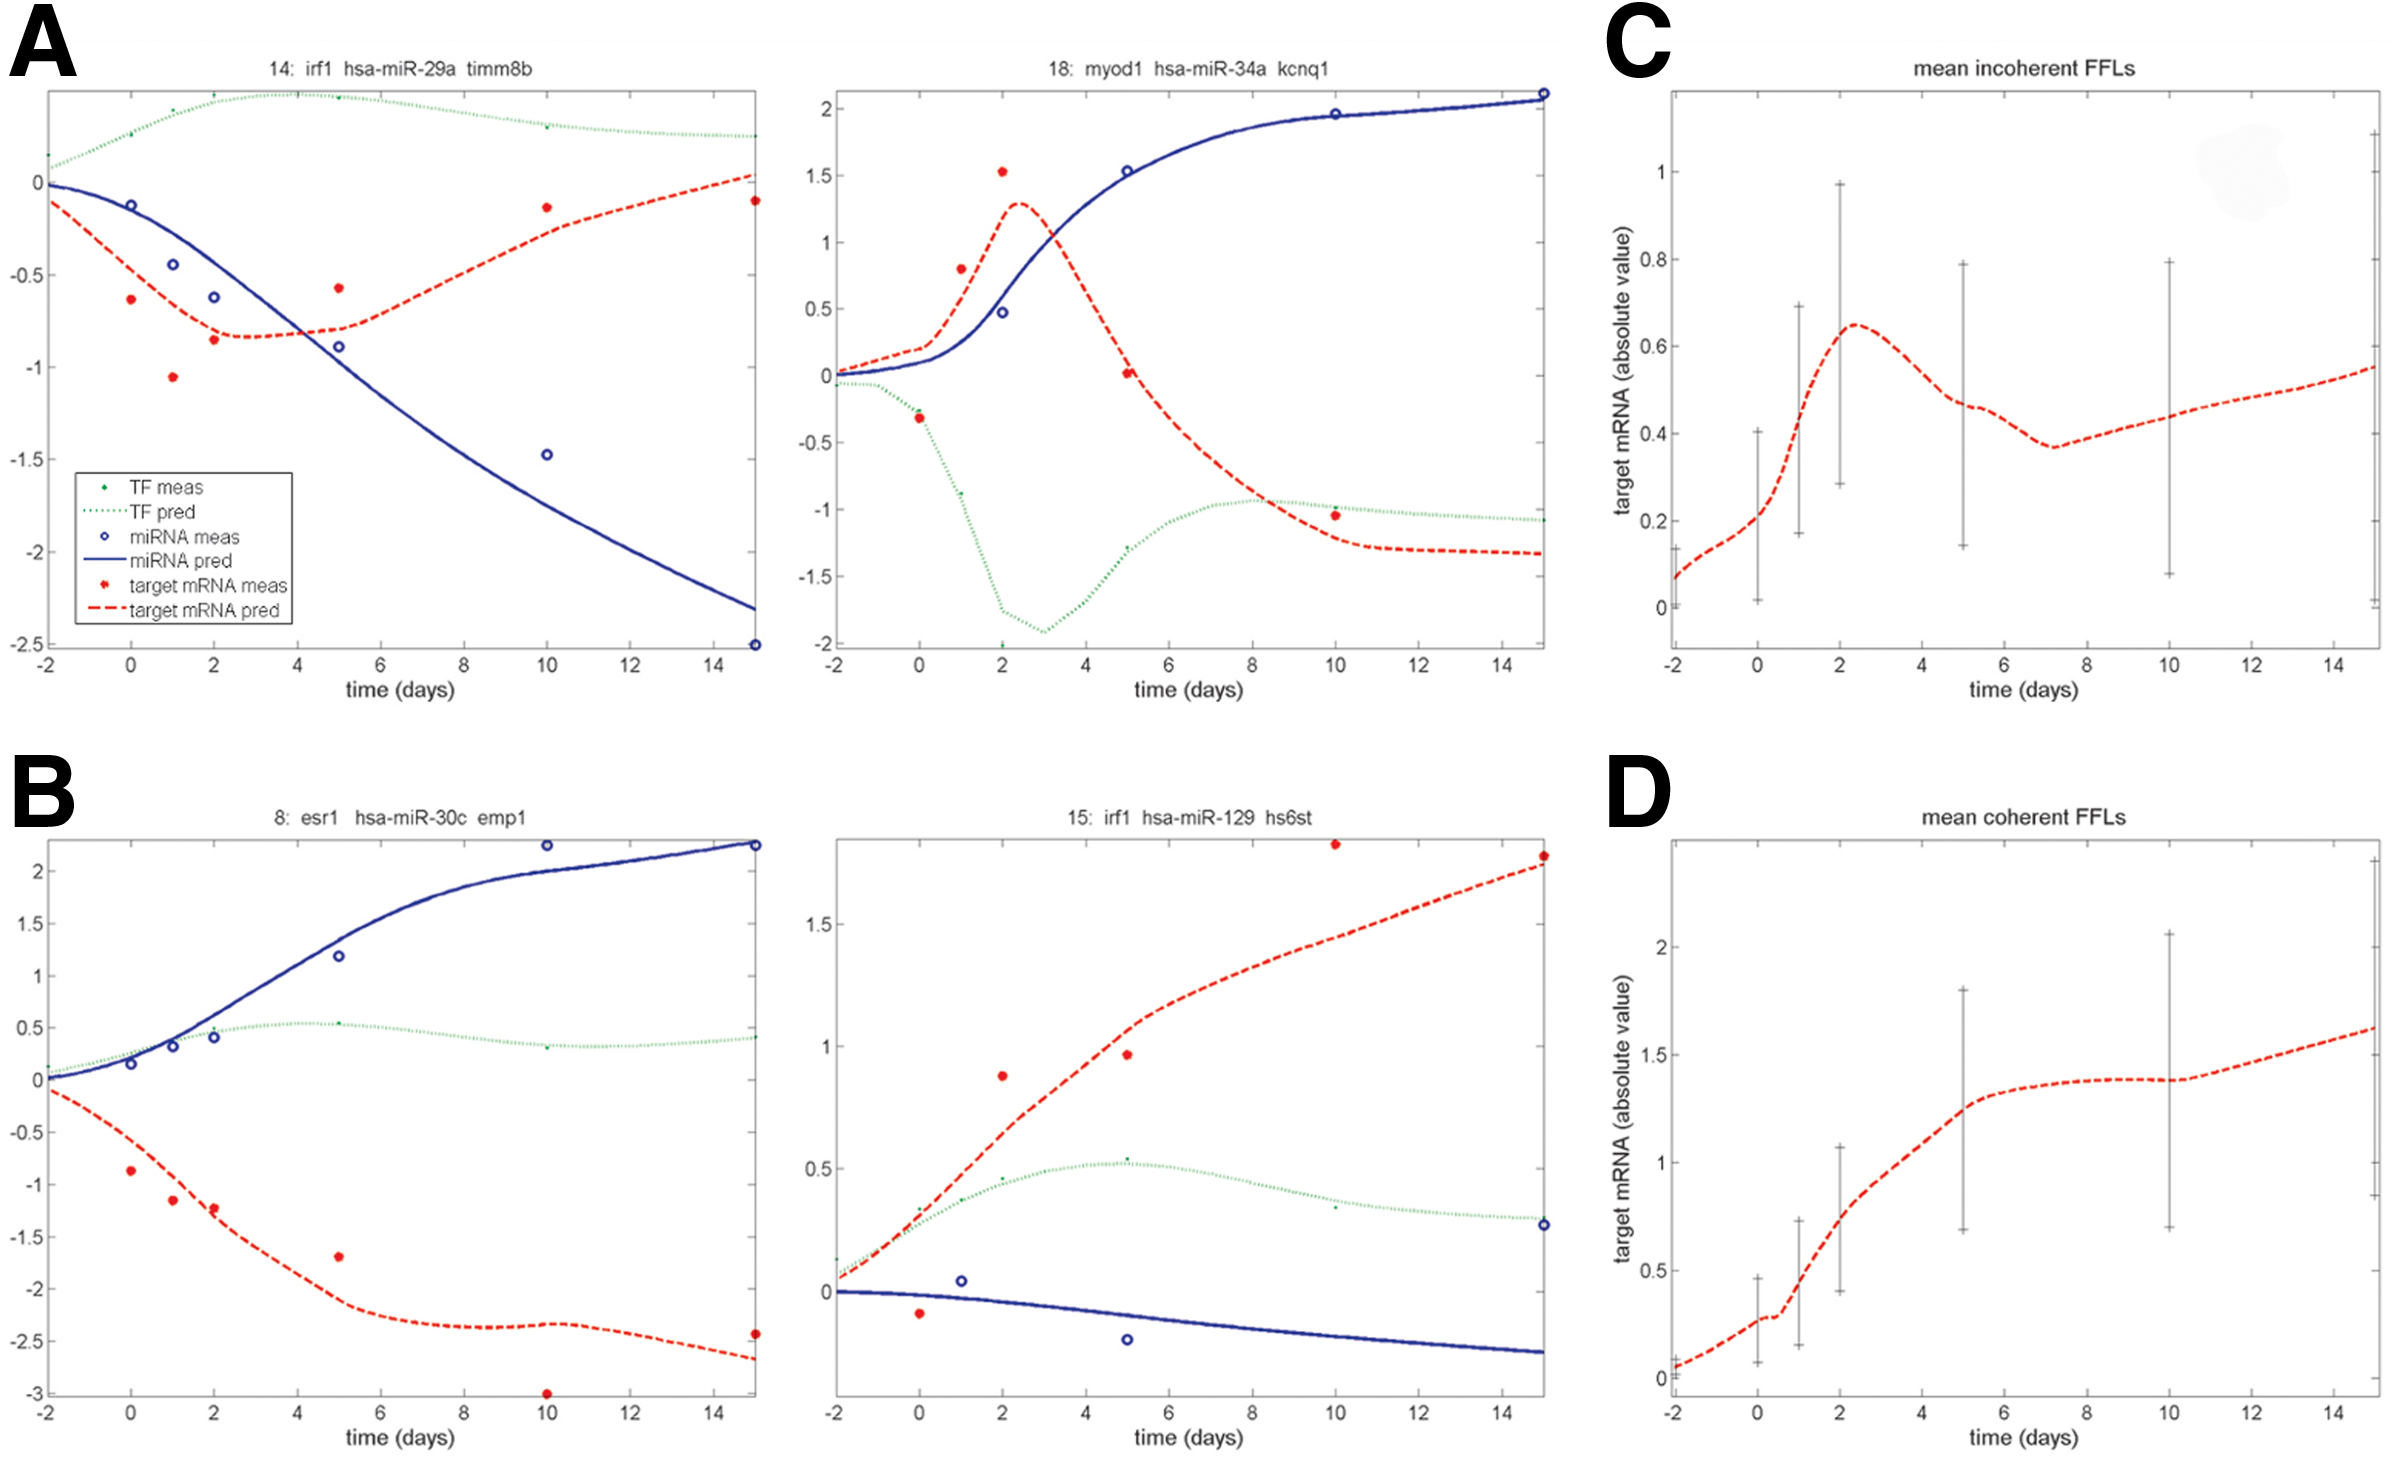
Expression profiles of selected FFLs. TF (green), miRNA (blue), and target mRNA (red) for two incoherent
TF, miRNA, and target mRNA names of selected FFLs using model M2 are reported along with the estimated parameters, their precision in terms of CV, and a flag to distinguish between coherent (C) and incoherent (I) FFLs. TF and miRNA already known to be key regulators of adipogenesis, and adipocyte-related functions are marked with an x. SE, standard error.
TF, miRNA, and target mRNA names of selected FFLs using model M3 are reported along with the estimated parameters, their precision in terms of CV, and a flag to distinguish between coherent (C) and incoherent (I) FFLs. TF and miRNA already known to be key regulators of adipogenesis and adipocyte-related functions are marked with an x. When the estimated degradation parameter (d2) was small and with low precision (i.e., the process was too slow to be determined in the time horizon of the experiment), it was set to 0, and model identification was repeated. SE, standard error.
To estimate the significance of the proposed method, 10 sets of 329 random FFLs were generated choosing at random one miRNA and two mRNAs from the available data. Applying the previously described selection procedure, no FFLs were selected using M2, and an average of 15.6 FFLs, with a standard deviation of 1.5, were selected using M3. Instead, using a simple correlation analysis to choose FFLs having a correlation coefficient above 0.75 in absolute values for all three links, 12 FFLs were selected on the list of putative FFLs, and 18.6 ± 4.6 were selected on the randomized datasets.
5. Discussion
FFL selection procedure
In this work, we propose a method to select active FFLs from a large set of putative ones based on miRNA and mRNA expression time series, using differential equation-based models and identification criteria. A list of putative mixed transcriptional and post-trancriptional FFLs is generated on the basis of conserved overrepresented motifs in human and mouse promoters and 3′ UTR. Identification of three alternative dynamic models, able to describe the miRNA and target mRNA dynamic data based on ordinary differential equations (ODEs) using the TF profile as forcing function, provides the basis for the selection of active FFLs. A putative FFL is selected as active if the feed-forward topology (Fig. 1A), associated with a plausible dynamic description, is necessary and sufficient to reproduce the available gene expression profiles; in other words, the model is able to reproduce data (criterion 1), outperforming with respect to submodels in terms of principle of parsimony (criterion 3), and its parameters can be estimated with acceptable precision from available data (criterion 2).
Comparison of dynamic models
Instead of postulating a univocal description for miRNA and mRNA expression kinetics, three models of increasing complexity are proposed. Model M1 assumes Michaelis-Menten kinetics for miRNA and target mRNA regulation accomplished by the TF, and models miRNA-mediated degradation of the target mRNA as a first order process with constant rate plus a nonlinear term dependent on miRNA and target mRNA expression. In model M2 linearity is assumed for TF regulation on miRNA and target mRNA, whereas nonlinearity is maintained for miRNA-mediated degradation of the target mRNA. In M3 also, the miRNA-mediated degradation of the target mRNA is linearized; thus, the whole model is described by a linear kinetics. The increasing complexity of the models adapts to different type of gene expression data. The choice of the most appropriate model depends on the range and on the number of time points of the available time series and can be made using the same criteria described for the selection of active FFLs: goodness of fit, precision of the estimates and principle of parsimony. In particular, to estimate the Michaelis-Menten parameters of model M1 the whole Michaelis-Menten curve should be observable requiring expression data in an adequate range and sufficiently detailed. If these criteria are not satisfied by the available data, the linearization of the model still provide an adequate fit, allowing also a more precise estimation of the parameters. That does not mean that the more complex model is invalid, but only that the linearized one is more suitable for the available dataset.
Case study
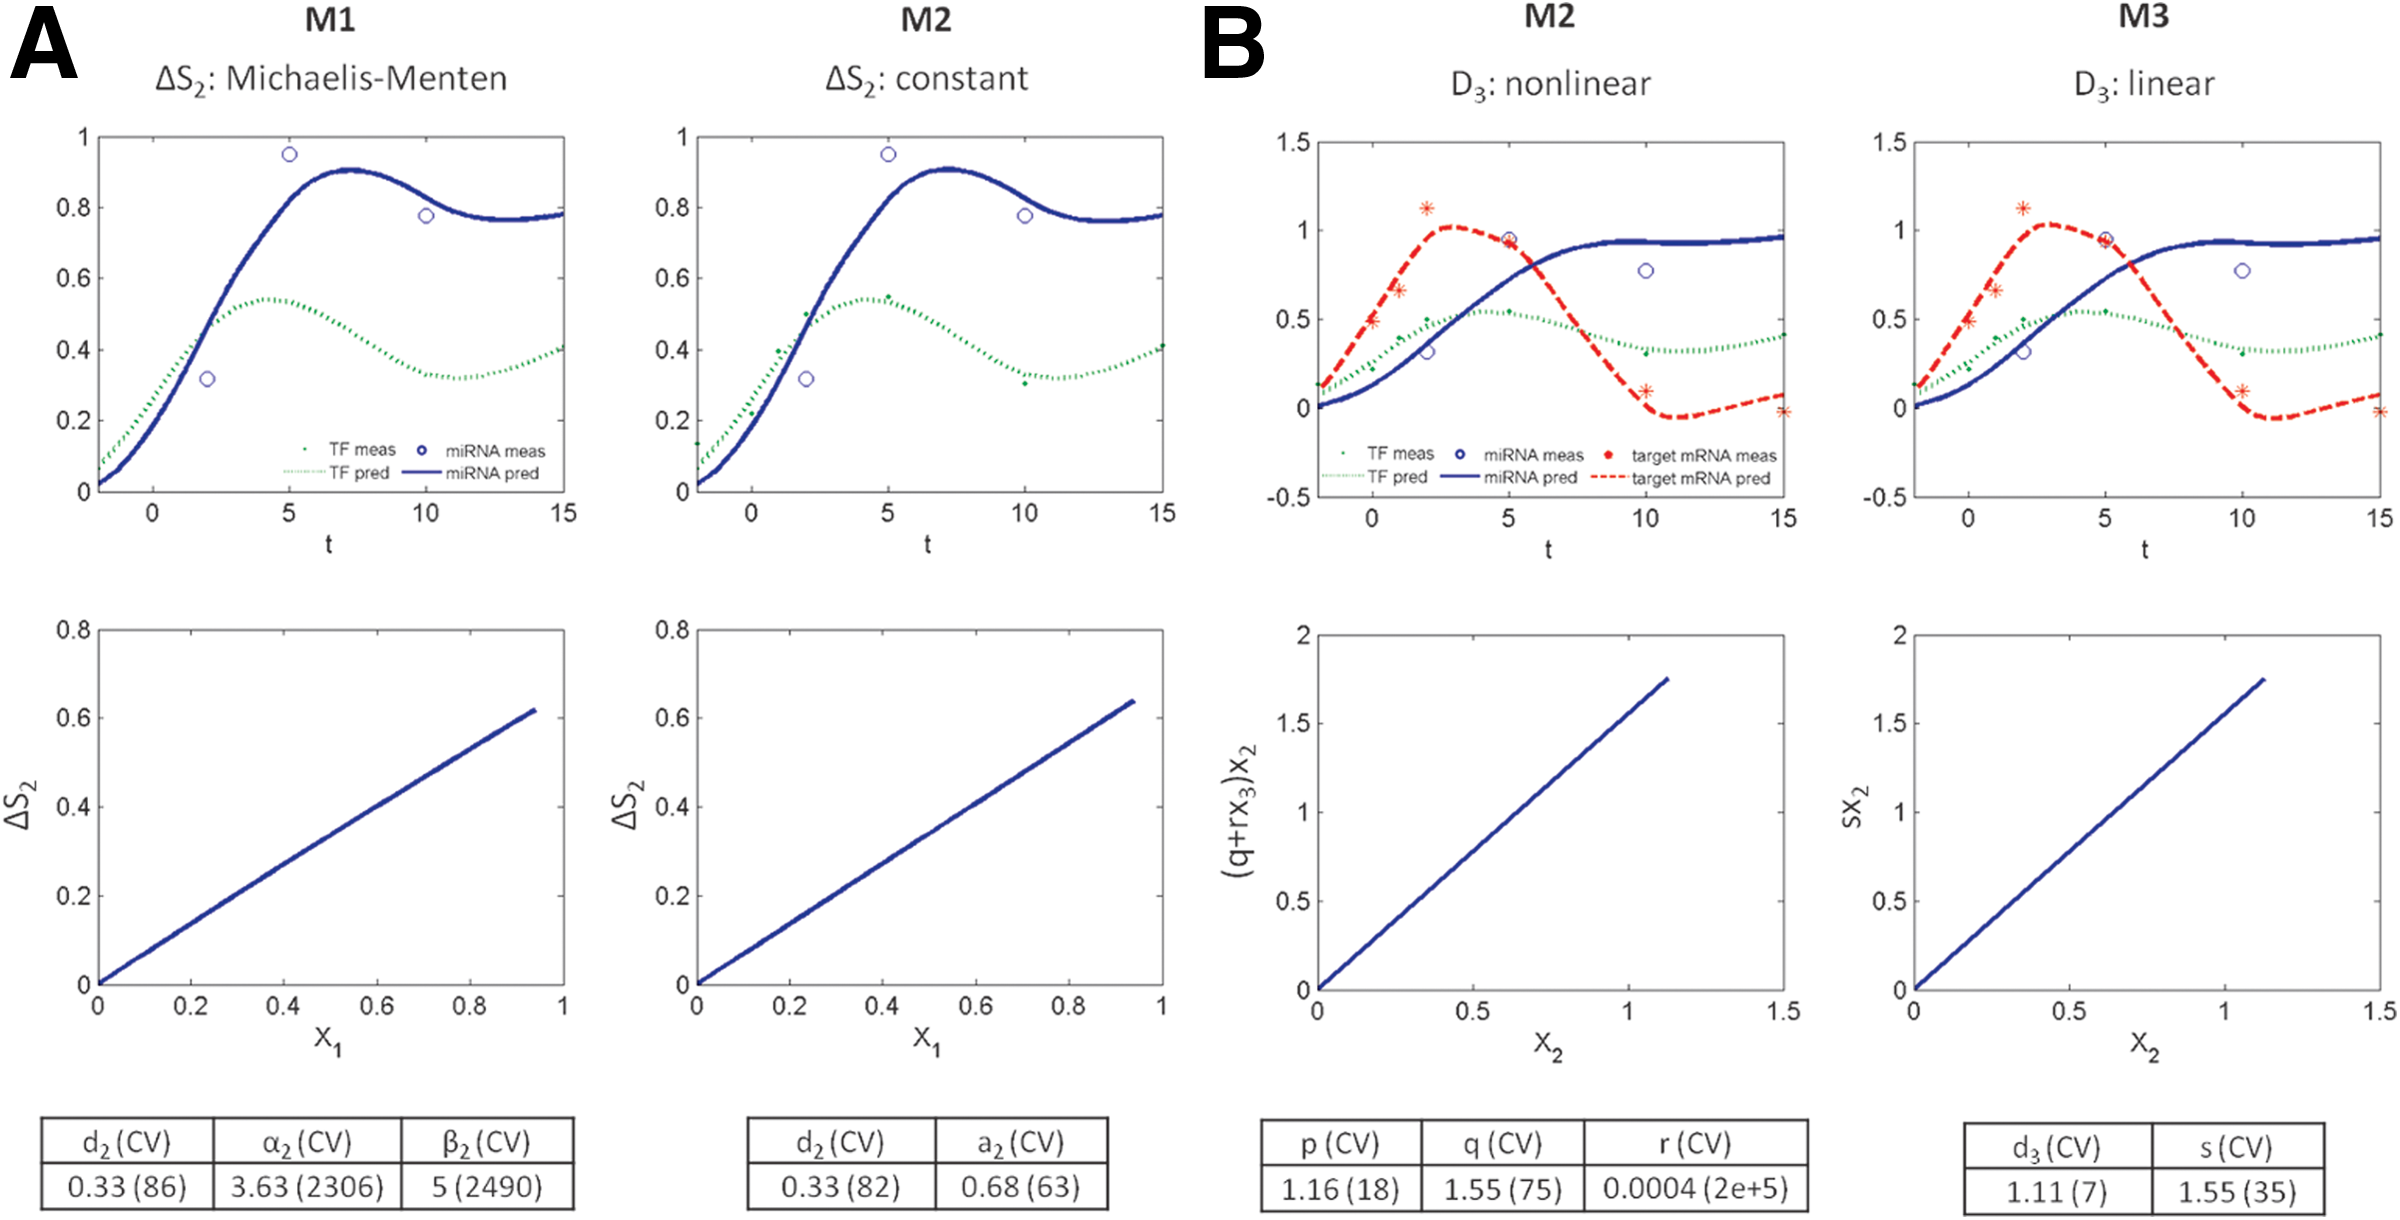
In our case study, we used the three models on gene expression time series to select active FFLs during human adipogenesis. Since they showed a comparable ability to reproduce the data, the simplest model M3 was selected based on the principle of parsimony in 251 out of the 329 analyzed FFLs. Moreover, parameter estimates of model M1 were affected by very high CVs in all FFLs and those of M2 in all FFLs but 3, indicating that nonlinear models M1 and M2 were not a posteriori identifiable. Figure 5 shows the effect of the linearization of the synthesis mediated by the TF (ΔS2), that is, of using model M2 instead of M1 (panel A), and of the subsequent linearization of the degradation of the target mRNA (D3), that is, of using model M3 instead of M2 (panel B). In particular, using the analyzed dataset, the Michaelis-Menten curve is in the linear range (Fig. 5A, left panel) and model M1 is not a posteriori identifiable (α2 and β2 show high CVs). In this case, X1 is much lower than the half saturation constant β2, then parameters α2 and β2 cannot be separately resolved but only the ratio between the two can be estimated. Conversely, using M2 the parameter related to the synthesis mediated by the TF (ΔS2) is a posteriori identifiable (Fig. 5A, right panel). Similarly, for the nonlinear description of the miRNA-mediated degradation rate (Fig. 5B, left panel) parameter r shows high CV and thus model M2 is not a posteriori identifiable. However, since rx3 is much lower than q, the miRNA-mediated degradation rate can be reasonably linearized as in M3 (Fig. 5B, right panel) providing a simplification of the model with a reduced number of parameters and fit comparable to M2.
Comparison between the candidate models.
Analyzing the active FFLs from a biological point of view, it was found that, out of the 24 selected FFLs, nine FFLs involve TFs and six involve miRNAs (marked with an x in Tables 1 and 2), which are already known from the literature to be regulators of adipogenesis and adipocyte-related functions. A discussion of the results in comparison with the biological literature is available as Supplementary Material (Supplementary Material is available at www.liebertonline.com/cmb). However, little information is available in the literature regarding miRNA-mediated FFLs involved in adipogenesis and most datasets such as the ones presented in (El Baroudi et al., 2011) contain mainly information related to cancer. The limited available knowledge about human transcription networks and miRNA-mediated regulations in adipogenesis makes biological validation of regulatory links difficult and, at the same time, highlights the importance of the development of algorithms, like the one presented in this work, to predict testable regulation processes.
The significance of our method was estimated in comparison with random FFLs obtained by randomly selecting links between miRNAs, TFs, and target mRNA. Ten sets of 329 random FFLs (equal to the number of putative FFLs estimated by pairing between the 5′ region of the miRNA and the 3′UTR of the target gene) were generated. When the previously described selection procedure was applied to the randomized set of FFLs, an average of 15.6 selected FFLs with a standard deviation of 1.5 was obtained. This represents a rough estimation of the number of False Positive FFLs among the 24 selected by our method. Let's note that, if instead of differential equation-based modeling, FFLs were selected based on correlation between TF, miRNA, and target mRNA, 12 FFLs would have been selected on the original dataset and 18.6 ± 4.6 on the randomized datasets, thus showing the increased specificity achieved by our approach.
The presented method selects triplets that can be explained by a simple FFL, whose effect can be isolated from the rest of the network, and described by one of the three proposed models. Thus, the presence of possible additional regulatory links is not excluded by our analysis, but, for the selected FFLs, this scheme provides a minimal plausible description of the regulatory interactions. The approach presented here does not allow identifying topologies incorporating more than one TF and/or miRNA. More complex topologies will be studied in future work by extending the approach here developed; however, this will require to collect more informative data, e.g., with a tighter sampling schedule.
Footnotes
Acknowledgments
We thank Prof. Gérard Ailhaud, Dr. Christian Dani, and Dr. Ez-Zoubir Amri for hMADS cells. This work was supported by CARIPARO 2008-2010 “Systems Biology approaches to infer gene regulation from gene and protein time series data.”
Disclosure Statement
No competing financial interests exist.
References
Supplementary Material
Please find the following supplemental material available below.
For Open Access articles published under a Creative Commons License, all supplemental material carries the same license as the article it is associated with.
For non-Open Access articles published, all supplemental material carries a non-exclusive license, and permission requests for re-use of supplemental material or any part of supplemental material shall be sent directly to the copyright owner as specified in the copyright notice associated with the article.