
Abstract
Abstract
The development of automatic approaches for the comparison of protein sequences has become increasingly important. Methods that compare profiles allow for the use of information about whole protein families, resulting in more sensitive and accurate detection of distantly related sequences. In this contribution, we describe a thorough optimization and tests of a profile-to-profile alignment method. A number of different scoring schemes has been implemented and compared on the basis of their ability to identify a template protein from the same SCOP family as a query. In addition to sequence profiles, secondary structure profiles were used to increase the rate of successful detection. Our results show that a properly tuned one-dimensional threading method can recognize a correct template from the same SCOP family nearly as well as structural alignment. Our benchmark set, which might be useful in other similar studies, as well as the fold-recognition software we developed may be downloaded (www.bioshell.pl/profile-alignments).
1. Introduction
Due to enormous experimental efforts, the size of available databases has increased drastically. This imposes a considerable challenge for computational methods. Help has come from novel implementations (Oehmen and Nieplocha, 2006) and hardware development (Blazewicz et al., 2011). Considerable progress has also been made on theoretical grounds. In their seminal article, Gribskov et al. (1987) introduced a sequence profile that is a matrix that contains N × 20 amino acid probabilities and describes a family of protein sequences rather than a single sequence of N amino acid residues. Originally, profiles were used to enhance the search in a database of sequences by means of profile-to-sequence alignment methods. These were in turn generalized by Pietrokovski (1996) into profile-to-profile alignments. Since then a search has been performed as alignments of a query profile with a database of precomputed sequence profiles, where each of these profiles describes a single family of proteins. Progress therefore went through three types of methods: sequence-to-sequence, e.g., B
In this article, we describe the design, optimization, and benchmarking of a protocol that aligns a query protein sequence with a database of protein domains. The main purpose in devising such a computational tool is to provide template structures for comparative modeling protocols. These are based on the assumption that, if similarity between two sequences is high enough, the two proteins share a common fold. Most commonly, comparative modeling methods heavily rely on a query-template alignment. Relevant structural parts of the template are copied to the query according to the alignment. Missing fragments are reconstructed in the subsequent step of the modeling. Reliability of such an approach strongly depends on the quality of the alignment. Therefore, sequence alignment methods used in comparative modeling are usually optimized for alignment accuracy. This however may lower the template detection sensitivity. All the alignment-related problems can be alleviated by a novel comparative modeling method recently proposed by Kolinski and Gront (2007). The method requires only specifying the template structure (or structures, as the method can utilize multiple templates); the a priori alignment is not required. Therefore, in this study, we have optimized an alignment method to maximize the chance for correct selection of a template. To achieve the highest possible sensitivity, we performed alignment of sequence profiles combined with secondary structure profiles. For the sake of speed, we limited ourselves to dynamic programming algorithm with affine gap penalty.
2. Methods
2.1. Benchmark set
The optimization process described in this contribution has been based on the most recent A (i) We considered only these SCOP families that are represented in A (ii) Then, the best four Family representing structures (according A
The procedure resulted in a benchmark set comprising two subsets: train and test (1082 domains each). The former set was used to determine the optimal values for the necessary parameters and the latter one to assess the quality of our method. Any of these 1082 domains may be used as a query in a search for homologues domains. The way that the benchmark set was constructed ensured that there was exactly one correct answer that shared the same SCOP Family with the query. Moreover, the training and testing sets were of the same size, which helped to avoid any bias during the optimization procedure.
In the course of this study, to provide homology sequence redundancy on the 30% level, several additional domains were excluded from the benchmark. In order to keep the benchmark consistent, we also removed all other domains that belong to the same SCOP Family as the problematic ones. The reduced benchmark set therefore comprised two subsets of 935 domains.
2.2. Profile generation
For each domain, a sequence profile was computed by PsiBlast with the following settings: matrix, B
where λ = 0.001, pj is the observed frequency for jth amino acid in a profile column, fj is the frequency of jth amino acid in the whole SwissProt database (Boeckmann et al., 2003) and B62 detones B
A sequence profile computed for an amino acid sequence of NL residues is thus a matrix NL × 20. Its rows represent twenty-dimensional probability vectors, normalized to 1.0. This study also utilizes secondary structure (SS) profiles, which are NL × 3 matrices. The three columns provide the probability of finding a helix, strand, or loop at a given position in the protein. Two kinds of secondary structure profiles were derived for each domain: one computed from the structure by the DSSP program (Kabsch and Sander, 1983) and the other predicted by P
2.3. Scoring methods
During the parameter optimization step, the following profile-to-profile scoring schemes were considered: (1) regular sequence alignment, (2) dot product, (3) L1 score, and (4) Picasso3. The best method with the optimal set of parameters was used in the production version of the protocol.
2.3.1. Sequence alignment
A substitution matrix was used to define the score for aligning the ith position from query sequence and the jth position from the template. A number of substitution matrices (B
2.3.2. Dot product
Dot product (DP), one of the simplest formulas used to assess the similarity between two sequence profile columns ith and jth, is defined as:
where Qk,a or Tk,a is the frequency of the appearance of amino acid a in kth column from the query and the template profile, respectively.
2.3.3. L1-score
L1-score similarity measure is simply the L1 distance between profiles' corresponding columns:
Despite its very simple formulation and great computational efficiency, we are not aware of any study that compares the L1 score with other functions that are commonly used in the field. The function however has been used to guide fragment selection for modeling (Gront et al., 2011) with the Rosetta program.
2.3.4. PICASSO3
This is one of the log-odds based method, introduced by Heger and Holm (2001). The original function is not symmetric, which means that results depend on which sequence is treated as a query and which one as a template. This ambiguity was removed by Mittelman et al. (2003) by introducing a symmetrical score equation for aligning the ith and jth amino acids from query and template sequences:
where pa is the expected frequency of appearance of the ath amino acid, computed in this work by averaging the whole SwissProt database.
2.3.5. Structure alignment
Besides the methods for profile-to-profile alignments, we used a structure alignment algorithm to match the query-template pairs. In a real-life application, the three-dimensional structure for a query protein remains unknown; the structure-based comparison was used in this study as a reference. Since three-dimensional structure provides much more information than just a sequence profile, we had expected it would define the upper bound for profile-based methods and serve as a reference point for the comparisons. Structure alignments were computed with TM-align—a method that employs a heuristic iterative algorithm (Zhang and Skolnick, 2005) which maximizes TM-score, a parameter defined as:
where LT is the length of the shorter protein, LA is the length of the alignment, di is the distance of two corresponding amino acids in the alignment (after structures superposition), and d0 is estimated from the following formula:
2.4. Accuracy measures
Two numerical measures of success were used. The first one, denoted further as a hits ratio (HR), is the fraction of correctly matched Family or Superfamily members for the best scoring query-template pair. In other words, if one wants to assign a given query sequence to a SCOP Family or Superfamily just by copying the annotation of the top scoring template, HR is the chance for this annotation to be correct. The second parameter, Area Under Curve (AUC), measures the area under Receiver-Operator Curve (ROC). AUC quantifies the probability of scoring a randomly chosen positive case higher than a negative one (Fawcett, 2006). A random predictor would feature AUC = 0.5. The first criterion fit the overall purpose of our work better; hence, it was used as the criteria for all the parameter optimization procedures. The second parameter was used for additional characterization of the results.
2.5. Implementation and optimization
In the optimization process, any domain from the train subset was aligned with any other domain in this set, which required 935 × 934 alignment calculations. Subsequently, Family HR was reported based on these 935 cases. This procedure was applied to assess any alignment scheme attempted in the experiment. An alignment scheme is defined by two affine gap penalty parameters (open, extend) and a scoring system: one of the four profile-to-profile similarity measures or one of several substitution matrices. Moreover, each of these combinations was used both in a global and in a local alignment mode. An example of such an optimization for a single scoring method is shown in Figure 1, which presents the Family HR value as a function of affine gap penalty parameters. Each square in this plot denotes the HR found after 935 × 934 local alignment computations with Picasso3 scoring scheme. In order to test all the combinations of the parameters, the optimization required the all-versus-all profile alignment procedure to be performed more than 1500 times. Each of these runs resulted in a single Family HR value. The best scoring sequence-to-sequence alignment as well as the best scoring profile-to-profile alignment were also assessed on the test subset. All these alignment calculations as well as data analysis were performed with BioShell package (Gront and Kolinski, 2006, 2008). In fact, after initial tests, the relevant BioShell routines were optimized, which resulted in significant reduction in the CPU time required for this project. In addition, all-versus-all structural alignments were computed with TM-align program. Based on obtained TM-score values, HR and AUC parameters were evaluated in the same manner as for the sequence-based alignment.
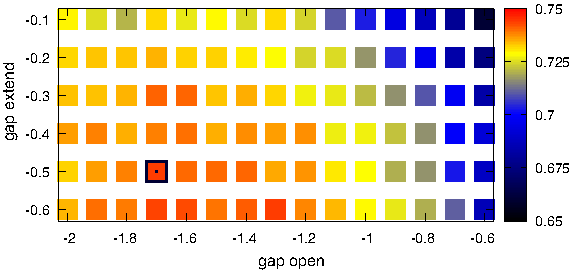
Optimization of gap penalty (open, extend) parameters (x and y axis, respectively). Color scale denotes Hit Rate at Family level. A square corresponding to the best performing parameters' combination is marked with a black border.
3. Results And Discussion
The performance of profile-to-profile alignment methods has been discussed previously (Ohlson et al., 2004; Wang and Dunbrack, 2004). Although the benchmark set as well as the optimization procedure utilized in this experiment differs considerably from previous studies, in general our findings summarized in Table 1 agree with the previous results. The first section of the table presents the best results obtained after exhaustive optimization of gap parameters, the second part (i.e., the last three rows) provide validation on the test set. Each method was applied both in global and local alignment (
Assessment of the scoring schemes:
In the course of optimization, we found B
In general, these are the results one could expect before conducting the experiment. The most unexpected result however comes with the performance of structural alignment, which is very well comparable to the Picasso3+SS combination, according to the HR parameter. Note, however, that HR is based only on the best scoring query-template pair. On the contrary to HR, according to AUC parameter structural alignment is still better than any other method. In fact, structural alignment tends to rank the correct query-template pairs higher than the best profile alignment method. The latter one however has been extensively trained to maximize the first-rank hits rate. The ability for ranking the correct query-template pairs of the two methods: Picasso3+SS and structure alignment have been compared in the Figure 2. The x and y axes provide the rank of a correct query-template pair as assigned by Picasso3+SS and structure alignment, respectively. Each point in this plot represents a bar of a two-dimensional histogram aggregating the ranked pairs. The highest peak in the histogram is located at (1,1) and represents all those correct query-template pairs which both methods (Picasso3+SS and structure alignment) managed to rank at the first place. There are also other bars on the x (y) axis. They correspond to the pairs which only structural alignment (only Picasso3+SS, respectively) ranked best. The points scattered over the plot tend to locate in its lower triangle which confirms that structure alignment assigns better ranks to the correct pairs than Picasso3+SS. Besides the differences in ranking abilities, the two methods offer similar performances.
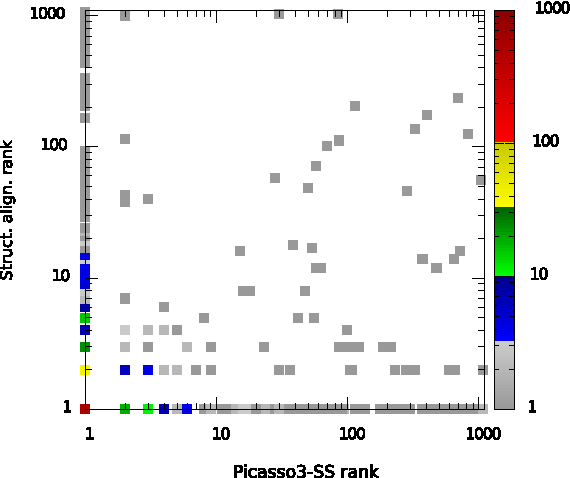
Comparison between the best method, Picasso3 + secondary structure (Picasso3-SS), with a structural alignment. This two-dimensional histogram shows at x = i and y = j how often a correct query-template pair of two proteins from the same family has been ranked as ith (jth) by Picasso3-SS (structure alignment), respectively.
Another interesting finding is the good performance of the L1 score. Despite its very simple formulation, it achieves HR on the Family level just 7% lower than the best method, Picasso3, and it might be considered for applications where high computational efficiency is required.
4. Conclusion
In this contribution, we described an optimization and benchmarking of a profile-to-profile alignment method. The carefully derived benchmark set we used in this study can be freely downloaded (www.bioshell.pl). For each protein domain, the archive provides a structure in PDB format, a sequence profile, and two secondary structure profiles (predicted by P
The fold recognition method that we developed in this study allows rapid assignment of SCOP Family or Superfamily to a given query sequence with a success rate close to the one achieved by structural alignment. This can be understood from the point of view of how evolutionary relationship is defined in the SCOP database. Homology between proteins is evaluated based on sequence analysis and then manually curated. It expresses the fact that, at least in some cases, the structure similarity is neither the strongest nor the only signal for common origin of two proteins. This can also suggest that fold recognition algorithms have already achieved a fair level of maturity, and there is small room for further improvement (at least on the benchmark posed by this study). There are however two other very important issues that have not been addressed here: (i) assessment of statistical significance for a given result and (ii) alignment quality. As for the first problem, we assumed that the set of templates always contains the correct answer, that is a member of the same SCOP family as the query. Our benchmark set, due to the way it has been constructed, obviously satisfies that assumption. The assumption will also hold true in the majority of real-life application since the protein fold space is already well covered by structures determined experimentally. Finally, the problem of the actual alignment between query and template proteins will be handled by an algorithm used for construction of a structural model for a query protein.
Footnotes
Acknowledgments
This project has been funded from the TEAM/2011-7/6 Iuventus Plus research grant.
Disclosure Statement
No competing financial interests exist.