
Abstract
Abstract
Here we present an in-depth analysis of the protein age patterns found in the edge and triangle subgraphs of the yeast protein-protein interaction network (PIN). We assess their statistical significance both according to what would be expected by chance given the node frequencies found in the yeast PIN, and also, for the case of triangles, given the age frequencies observed in the currently available pairwise data. We find that pairwise interactions between Old proteins are over-represented even when controlling for high degree, and triangle interactions between Old proteins are over-represented even when controlling for pairwise interaction frequencies. There is evidence for negative selection of interactions between Middle-aged and Old proteins within triangles, despite pairwise Middle-Old interactions being common. Most triangles consist solely of vertices with high degree. Our findings point towards an architecture of the yeast PIN that is highly heterogeneous, having connected clumps which contain a large number of interacting Old proteins along with selective age-dependent interaction patterns. Supplementary Material is available online (www.liebertonline.com/cmb).
1. Introduction
PINs are thought to be modular, highly organized as well as efficient and robust (Vespignani, 2003; Valente and Cusick, 2006; Klemm and Bornholdt, 2005). Although the modularity of cellular networks is a well-established concept, little is known about the modules and their significance. These modules span multiple scales, ranging from communities and pathways to small subgraphs (Lewis et al., 2010), sometimes also referred to as motifs. The age of motifs often implies a judgment on its over-representation in the network (Milo et al., 2002).
In order to concentrate on meaningful modules, a statistical model for PINs which is appropriate for modelling the occurrence of small subgraphs would be very useful (Artzy-Randrup et al., 2004). Such a model would also allow the assessment of conjectures based on small subgraphs such as threshold behavior (Rito et al., 2010) whilst increasing our biological understanding of the interplay between proteins. While there is an abundance of network models available, we have not succeeded in finding a model which satisfactorily matches both the degree distribution and the number of 3-node cliques (triangles) of real PINs; the models we tested include ErdŐs-Rényi random graphs with fixed degree distribution, stochastic block models, exponential random graphs, geometric random graphs, random intersection graphs, a Barabási-Albert preferential attachment model, and a duplication and divergence model (Bebek et al., 2006). Rito et al. (2010) reports the results for some of these model fits. The lack of good models is likely to reflect a lack of understanding of the underlying network.
Several high-throughput studies in Saccharomyces cerevisiae (yeast) contribute to make its interaction data the most extensive and, to date, the most complete eukaryotic PIN existent (Jensen and Bork, 2008; Sambourg and Thierry-Mieg, 2010). Hence, in this article we focus on yeast. To increase our understanding of the network topology, it is reasonable to include explanatory variables for interactions. Guided by the principle that cell biology should be viewed in the light of evolution, we concentrate on one evolutionary explanatory variable where previous correlations with interactions have been found—protein “age”. The age of a protein is an abstract theoretical concept of little importance for the organism and there is no single, optimal way of estimating the “age” of a protein. Here, as a proxy for age, we use lineage specificity (Winstanley et al., 2005) based on InParanoid's (Östlund et al., 2010) ortholog identification. Lineage specificity ranges between 0 and 1, where 0 is assigned to a protein which is only present in yeast, or in yeast and a few other highly related organisms on the same branch as yeast, and 1 corresponds to a protein whose appearance can be traced to the most recent ancient branching of the tree under consideration. In view of the distribution of lineage specificity we declare proteins with a lineage specificity of at least 0.8 as “Old,” those with a lineage specificity of at most 0.2 as “Young,” and the ones in the middle as “Middle-aged.” Other age assignments are possible; the approach by Kim and Marcotte (2008), which we also consider, assigned Pfam domains to each protein in yeast and took its taxonomic distribution as the age groups. According to its youngest Pfam domain, a protein can then be classified as ABE, AE/BE,E and F, where ABE is the oldest age group including proteins found in Archae, Bacteria, and Eukaryota, and F the youngest, only including Fungi-specific proteins.
In this article, we provide an in-depth analysis of protein age patterns found in edges and triangles of the yeast PIN. We assess their statistical significance according to what would be expected by chance alone given the age frequencies found in the PIN and also, for the case of triangles, given the age frequencies observed in the currently available pairwise data. To our knowledge this second approach has not been applied previously, although it seems more natural as we have not only information on node frequencies, but also detailed information on the types of interactions we currently observe. When analyzing the relationship between network models and age-dependent interaction patterns, Kim and Marcotte (2008) focused on interaction pairs and on the propensities of proteins in similar age groups to interact with each other. They found that the interaction density is highly protein age-dependent. Liu et al. (2011) considered age patterns found in network motifs, but only reached the coarse-grained conclusion that proteins of the same age group tend to form motifs which are functionally homogeneous and densely interconnected. Qin et al. (2003) also looked at the interaction patterns within and between age categories using a randomization protocol as a null model which shuffled age assignments to nodes while fixing the node frequencies (Maslov and Sneppen, 2002); they find support for a PIN which conserves age-homogeneous clusters and whose topology depends on the evolution of the organism.
As there is a positive association between age and degree (Winstanley et al., 2005), we also investigate whether the patterns change when restricting attention to proteins with high degree, and equally when restricting attention to proteins with low degree.
Given the large amount of data, many of our tests indicate significant differences from what would be expected given the node frequencies, and from what would be expected given the edge frequencies; hence we focus on the most highly significant differences. These are, across data sets, firstly, that Old-Old edges and Old-Old-Old triangles are highly over-represented. Secondly, triangles with edges involving one Middle-aged and one Old protein are highly under-represented. Thirdly, 83% of all triangles consist of proteins with degree at least 10. We dispense with the notions that proteins like to interact with proteins of the same age, and that high-degree proteins are connected to many low-degree proteins in a star-shaped fashion. Instead our findings lead to viewing the PIN as highly heterogeneous, with dense regions containing a large number of Old proteins, and with complex selection patterns.
2. Results
We first discuss the notion of relative age and describe its distribution across all proteins in the proteome of yeast. Then we compute age-dependent edge and triangle frequencies and assess whether the observed patterns can be explained by protein age frequencies alone. Next, we assess whether the observed triangle patterns can be explained by the relative frequencies of protein interactions alone. To control for degree as a possible confounding factor, we repeat the analysis considering only the interactions amongst high-degree proteins. We mainly present results for the Database of Interacting Proteins (DIP) dataset and for a single categorization of protein age, although we also consider the high-confidence DIP-CORE PIN and different age categories; as our findings are fairly robust, we only mention the latter data sets when their patterns deviate from the patterns in DIP.
2.1. Distribution of protein ages and categorization
The relative age of 5,884 proteins in the proteome of yeast was calculated by lineage specificity using the normalised tree and ortholog identification of InParanoid. The distribution of protein ages is presented in Figure 1. Proteins where no annotation was available due to conflict of nomenclature and proteins for which no interaction data was available were omitted, yielding 4,769 proteins. We bin the ages in this distribution into three categories: “Old” proteins, which tend to have relative age values near 1 and are therefore represented in most genomes considered; “Young” proteins, with age values near zero which are specific to yeast or yeast and highly related species; and “Middle”-aged proteins, those which are neither “Old” or “Young.” In DIP, this assignment yields 1,706 Old proteins, 1,917 Middle-aged proteins, and 1,146 Young proteins. While the boundary separating Old and Middle-aged proteins is clear and unambiguous, the cut-off value that separates Young and Middle-aged proteins is less so, thus we test variation in this boundary and find that our conclusions are robust.
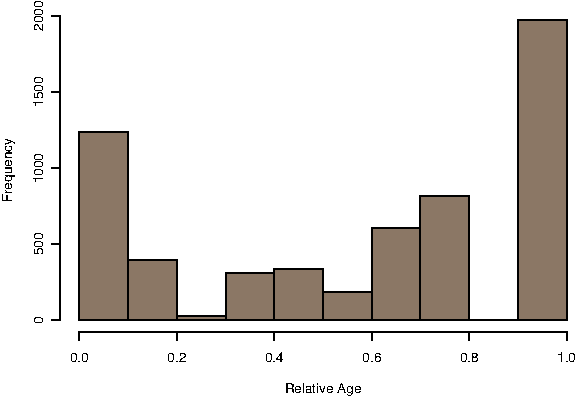
Distribution of the relative protein age of 5,884 proteins in the yeast proteome. Middle-aged proteins are defined as the ones with relative ages greater or equal to 0.2 and less than or equal to 0.8. Proteins above or below this cut-off are put in the Old or Young set, respectively.
The three protein age sets possess very different connectivity patterns in the PIN. Figure 2 depicts a box plot (outliers were not plotted) showing the variation in degree distribution for the categories; the degree of a protein is simply its number of interactions. In agreement to what has previously been found (Wuchty et al., 2003), older proteins have, on average, a higher degree than younger ones. It was also shown that high-degree proteins tend to be old (Winstanley et al., 2005). Biologically, old genes have been loosely associated with large protein size, strong selection pressure as well as high intron density and expression level (Wolf et al., 2009).
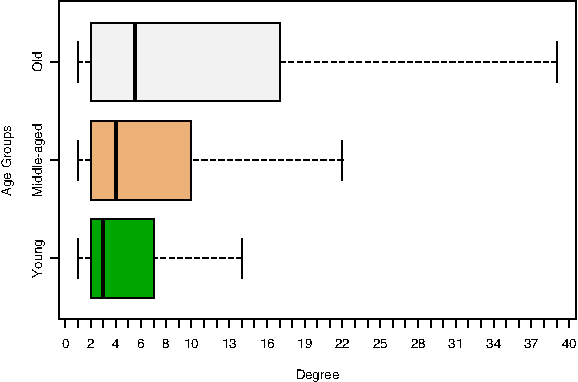
Degree distribution for the yeast proteins in each age category. For each age set the middle line represents the median of the data and the bottom and top of the box correspond to the 25th and 75th percentile, respectively. The bottom and top whiskers represent the lowest/highest datum within 1.5 times the interquartile range of the lower/upper quartile, respectively. Outliers are not plotted. For the Old set of proteins, there are 123 proteins above degree 39 (top whisker), the highest degree of this set is 229. For the Middle-aged set, there are 184 proteins above degree 22, the maximum degree value is 281. For the Young set, there are 105 proteins above degree 14, of which the most extreme value is 98.
2.2. Pairwise interactions
Given the higher average degree of Old proteins, it is perhaps unsurprising to find that about 60% of all interactions happen between Old and Middle-aged or Old proteins. Figure 3A depicts the observed age-labelled pair frequency and, for comparison, the corresponding expected frequency under a model which assumes that the node frequencies can explain the edge frequencies; this is the node frequency model. Despite the differences between observed and expected frequencies giving, for all cases, a significant p-value under a Chi-squared test, caution in the interpretation is advisable as with large amounts of data even small departures from the null hypothesis, with relatively no relevance given the overall pattern, may be highly significant (Cox, 2006, pg. 42). We find that while the product of the nodal frequencies does not predict the interactions very well for most types of interactions, the most striking deviation is that Old proteins interact far more frequently with Old proteins than expected (so that most of the other types of interaction are just slightly under-represented). The runner-up of highly over-represented interactions in DIP is Middle-Old, but this results is not replicated in the high-confidence DIP-CORE dataset. Several previous studies have reported a preference for proteins of the same age to interact with one another (Wuchty et al., 2003; Liu et al., 2011). If we collapse our data to consider only two types of interactions, those between proteins in the same age categories and those between proteins of different categories, we replicate this result; see Supplementary Material (available online at www.liebertonline.com/cmb). Our more detailed results reveal that the same-same interactions are driven solely by the over-representation of Old-Old interactions in the dataset; Young-Young and Middle-Middle interactions are actually slightly under-represented. This finding is robust when removing interactions found by tandem-affinity purification coupled to mass spectrometry (see Supplementary Material). The results vary slightly when the age definitions by Kim and Marcotte (2008) are considered; then all of Old-Old, Middle-Old and Middle-Middle are over-represented, suggesting that in mapping between the ages there is overlap between our definition of Old and the Middle-aged and Old proteins under Kim and Marcotte (2008).

Age-dependent patterns in the pairs and triangles of the yeast PIN. (
2.3. Triangle patterns
In view of the high clustering coefficients of PINs (Gibson and Goldberg, 2011) and the importance of triangles in interaction and function prediction (Chen et al., 2008), we now consider the age patterns on triangles. We identified the 18,274 triangles present in the complete DIP dataset. These were split according to the combination of the different age-categories of their constituent proteins. Figure 3B shows the observed absolute frequencies of all types of triangles formed from our three-way age classification in blue. Triangles between Old proteins and triangles between a Middle-aged protein and two Old ones account for over 50% of the total number.
At the level of triangle subgraphs we observe a repeat of the patterns seen in interactions; compared to what would be expected under a node frequency model (red in Figure 3B), Old-Old-Old triangles (like Old-Old interactions) are highly over-represented. To assess whether this over-representation of Old triangles could be due to the large number of Old-Old interactions, we compare the observed counts to the counts which would be expected under an edge frequency model. The results of this comparison are shown in purple in Figure 3B. All the differences are significant under a Chi-squared test, pointing to a network that is far from forming its interactions at random. Old triangles are over-represented compared to node frequencies and, once again, the proposed homophily is driven by Old-Old-Old triangles. However, when we take edge frequencies into account, not only are all triangles involving proteins of the same age group over-represented, but so are all triangles involving a Young protein (apart from the Old-Middle-Young case). Given these patterns, homophily may be misleading. The pattern here is rather that all triangles which contain at least one Middle-Old edge are consistently under-represented, suggesting some from of negative selection for such triangles, especially for the Middle-Old-Old triangles. These results are also valid for DIP-CORE. Age-dependent triangle patterns based on the age definitions of Kim and Marcotte (2008) show deviations due to the age differences, but we still observe Old-Old-Old over-representation, and Middle-Old-Old under-representation under the edge model. While evolution suggests many Middle-Old interactions in order to maintain relative stability of the network, evolution may nudge proteins to find new interaction partners among the same age group. Young proteins may not have had enough time to find new interaction partners.
2.4. The influence of high-degree proteins on age patterns
PINs have a broad degree distribution (Khanin and Wit, 2006) with a relatively small number of proteins having high degree. As high degree proteins tend to be older (Winstanley et al., 2005), high degree could provide an alternative explanation for the over-representation of patterns involving Old proteins. To control for high degree, for the DIP database, we generate two sets of proteins, those with degree greater or equal to 10 (DIP_10) and those with a degree greater or equal to 25 (DIP_25). For each set, we rebuild the network, considering only the interactions between proteins within the set. We also select the complementary sets of proteins which we call Anti_10 and Anti_25. Even with the partition of the dataset, Old-Old edges are over-represented given the node-frequencies in all of DIP_10, DIP_25, Anti_10 and Anti_25 (although in the last two cases Middle-Middle and Middle-Old are also over-represented, respectively). We conclude that high degree does not fully explain the over-representation of Old-Old.
Over 83% of all triangles are observed between high degree proteins (greater or equal to 10 interactions), suggesting that the current notion of hub proteins does not capture the network. Hubs are often thought of as high-degree proteins connected to proteins of far lower degree. Here we observe instead that high degree proteins are connected to proteins of similar high degree. This suggests that the PIN contains many dense clusters of high degree proteins connected via lower degree proteins.
Concerning age-dependent interactions, in high degree triangles we still observe the over-representation of Old-Old-Old triangles, but now it is only triangles with two Middle-Old edges that are under-represented under the edge model (this pattern is seen for both DIP_10 and DIP_25, notably for Middle-Old-Old). Even for triangles between low-degree proteins (Anti_10), Old-Old-Old triangles are over-represented (under both node and edge models) but now, alas, the only other pattern that is significant is the over-representation of triangles between proteins of the same age groups, under the edge model. These patterns are also seen for Anti_25.
3. Discussion
There are two caveats that come with our analysis, one related to the definition of age and the other with the effects of errors in the PIN.
Our age definition is a measure of lineage specificity dependent on sequence homology. Here we do not take the uncertainty in tree reconstruction into account; for statistical issues regarding tree reconstruction see for example Tavaré (2004). Moreover, if a particular protein family diverges rapidly, we would not recognize its members across multiple species by sequence similarity; thus, proteins with a Young age may contain new proteins alongside members of old protein families that are rapidly diverging. Conversely, the Old proteins set will tend to contain proteins from relatively stable, in sequence terms, protein families. It is hence possible that the behavior of Old proteins described here is instead the behavior of sequence-stable proteins.
The PIN itself is the other potential confounding factor. It has been extensively reported (Sprinzak et al., 2003; Huang and Bader, 2009; Deane et al., 2002) that PINs contain a large number of false positives and also a potentially even larger number of false negatives (Ali and Deane, 2010). The node frequencies are calculated from the relatively error-free genomic data, whereas edge and triangle frequencies rely on the PIN. Thus, the observed differences could be due to the error strewn PIN. While we have chosen to work with the yeast DIP data because the yeast PIN is thought to be the most complete currently available, even for yeast the dataset is far from complete (Sambourg and Thierry-Mieg, 2010).
It is reasonable to ask how our findings relate to biological models such as that of gene duplication and divergence. We consider the version of this model proposed by Bebek et al. (2006). Using as seed a sub-network of DIP consisting of all of its Old proteins and interactions between them, we grow networks up to the order and size of the full DIP data set and compare their age patterns with that of the DIP. Although we observe significant differences in the various age-dependent types of both edges and triangles, the general pattern is maintained in the edges, whereas the number of triangles and the proportions between the different types is strikingly different from DIP (see Supplementary Material). The resulting networks have less than 50% of the number of triangles found in DIP. The observed pattern cannot be explained by this gene duplication and divergence model and hence there is reason to assume that the underlying biological mechanism of edge formation is more complicated than that of gene duplication and divergence alone. Further studies are therefore needed to understand how these age-dependent patterns come to be and the limitations which they impose on available functional topologies for the network.
Our results support the idea of a stratified, highly heterogeneous network with highly connected clumps of Old proteins. As an example, Figure 4 shows a so-called ego-network centred on YFL021W, a transcriptional regulator associated with multiple nitrogen catabolic genes; the ego-network shows the protein itself, its interacting partners, and the interacting partners of those interacting partners—all proteins within graph distance 2 of the original protein. The prominent clump of Old proteins on the right-hand side of the figure contains proteins associated with the GO term “proteolysis involved in cellular protein catabolic process”, most of them being units of the proteosome or associated proteins.

Example of a sub-network extracted from DIP with nodes colored by age. The subsection is an ego-network based on the protein “YFL021W” (violet) with its interacting partners as well as their interacting partners. Old proteins are colored red, Middle-aged proteins blue, and Young proteins orange. Edges involved in at least one triangle are highlighted in red. The prominent clump of Old proteins on the right-hand side contains mostly subunits of the proteosome or proteins associated with it.
4. Conclusion
Protein age, as estimated by lineage specificity, is a readily available explanatory variable to start probing the nature of connectivities that we currently see in the yeast protein-protein interaction network. An analysis of the pairwise data shows an over-representation of Old-Old pairs given the frequency of the different age-labeled proteins in the network, even when controlling for age. This over-representation of interactions between older proteins alone explains results on pooled protein age groups which suggested that proteins prefer to interact with proteins within the same age group.
Old-Old-Old triangles are also over-represented under the node model, but once the edge frequencies are taken into account (edge model), the conclusions change. Now all triangles involving proteins of the same age group are over-represented, but so are all triangles involving a Young protein, again casting doubt on the concept of homophily for all protein interactions. The consistent pattern is instead that triangles containing at least one Middle-Old edge were under-represented under the edge model, suggesting negative selection or segregation of Older triangles. Considering only higher degree proteins, Old-Old-Old triangles are still over-represented, while triangles containing Middle-Old edges account for significantly fewer triangles than expected under the edge model. Moreover, most triangles in the network are preserved in the sets of high-degree proteins, suggesting dense clustering between high-degree proteins. A gene duplication and divergence model was unable to explain the triangle patterns, pointing to more complex biological mechanisms of proteome growth.
In conclusion, the network contains biological features that cannot be explained by protein frequencies, or protein interaction frequencies, alone. Instead, our findings point to an architecture of the yeast PIN that is highly heterogeneous, with most triangles being associated with high-degree proteins, and with selective age-dependent interaction patterns. Any network model which tries to capture the behavior of small subgraphs should take this inhomogeneous and beyond-pair-dependence structure into account.
5. Methods
5.1. Protein interaction datasets
The protein interaction datasets were obtained from DIP (Salwinski et al., 2004) for Saccharomyces cerevisiae, version 2010-10-10, comprising 25,233 interactions between 5,213 proteins. These data were purged of self-interactions and translated to the SGD systematic name nomenclature. The small number of interactions with no name matches were discarded. The final DIP dataset consisted of 5,092 proteins and 24,693 interactions. A high-quality subset of DIP, called DIP_CORE, was also considered, as well as another subset of DIP where interactions discovered using tandem affinity purification followed by mass spectrometry were omitted (see Supplementary Material).
5.2. Relative age calculation
Throughout this article, the (relative) age of a protein is calculated by lineage specificity (Winstanley et al., 2005) (www.stats.ox.ac.uk/∼abeln/foldage/) using the ortholog identification of InParanoid 7.0 (Östlund et al., 2010) in 99 eukaryotic species plus Escherichia coli. A parsimony age that considers the possibility of horizontal gene transfer by making parsimonious allocations of gain and loss events is calculated for each protein using the occurrence pattern and the respective tree of the 100 species as described in Winstanley et al. (2005). Due to nomenclature issues, there were 323 proteins for which no age was available; these proteins and their interactions were discarded (565 of 24,693 interactions in DIP). The final DIP interaction data sets consists of 4,769 proteins and 24,128 interactions.
Values of relative age range from 0 to 1, where 0 corresponds to a protein that is only present in yeast or in yeast and a few other highly related organisms on the same branch as yeast, and 1 to a protein whose appearance can be traced to the most ancient branching of the tree considered. We bin the data as follows: proteins with relative age >0.8 are called “Old”, proteins with relative age <0.2 are called “Young”, and proteins with relative age between 0.2 and 0.8 inclusive are called “Middle-aged”. While Figure 1 shows that the Old cut-off is natural, this is less clear for the Young cut-off. We repeated the analysis with a Young cut-off of 0.4; the results are in Supplementary Material. Table 1 summarizes the number of proteins in each age group, for the different data sets.
DIP_x denotes the DIP dataset only considering the proteins with a degree greater or equal to x and the links between them. ANTI_x denotes the complementary network with proteins with a degree of less than x. Here we consider x = 10 and x = 25.
Protein ages obtained from Kim and Marcotte (2008) were also considered by collapsing the sets ABE, AE/BE into a set of Old proteins, the set E into Middle-aged proteins, and Fu and N into a set of young proteins (see Results and Supplementary Material).
5.3. Building the network of interest
Having removed all proteins without age annotation, each of our data sets is translated into a network, with the annotated proteins as nodes. Two nodes are linked by an undirected edge if there is an interaction reported between them. Table 1 shows the number of interactions and the number of triangles in each of the data sets, not taking edge categories into account. We abbreviate the ages as O, M, and Y, and order them as O > M > Y ; edges and triangles are annotated with the ages of the nodes involved. The software for calculating the absolute and relative frequencies of the nodes, edges and triangles for the possible combinations of different types of categories, also allowing for selecting nodes above or below a certain degree, is freely available upon request.
5.4. Models for edges and triangles
5.4.1. Node frequency model
To assess whether the observed edge distributions and triangle distributions can be explained by the relative frequencies of proteins of different ages in the data set without making use of network information, we test null models based on nodal frequencies against general alternatives.
Let (pO,pM,pY) denote the vector of the probability of seeing an Old, Middle-aged, or Young protein in the data base of interest. The null model for edges is that the probability pij of an edge (i,j) is just the product of the probabilities of the nodes;
such that
For the case of triangles, the null hypothesis is again that node probabilities alone can explain the numbers of triangles we see; the probability pijk for a triangle (i,j,k) with
such that
We report the observed and expected counts for each edge and triangle, assess their contribution to the chi-square statistic separately and report whether its contribution alone would have lead to a rejection of the null hypothesis; these p-values are presented in Supplementary Material.
5.4.2. Edge frequency model
To assess whether the observed triangle distributions can be explained by the relative frequencies of edges between proteins of different ages without making use of any further network information, we also test the null model based on edge frequencies against the general alternative. Under the null model the probability of a triangle is just the product of the probabilities of its edges, conditioned on the event that the the edges can form a triangle;
where
We use a chi-square test of goodness-of-fit with 9 – 5 = 4 degrees of freedom. We also report the observed and expected counts for each triangle separately, and whether its contribution alone would have lead to a rejection of the null hypothesis; the p-values are included in Supplementary Material.
Taking the Bonferroni correction into account, for DIP, all null hypotheses are clearly rejected at the 0.5% level, with the exception of M-M-M triangles under the node frequency model.
5.5. Construction of gene duplication networks
We follow a version of the duplication model (Bebek et al., 2006) designed to avoid the creation of singletons and proved to give heavy-tailed degree distributions. In this model, at each iteration t a node is chosen uniformly at random (parent) and duplicated by adding a new node to the graph (child) which retains all edges incident to the parent node. The divergence is then introduced at each iteration by (i) each edge in the child node is deleted independently with probability q; (ii) each node in the graph is independently connected to the child node with probability r/t. A final step consists in assuring that, if a singleton is produced, this node will be connected to at least one uniformly chosen random node. We choose the seed graph to be the sub-network of DIP comprising all 1,706 Old proteins and the 6,096 edges between them (singletons may be present). The model parametrisation is similar to Hormozdiari et al. (2007) with q = 0.635, r = 0.33. A total of 30 networks are grown to an order of 4,769 nodes, having an average size of 23,827 edges. The age labelling process is then carried out in order to preserve the same Old:Middle-aged:Young proportions as found in the DIP data set.
Footnotes
Acknowledgments
We thank the anonymous referee for useful suggestions. This work was supported in part by Fundação para a Ciência e a Tecnologia (FCT) through a Ph.D. grant, and by BBSRC and EPSRC through OCISB.
Disclosure Statement
No competing financial interests exist.
References
Supplementary Material
Please find the following supplemental material available below.
For Open Access articles published under a Creative Commons License, all supplemental material carries the same license as the article it is associated with.
For non-Open Access articles published, all supplemental material carries a non-exclusive license, and permission requests for re-use of supplemental material or any part of supplemental material shall be sent directly to the copyright owner as specified in the copyright notice associated with the article.