
Abstract
Abstract
Patterns with gaps have traditionally been used as signatures of protein families or as features in binary classification. Current alignment-free algorithms construct phylogenies by comparing the repertoire and frequency of ungapped blocks in genomes and proteomes. In this article, we measure the quality of phylogenies reconstructed by comparing suitably defined sets of gapped motifs that occur in mitochondrial proteomes. We study the dependence between the quality of reconstructed phylogenies and the density, number of solid characters, and statistical significance of gapped motifs. We consider maximal motifs, as well as some of their compact generators. The average performance of suitably defined sets of gapped motifs is comparable to that of popular string-based alignment-free methods. Extremely long and sparse motifs produce phylogenies of the same or better quality than those produced by short and dense motifs. The best phylogenies are produced by motifs with 3 or 4 solid characters, while increasing the number of solid characters degrades phylogenies. Discarding motifs with low statistical significance degrades performance as well. In maximal motifs, moving from the smallest basis to bases with higher redundancy leads to better phylogenies.
1. Introduction
The purpose of this article is threefold. First, we want to measure for the first time the quality of phylogenies reconstructed by explicitly comparing the composition of structures that do allow mismatches. For “composition” of a string s, we mean here the set of all structures of a given type that occur in s. We turn to rigid gapped motifs in particular, and we compare their phylogenies both to a reference taxonomy and to those generated by popular string-based alignment-free methods. Second, we want to study the relationship between classification power and number of gaps. For “classification power” of a given set of motifs, we mean here the distance between phylogenies reconstructed from the composition of such motifs and corresponding reference phylogenies. We are specifically interested in testing whether extremely sparse motifs carry any phylogenetic signal. To accomplish this goal, we use motifs whose length and sparsity have never been considered before. Even worse than substrings, the number of rigid gapped motifs can grow exponentially in the length of a string. Our third objective is measuring the footprints on classification quality of systematic ways to limit this explosion. We experiment with global and local bounds on the density of motifs, with motifs with high z-score, as well as with maximal motifs, i.e., motifs that cannot be made more specific without losing support. Unfortunately, even maximal motifs grow too fast to be practical: we thus consider bases that are capable of generating the whole set of maximal motifs but grow quadratically or linearly in the length of the string. As a byproduct of this analysis, we report previously unseen regularities in the distribution of maximal motifs and their bases with respect to density and length in mitochondrial proteomes and in corresponding random strings.
This article is organized as follows: Section 2 overviews the few existing methods that construct phylogenies from gapped patterns, tracing their roots to early large-scale compositional analyses. Section 3 describes the types of gapped motifs we study in our experiments, as well as our dataset and measures. Experiments with more than 3600 trees built on approximately 4.4 billion motifs are detailed in Section 4 and summarized in Section 5, where we point the reader to some natural extensions of our methodology.
2. Gapped Patterns In Phylogeny: State Of The Art
Patterns with gaps are a successful formalism to represent structural and functional information in biological sequences: for example, most of the signatures in biologically significant databases like
As mentioned, by composition we mean the set of all structures of a given type that occur in a dataset. The transition from patterns seen as signatures to comprehensive compositional studies probably started with the unsupervised extraction of all maximal motifs with given density bounds and support from the GenPept database (Rigoutsos et al., 1999a), with the aim of building a dictionary of all maximal motifs that occur in any known protein sequence. Correlating such building blocks to structure and function provides a way to understand protein organization, thereby enabling a pipeline for the unsupervised functional and structural annotation of proteomes (Rigoutsos et al., 2002). Motifs in the dictionary have been shown to contain information at multiple levels of abstraction: some motifs are specific to a protein family, others are specific to a phylogenetic taxon, and yet others cross protein families and phylogenetic groups, suggesting themselves as universally reused gapped modules that resonate with solid ones identified earlier (Han and Baker; 1995, Han et al., 1997). The very idea of relating motif composition to phylogeny probably surfaces for the first time in this dictionary, albeit being still seen from a signature viewpoint: the authors of Rigoutsos et al. (1999a) ask for the set of motifs that characterizes a specific clade, that are shared among a given set of clades, and that occur in all known clades, and they provide examples of motifs that are archaea-specific, bacteria-specific, shared between archaea and bacteria and between archaea and eukaryotes. A systematic study on the classification power of gapped motifs is however deferred. The dictionary of motifs was subsequently recompiled using the proteomes of 4 archaea and 13 bacteria (Rigoutsos et al., 1999b): once again, motifs are used for functional annotation and as signatures of protein families, and the compositions of motifs is not compared across the two clades.
The notion of composition vector based on normalized counts of occurrences of gapped patterns looms already in the few other large-scale compositional studies on gapped patterns. These studies systematically collected all occurrences of
To date, few phylogenies inferred from gapped motifs exist, but none of them compares the motif composition of biosequences explicitly. To compute the distance between two sequences x and y, the authors of Höhl et al. (2006) concatenate the realizations of all rigid, gapped, maximal motifs that occur exactly once in both x and y, forming two new sequences x′, y′ of the same length. A conventional maximum-likelihood estimate based on a model of character evolution is then used to compute the distance between x′ and y′. This methodology effectively uses rigid gapped motifs as anchors for local alignments, comparing the characters that fill corresponding gaps in two sequences rather than the repertoire of motifs in the sequences. Moreover, motifs with multiple occurrences in the same sequence are systematically discarded. Motifs with flexible gaps are used to classify mitochondrial genomes in Apostolico et al. (2006), but inside the algorithmic information framework of the Normalized Compression Distance (Cilibrasi and Vitanyi, 2005): the distance between two strings depends here on their mutual compressibility with a greedy offline compressor that iteratively shrinks the pair using the motif that yields the best gain, possibly in lossy mode (Apostolico and Parida, 2003). The motif composition of the two strings is thus compared only implicitly.
As mentioned, the present article investigates also how classification quality varies when moving from all motifs in a family to compact subsets capable of generating the whole family. In rigid gapped motifs, the notion of using a basis to characterize and compare strings without resorting to alignments originated with the very definition of such bases (Pisanti et al., 2005). However, few alignment-free methods study similar issues of minimality.
Another objective of the present paper is studying what happens to phylogenies when increasingly sparser motifs are used in composition vectors. Sparsity has been systematically penalized in string kernels, typically by weighting gaps with exponentially decreasing functions of their length or number (Leslie and Kuang, 2003; Lodhi et al., 2002; Rousu and Jaakkola, 2005). On the other hand, applications of motif discovery have been extremely liberal with gaps, except rare exceptions (Jonassen et al., 1995), showing that sparse structures do carry biological information. Table 1 summarizes the densities used in a sampler of papers that extract maximal and elementary motifs (as defined in Section 3) from biological sequences. Experiments with gapped string kernels have used comparable or even higher densities than those listed in Table 1 (Leslie and Kuang, 2003).
k solid characters can span a window of length at most h. n; minimum number of occurrences of a motif; o; homology allowed. Articles highlighted in gray detail the distribution of the number of motifs on density, length and support. Cursory hints at length and support can also be found elsewhere (Liu et al., 2003; Rigoutsos et al., 2002; Tsirigos and Rigoutsos, 2008). Edwards et al. (2007) considers only patterns with maximum length 10. McHardy et al. (2007) extracts patterns with length exactly h. Apostolico et al. (2010a) considers flexible motifs. Grossi et al. (2011), not included in the table, extracts maximal motifs with global density 0.65 and 0.8.
3. Methods
Let Σ be a reference alphabet and let
The most natural way to introduce gaps in standard k-mers is probably the notion of elementary motif.
Definition 1
(Elementary motif [Rigoutsos and Floratos, 1998]). A rigid gapped pattern w is a (k, h, n)-elementary motif of a string s if it has k solid characters, if it has length at most h, and if
Elementary motifs have strong ties to molecular biology: for example, self-contained “functional microdomains,” believed to mediate 15-40% of all protein-protein interactions in intracellular signaling, are rigid gapped patterns with length at most 10 occurring in disordered regions on the surface of multidomain proteins (Gould, 2009). The use of elementary motifs in phylogeny was probably hinted at for the first time in Höhl et al. (2006) and was then partially explored in McHardy et al. (2007).
Elementary motifs grow exponentially in the length of a string, thus limiting the values of k and h that can be probed in practice. To handle longer and sparser structures, we turn to maximal motifs and their bases.
Definition 2
(Maximal motif [Parida et al., 2000]). Let w be a pattern occurring at positions
Even maximal motifs can grow exponentially in the length of the input string (Parida et al., 2000). A first way to limit this explosion is imposing local density bounds.
Definition 3
(Dense maximal motif [Rigoutsos and Floratos, 1998]). A rigid gapped pattern w is a (k, h, n)-maximal motif of a string s if it is a maximal motif of s with
As mentioned, a second way is to consider compact generators of the whole set of maximal motifs.
Definition 4
(Irredundant motif [Parida et al., 2000]). A maximal motif w of a string s is redundant if there exist maximal motifs
Definition 5
(Tiling motif [Pisanti et al., 2003b]). A maximal motif w of a string s is tiled is there exist maximal motifs
The set of irredundant (respectively, tiling) motifs with at least n occurrences in a string s, together with their occurrence lists, contains sufficient information to generate any other maximal motif with at least n occurrences in s without knowing s itself (Parida et al., 2000; Pisanti et al., 2003a). It is thus standard to call this set a basis. For n = 2, the size of the irredundant (respectively, tiling) basis is bounded by a quadratic (respectively, linear) function of the length of s (Pisanti et al., 2003b). The tiling basis is a subset of the irredundant basis, as well as of another distinguished set of maximal motifs that we include in our analysis.
Definition 6
(Autocorrelation [Apostolico and Tagliacollo, 2007]). For strings x and y in Σ+, let w = x ⨁ y be the string
To date, irredundant and tiling motifs have been used as guides for the alignment of multiple sequences (Parida et al., 1999), as codewords for lossy, as well as lossless, compression of texts (Apostolico and Parida, 2003) and images (Amelio et al., 2011), and as features of string kernels for protein classification (Comin and Verzotto, 2010, 2011).
As mentioned, we want to study how classification quality depends on the composition of autocorrelations and of elementary, maximal, irredundant and tiling motifs of a string. More specifically, unlike previous studies that assessed the performance of tree construction algorithms on few phylogenetic trees or tried to settle specific controversies in phylogeny, we want to produce results that are independent of the specific set of organisms used. However, we are not interested in artificial sequences generated by models of sequence evolution. We thus set the 2329 metazoan mitochondrial proteomes available from
Given a string
We are interested in studying how the quality of the reconstructed tree depends on the density of motifs (the ratio between the number of solid characters and length) and on their statistical significance. Given a composition vector
where r f (T0, T1) is the Robinson-Foulds distance (Robinson and Foulds, 1981) (abbreviated with RF in what follows) between trees T0 and T1, ranging in this case from 0 to 58. For studying autocorrelations, maximal, irredundant and tiling motifs, we similarly sample
The purpose of this work is not to achieve the best classification in a specific dataset, but rather to study the shape of
We use the publicly available version of
4. Results
4.1. Classifying with elementary motifs
The set of elementary motifs with k solid characters and length 20 contains as much phylogenetic information as its supersets for any value of k: indeed,
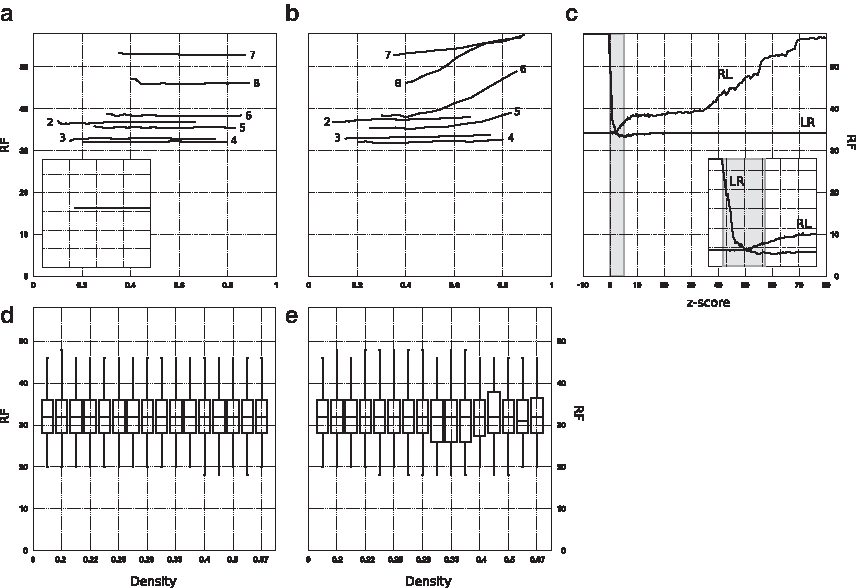
The classification quality of elementary motifs:
The right-to-left analysis confirms that the sparsest motifs at all values of k carry phylogenetic signal: adding them to denser motifs makes tree topology converge, does not degrade classification quality at k < 5, and even reduces RF distance at k ≥ 5 (Fig. 1b). Dense motifs, on the other hand, belong to two different categories. Those with k ≥ 5 contain little phylogenetic information: classification quality is poor (or even null for k ≥ 7) when such very dense motifs are considered, and it gradually improves when progressively sparser motifs are added. Since the composition of standard ungapped k-mers with k ≥ 5 yields good classifications on the same dataset (Figure 6a), these trends suggest that the performance of k-mer methods crucially depends on words that occur just once, or that do not occur, in mitochondrial proteomes. Elementary motifs with k < 5 and length k + 1, on the other hand, achieve the global minimum of the corresponding
Elementary motifs preferentially amass at the low end of the z-score spectrum: for example, approximately 95% of all elementary motifs with k = 4 have z-score at most 6. Counterintuitively, motifs with low z-score carry a strong phylogenetic signal for each k:
4.2. Classifying with maximal motifs
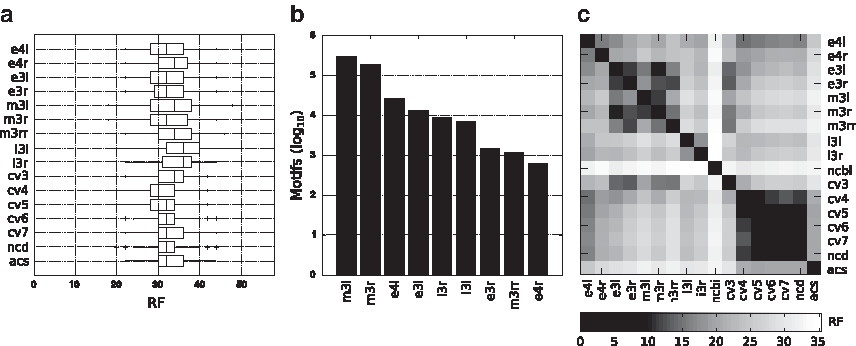
The distribution of maximal motifs with respect to density is quantized (see Fig. 4a below): in particular, the densities d for which at least one motif exists follow a 1/d trend. This is due to the fact that most maximal motifs have between 3 and 5 solid characters and variable lengths. Significantly, the distribution of the number of motifs on density is based on a single module that is iteratively repeated and scaled (see Fig. 4b below). Preliminary experiments show that this regular shape persists when proteomes are reshuffled, implying that it is a property of the density of characters rather than a regularity in mitochondrial sequences. Previous works have studied such a distribution in different datasets (Rigoutsos et al., 1999a,b), but none has considered densities smaller than 0.4 and sufficiently small bins to detect a quantization.
Maximal motifs are inherently infrequent and sparse: approximately 80% of all maximal motifs occurs 3 or 4 times, and approximately 80% of all maximal motifs have density smaller than 0.1 (see Fig. 4 below). Our distance measure between the composition vectors of two strings thus becomes effectively the Jaccard distance between the corresponding sets of motifs. At the high end of the density spectrum, maximal motifs cluster mainly around a small, discrete set of densities: 0.6, approximately 0.67, 0.75 and 0.8.
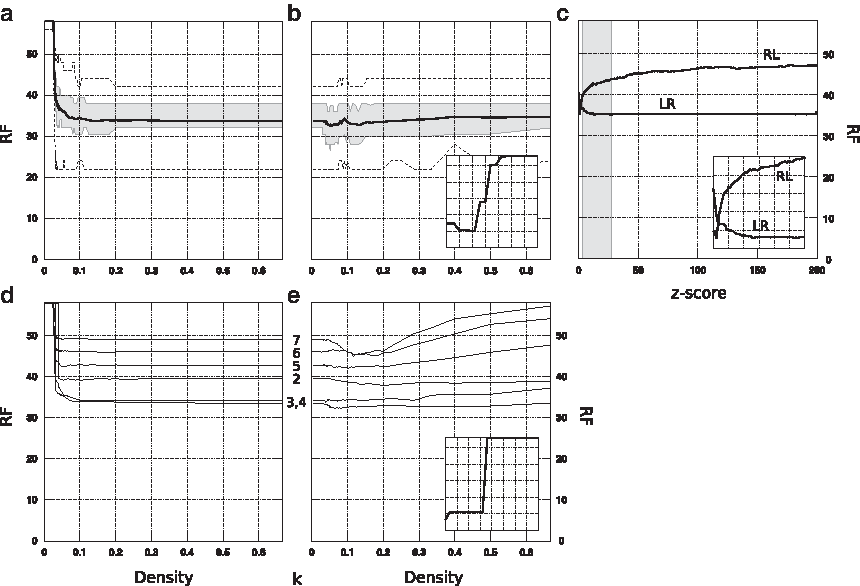
The classification quality of maximal motifs.
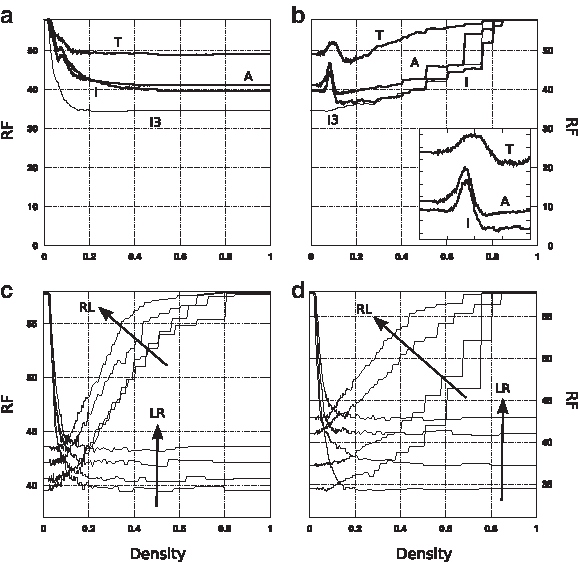
Classification quality of autocorrelations (A), tiling motifs (T), irredundant motifs (I), and irredundant motifs with exactly 3 solid characters (I3) as a function of density: left-to-right
Motivated by the strong dependence between classification quality and number of solid characters k in elementary motifs, we perform the same analysis on maximal motifs. As above, let
The distribution of maximal motifs on z-score is concentrated between scores approximately 0 and 25; unlike elementary motifs, it has a long decreasing tail at high z-score: approximately 10% of all maximal motifs in a proteome has z-score equal to 200 or larger. The right-to-left analysis shows that motifs with z-score equal to 100 or larger contain limited phylogenetic signal, as they need to be complemented by motifs with lower z-score to reach (at z-score one) the global minimum of
4.3. Classifying with motif bases
Consistent with previous studies (Gallé, 2011), autocorrelations, tiling motifs, and irredundant motifs are sparse, long and infrequent: 90% or more of these motifs have density 0.2 or smaller, and approximately 50% of all autocorrelations, 70% of all tiling motifs, and 40% of all irredundant motifs have length 100 or larger, compared to just 10% of all maximal motifs. Moreover, approximately 67% of all irredundant motifs, 90% of all autocorrelations and 99% of all tiling motifs occur 2 times, compared to just 4% of all maximal motifs (see Fig. 4 below). While the distribution of maximal motifs on length is unimodal, the distribution of autocorrelations and of irredundant and tiling motifs is multimodal, with peaks up to length 300 (see Fig. 4c below): these shapes persist when proteomes are reshuffled, implying that they are not imputable to some regularity in the sequence. The distribution of irredundant motifs and autocorrelations on density is very similar to the distribution of maximal motifs: densities are again quantized, and the overall shape is based on a single module that is repeated and scaled.
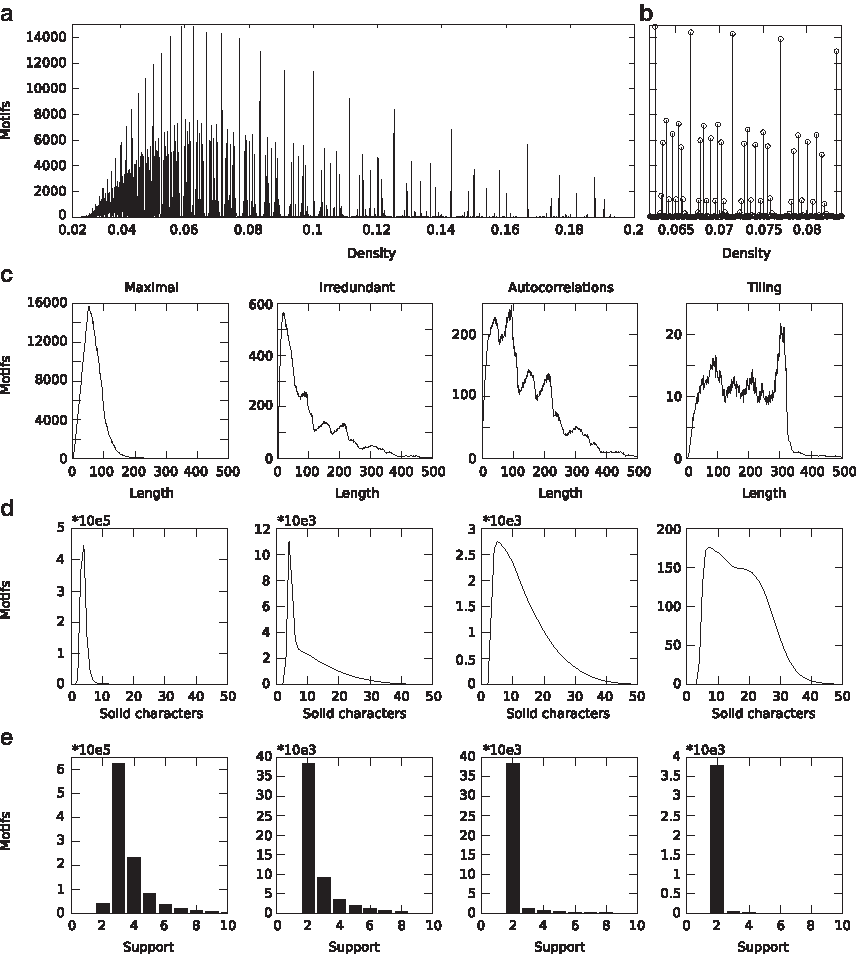
Density, length, number of solid characters, and support in maximal motifs and their bases.
As for maximal motifs,
Despite having similar trends, the curves of autocorrelations, tiling and irredundant motifs differ considerably in absolute value. Tiling motifs display the worst performance: the distance computed using all tiling motifs is approximately 8.7 larger than both the distance computed using all autocorrelations, and the distance computed using all irredundant motifs, while the latter two differ by approximately 1.5 from each other. The curve of tiling motifs is consistently higher than the curve of autocorrelations at any density:
Together with density and redundancy, the number of solid characters has again a strong influence on classification quality. As above, let
Remarkably, using only irredundant motifs with exactly 3 solid characters (approximately 3% of the total) improves classification over using the whole set of irredundant motifs (Fig. 3a): the minimum of
No value of k has a comparably distinguished role in autocorrelations. For example, using only autocorrelations with k = 4 (approximately 6% of the total) improves by just 1.7 over
5. Discussion
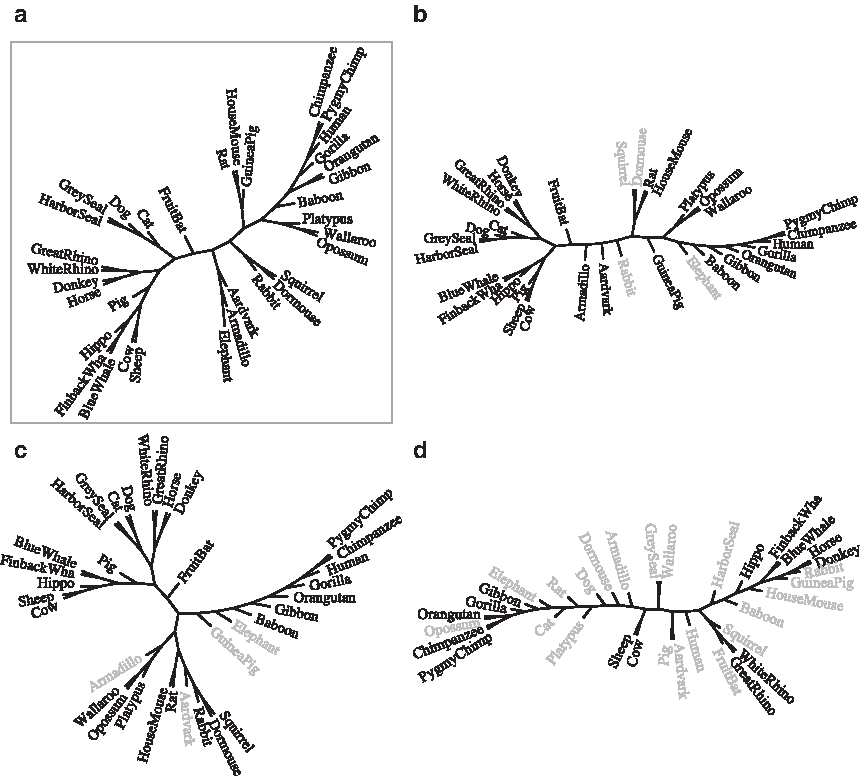
Rigid gapped motifs in polypeptides have traditionally been associated with signatures that group proteins into families with homologous function or structure. In this article, we have shown that the composition of gapped motifs can be used to construct phylogenies from mitochondrial proteomes. Phylogenies with comparable distance to a reference taxonomy can be built using either extremely dense or extremely sparse motifs. For example, elementary motifs with exactly k solid characters and length 20 yield phylogenies of the same or better quality than those produced by elementary motifs with k solid characters and length k + 1, and maximal motifs with density less than approximately 0.15 yield phylogenies of the same quality as those produced by maximal motifs with density 0.75 or larger. Using even lower densities degrades classification in maximal motifs and their bases, but surprisingly keeps groups of related organisms together (Fig. 5). The length and sparsity of such motifs resonate in interesting ways with long-range correlations of various kinds that are known to have a key role in proteins (Weiss and Herzel, 1998): studying the structure of such sparse motifs and their occurrences in the protein space, as well as extending the alphabet of motifs to allow groups of homologous amino acids, would thus be natural extensions of this work.
The composition of extremely sparse motifs carries a strong phylogenetic signal.
In tiling motifs, irredundant motifs and autocorrelations, extremely dense motifs, as well as sparse motifs in a specific density range, contain comparatively little phylogenetic signal. Contrary to what has been observed in the remote homology detection of proteins (Comin and Verzotto, 2011), redundancy seems to be a key factor for the efficient reconstruction of phylogenies: classification quality improves when moving from the smallest tiling basis to its supersets, autocorrelations and irredundant motifs. Our analysis highlights also a third force behind classification quality: the number of solid characters. Contrary to the convergence seen when increasing the length of k-mers, classification with gapped motifs reaches its best at k = 3 or 4, and degenerates for larger k. In particular, considering only motifs with exactly 3 solid characters is sufficient—and sometimes even necessary—to achieve the best classification quality in elementary, maximal and irredundant motifs.
Another point in which our analyses differ from traditional k-mer approaches is the role of statistical correction. Downplaying k-mers with low statistical significance has been reported to be essential for achieving good classifications (Chu et al., 2004; Qi et al., 2004); our experiments, on the other hand, show that gapped motifs with z-score close to zero carry a strong phylogenetic signal, and classification quality degrades when such motifs are discarded.
Figure 6a,b summarizes the sets of motifs that achieve the best average classification quality in our experiments. Such sets are extremely fast to compute in practice, and turn out to be largely disjoint from
Average classification quality
Albeit being all at comparable distances from the
The fact that gapped motifs carry phylogenetic signal could be a peculiarity of proteomes (long regions without solid characters could represent loops where mutations are more likely (e.g., see Califano, 2000; Hart et al., 2000)) or even just of mitochondrial proteomes. It is natural to envision experiments that apply gapped motifs to the reconstruction of phylogenies from the genic and intergenic
Footnotes
Acknowledgments
Disclosure Statement
No competing financial interests exist.
1
32 is a good balance between computation time and realistic input size.
2
Including approximately 98% of all motifs in each basis.
3
Including approximately 29% of all autocorrelations, 3% of all tiling motifs, and 36% of all irredundant motifs.