
Abstract
Abstract
We analyzed 198 datasets of chromatin immunoprecipitation followed by high throughput sequencing (ChIP-seq) and developed a methodology for identification of high-confidence enhancer and promoter regions from transcription factor ChIP-seq data alone. We identify 32,467 genomic regions marked with ChIP-seq binding peaks in 15 or more experiments as high-confidence cis-regulatory regions. Although the selected regions mark only ∼0.67% of the genome, 70.5% of our predicted binding regions fall within independently identified, strongly expression-correlated and histone-marked enhancer regions, which cover ∼8% of the genome (Ernst et al., Nature 2011, 473, 43–49). Even more remarkably, 85.6% of our selected regions overlap transcription factor (TF) binding regions identified in evolutionarily conserved DNase1 hypersensitivity cluster regions, which cover 0.75% of the genome (Boyle et al., Genome Research 2011, 21, 456–464). P-values for these overlaps are effectively zero (Z-scores of 328 and 715 respectively). Furthermore, 62% of our selected regions overlap the intersection of the evolutionarily conserved DNase1 hypersensitivity-identified TF-binding regions of Boyle et al. (2011) with the histone-marked enhancers found to be strongly associated with transcriptional activity by Ernst et al. (2011). Two hundred thirty of our candidate cis-regulatory regions overlap cancer-associated variants reported in the Catalogue of Somatic Mutations in Cancer (http://www.sanger.ac.uk/genetics/CGP/cosmic/). We also identify 1,252 potential proximal promoters for the 7,561 disjoint lincRNA regions currently in the Human lincRNA Catalog (www.broadinstitute.org/genome_bio/human_lincrnas/). Our investigation used approximately half of all currently available ENCODE ChIP-seq datasets, suggesting further gains are likely from analysis of all datasets currently available.
Introduction
To date, genome-wide TF-binding regions and sites have been identified using a variety of indirect methods and data. For example, computational searches have revealed evolutionarily conserved regions enriched for clusters of TF-binding motifs (Ferretti et al., 2007). More recently, Boyle et al. (2011) combined evolutionary conservation and DNase1 hypersensitivity patterns, while Ernst et al. (2011) used histone modification signatures to identify TF-binding regions.
Mammalian genes typically have binding sites for dozens of transcription factors spatially clustered within multiple proximal promoters and distal enhancers/silencers (here collectively referred to as cis-regulatory regions or CRRs), each of which spans a few hundred to a few kilobases (Chen et al., 2008; Davidson, 2006). These first-order estimates suggest that for protein-coding genes across the human genome, we may expect to find in the order of 100,000 CRRs covering 100 mega base pairs (Mbp) or ∼3.3% of the genome. In contrast, 3,440,302 binding peaks totaling 1,318,754,032 base pairs are reported for the 198 datasets of chromatin immunoprecipitation followed by high throughput sequencing (ChIP-seq) analyzed in this article (comprising 51 unique transcription factors in 30 cell lines). We hypothesized that many of these ChIP-seq peaks occur in spatial clusters corresponding to CRRs. In this article, we use a simple integrative analysis of 198 TF ChIP-seq (Johnson et al., 2007) to identify CRRs directly from TF-binding data.
Data pre-processing
We downloaded all human TF ChIP-seq “peaks” files released by the ENCODE project (http://genome.ucsc.edu/ENCODE/) before January 31, 2011 (embargo end: October 2011). We removed RNA Pol2, CTCF, and other non-enhancer–associated IPs. For experiments with technical replicates, we took the intersection of shared peaks. We were left with 176 files (Supplementary Table S1; Supplementary Material is available online at www.liebertonline.com/cmb).
Additionally, we downloaded peak data for 22 published ChIP-seq experiments. The cell types and antibodies for these experiments are listed in Supplementary Table S2, and the relevant publications are given as Supplementary References.
Supplementary Table S3 lists the numbers of experiments for each of 30 cell lines in our collection of data. Five cell lines are each used in more than 10 experiments and another eight cell lines are used for at least three experiments each, but the majority of the cell lines were used only once or twice. Thus, our collection of ChIP-seq datasets encompasses a broad range of cells (and 51 TFs).
The above datasets were generated by multiple labs using different peak calling software. ChIP-seq peak calling algorithms differ in statistical methods, estimates of the empirical False Discovery Rate (FDR), and choice of sensitivity versus precision (Rye et al., 2011). For a given FDR, the number of peaks identified by different packages can differ by as much as 10-fold (Rye et al., 2011; Zhang et al., 2011).
To minimize the number of false positives in our datasets, we plotted histograms of the width and score distributions of the reported peaks. Some histograms displayed disjoint distributions with small numbers of very wide or very high peaks falling well outside the main distribution (Supplementary Figs. S1–S3). There were also significant numbers of peaks with widths less than one third of the average for the experiment. We reasoned that all three of these outlier groups are likely to contain a higher proportion of false positives. We therefore removed all peaks narrower than 80bp, all peaks wider than 4,000bp, and all peaks with extremely high scores (e.g., >950 for MACS software package; see Supplementary Fig. S2). All ChIP-seq datasets were mapped to the GRCh37 build using the “liftOver” tool from University of California at Santa Cruz (UCSC) Genome Bioinformatics (http://hgdownload.cse.ucsc.edu/admin/exe/).
Results
Predictability of ChIP-seq peaks
Our first observation is that even though the peaks in any one dataset cover only a small fraction of the genome, the locations of these peaks are well-predicted by the locations of peaks in other datasets. Figure 1(A) shows overlaps between the peak regions of each of our 198 ChIP-seq experiments and the combined genomic footprint of all peaks from the remaining 197 experiments. Each solid disk represents one experiment. We note that the numbers of overlapping nucleotides and peaks are highly correlated, indicating that the observed overlaps are not due to a small subset of shared peaks.
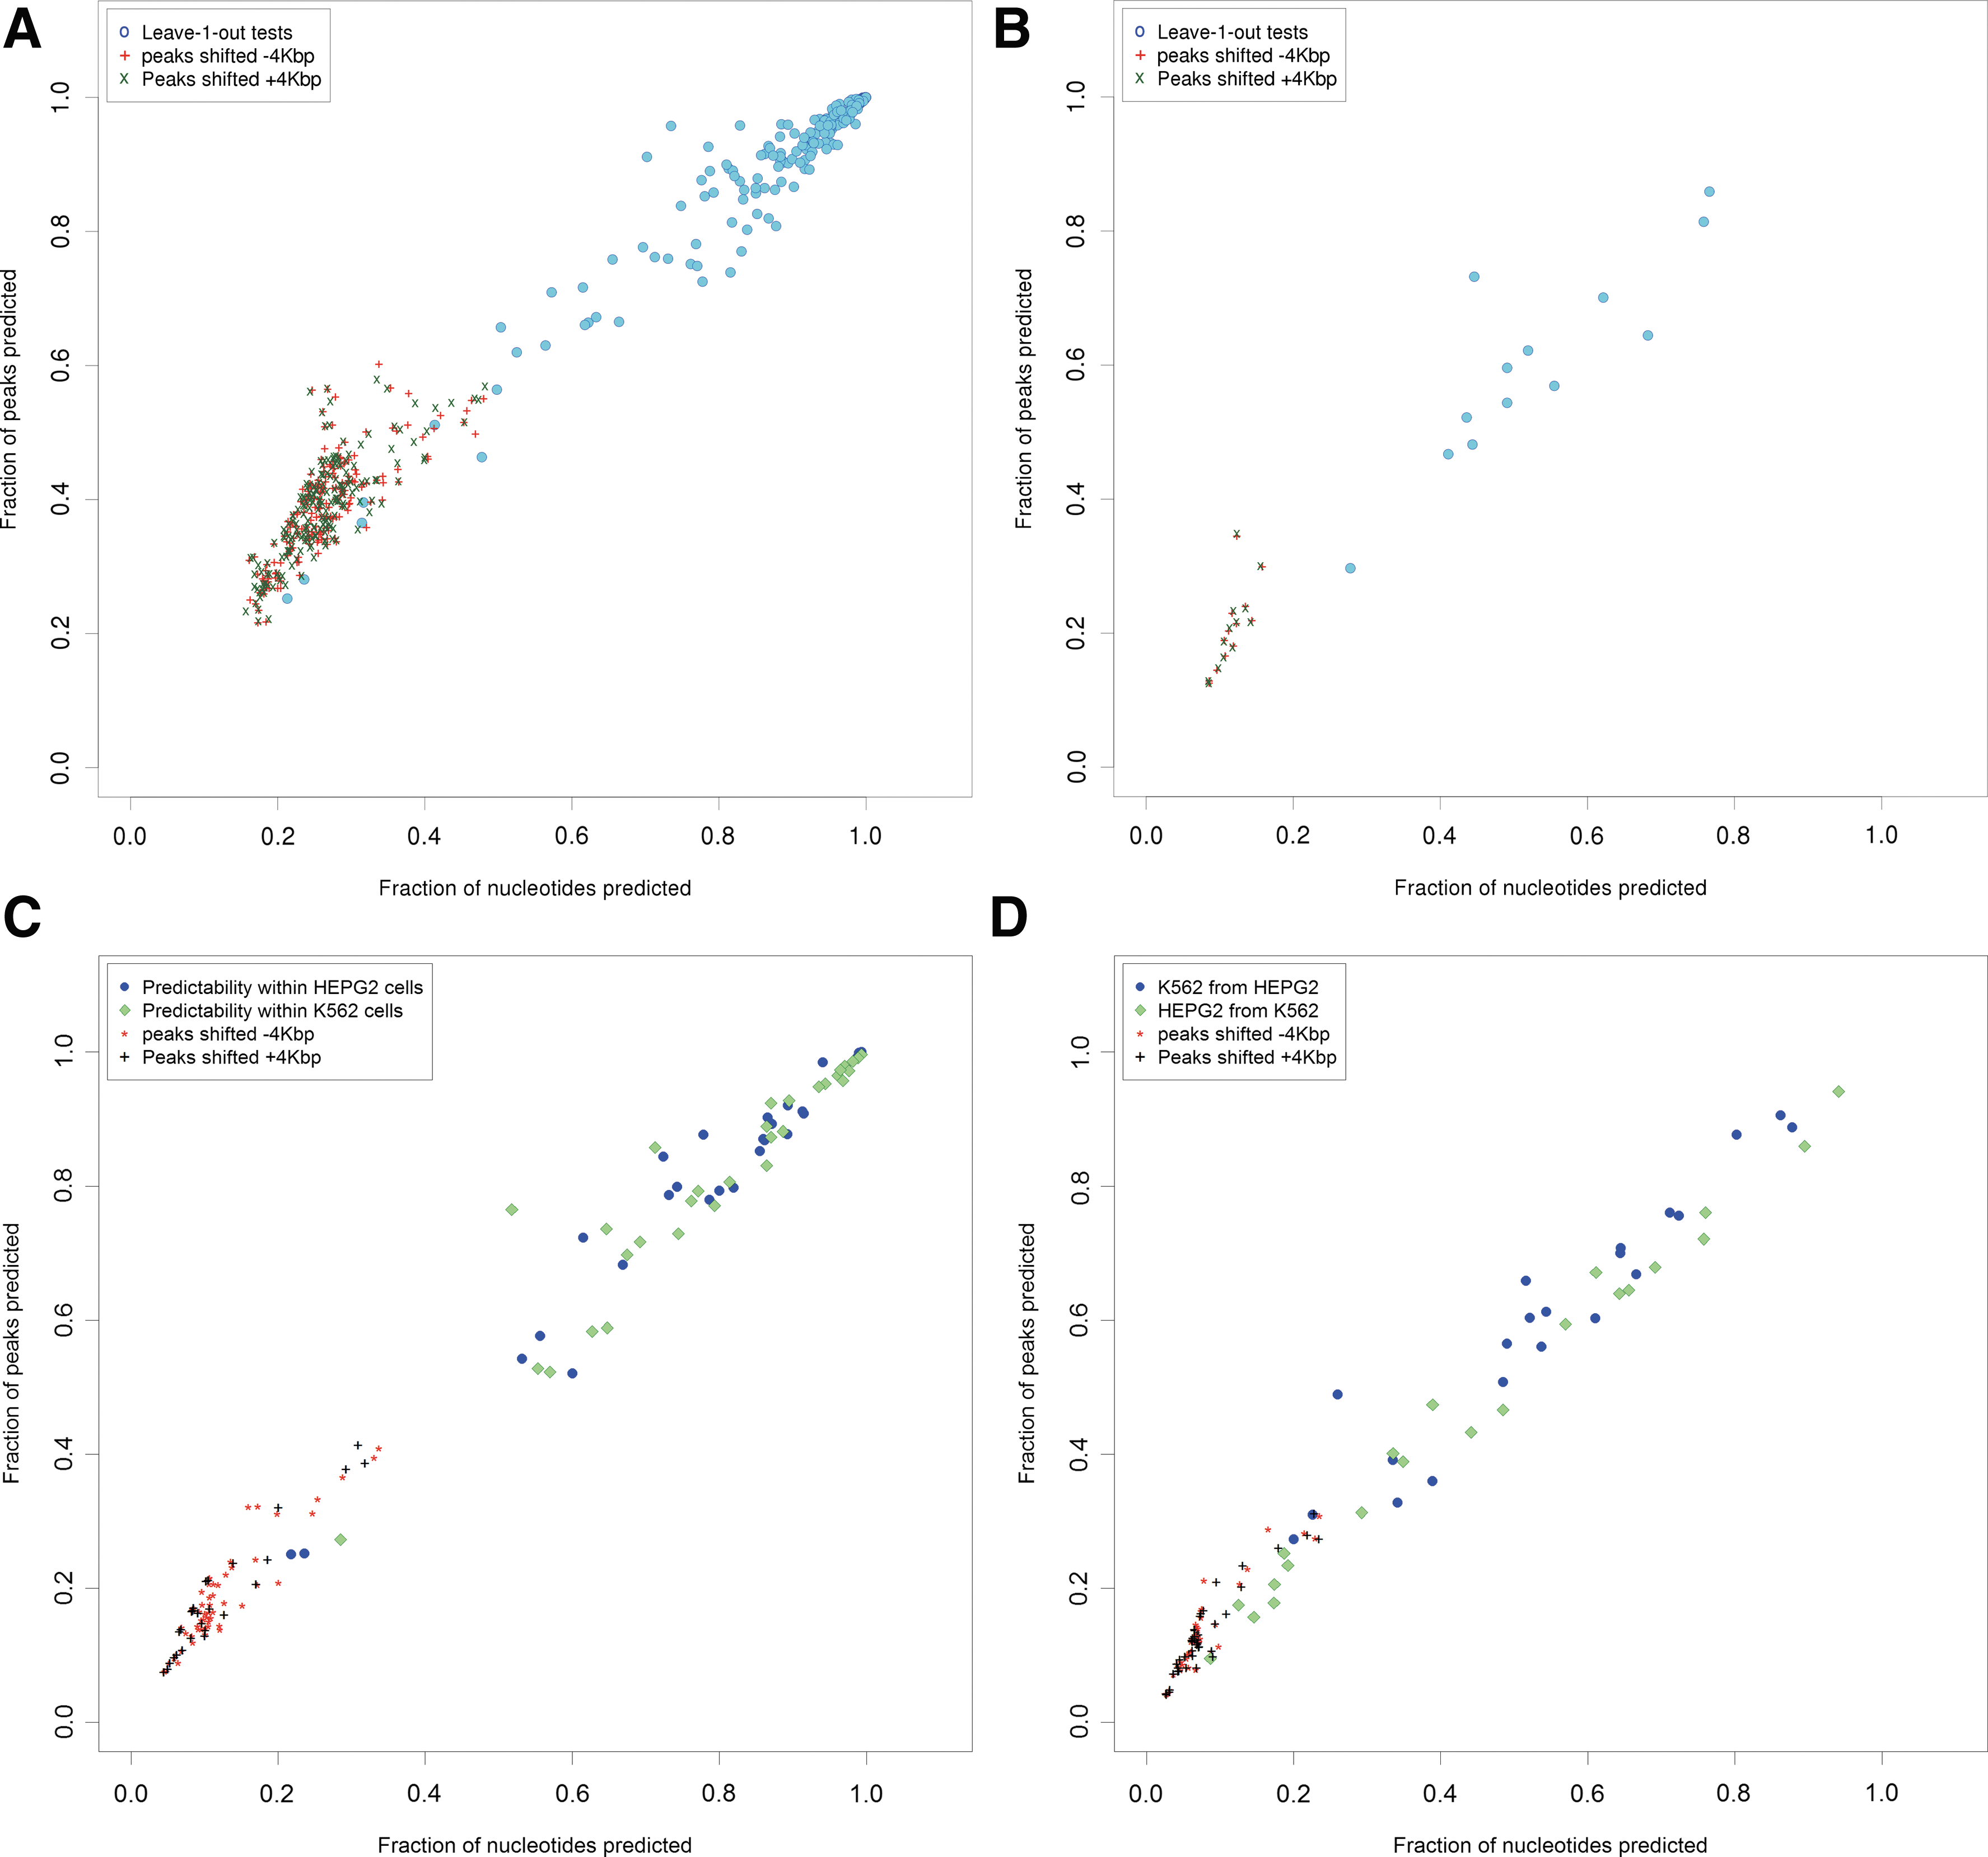
Observed ChIP-seq peak overlaps are unlikely by chance. Each filled marker indicates the overlap of peaks from one ChIP-seq experiment with peaks from any of the remaining experiments. The horizontal (vertical) axis indicates the proportion of nucleotides (peaks) in the test experiment that were also marked by at least one experiment in the remaining datasets. The markers “+” and “×” in
The “×” and “+” markers in Figure 1A represent control tests in which the peak coordinates for the test experiment were shifted by 4,000bp (the maximum peak width in our filtered datasets) 3′ and 5′ respectively. We note that the predictability of the control tests overlaps with that of only seven ChIP-seq experiments. Thus for at least 191 out of 198 experiments, the observed predictability is significantly higher than random chance.
ChIP-seq peak overlaps occur independently of TFs, cells, and peak-calling methods
The colored entries in Supplementary Table S1 highlight groups of experiments that may be expected to show significant peak overlaps. For example, in one group of experiments, the same factor is tested in cell lines from two different HapMap individuals. In other cases, cells have been stimulated by drugs or other molecules at multiple concentrations and/or time points. A third group of experiments are for factors with similar DNA-binding motifs (e.g., E-boxes). Most of these sets of experiments fall in the cluster of points at the extreme top-right of Figure 1A.
To test the extent to which ChIP-seq peaks can be predicted from experiments for unrelated TFs, we first performed exploratory analysis to identify a subset of experiments with TFs that would not be expected to bind the same DNA sequences. As shown in Supplementary Figure S4, we found that individual ChIP-seq datasets fell into at least two distinct groups: those with greater than 30K peak regions and those with less than 10K peaks. A multitude of reasons may underlie this observation, including biological differences in TF characteristics (MacQuarrie et al., 2011), differences in the peak selection threshold (Biggin, 2011), and differences arising from the fact that the experiments were performed at multiple laboratories and analyzed using diverse software.
We identified 30 experiments reporting greater than 30,000 peaks each (Supplementary Table S4) and 97 experiments reporting less than 10,000 peaks each. Experiments reporting large numbers of binding peaks may be suspected of including a higher proportion of false positives. To maximize the stringency of our test, we focused on this group and identified 13 experiments (listed in Supplementary Table S5) using TFs not expected to bind common regions.
As shown in Figure 1B, we find that all but one of the 13 datasets share greater than 40% of their genomic footprint with the remaining 12 experiments, and this overlap rate is considerably higher than in control experiments. These observations suggest that overlaps in ChIP-seq peaks are neither due to random chance nor due to factors binding the same DNA sequence motif.
Are the observed ChIP-seq peak overlaps primarily from experiments sharing the same cell type, or do they also occur across cell types? To assess the degree of predictability for experiments that use the same cell type, we identified 31 experiments in K562 leukemia cells and 27 experiments in HEPG2 liver carcinoma cells. As shown in Supplementary Table S4A, in each cell type no two experiments immunoprecipitate the same TF or closely related TFs.
Figure 1C shows the extent to which individual ChIP-seq peaks from one experiment overlap the footprints of ChIP-seq peaks for unrelated TFs in the same cell type. We note that for all but three experiments, the proportion of peaks that can be predicted is above 50% and well above the proportions expected by chance.
To test whether ChIP-seq data for a given cell type and TF can be predicted from the peaks of multiple datasets for a different cell type and unrelated TFs, we identified 21 K562 and 22 HEPG2 experiments in which the TFs used are mutually exclusive between the two cell types [Supplementary Table S4B]. We then evaluated the extent to which ChIP-seq peaks in each K562 experiment could be predicted from all 22 HEPG2 datasets and vice versa.
As shown in Figure 1D, for 34 out of 43 experiments (79%), peaks for any given TF binding within K562 (HEPG2) cells can be predicted from the binding patterns of other TFs in HEPG2 (K562) cells. As expected, the level of predictability is lower than that found for TFs binding in the same cell type. However, as shown, individual experiments are still far more predictable than may be expected by chance.
TF ChIP-seq peaks from different experiments are spatially clustered
Figure 2A shows the frequency of genomic regions with a maximum of X simultaneously overlapping peaks. Figures 2B–D plot the same curve as in Figure 2A, but for larger groups of experiments. All four distributions exhibit a sharp initial decline followed by middle region with a gentler slope.
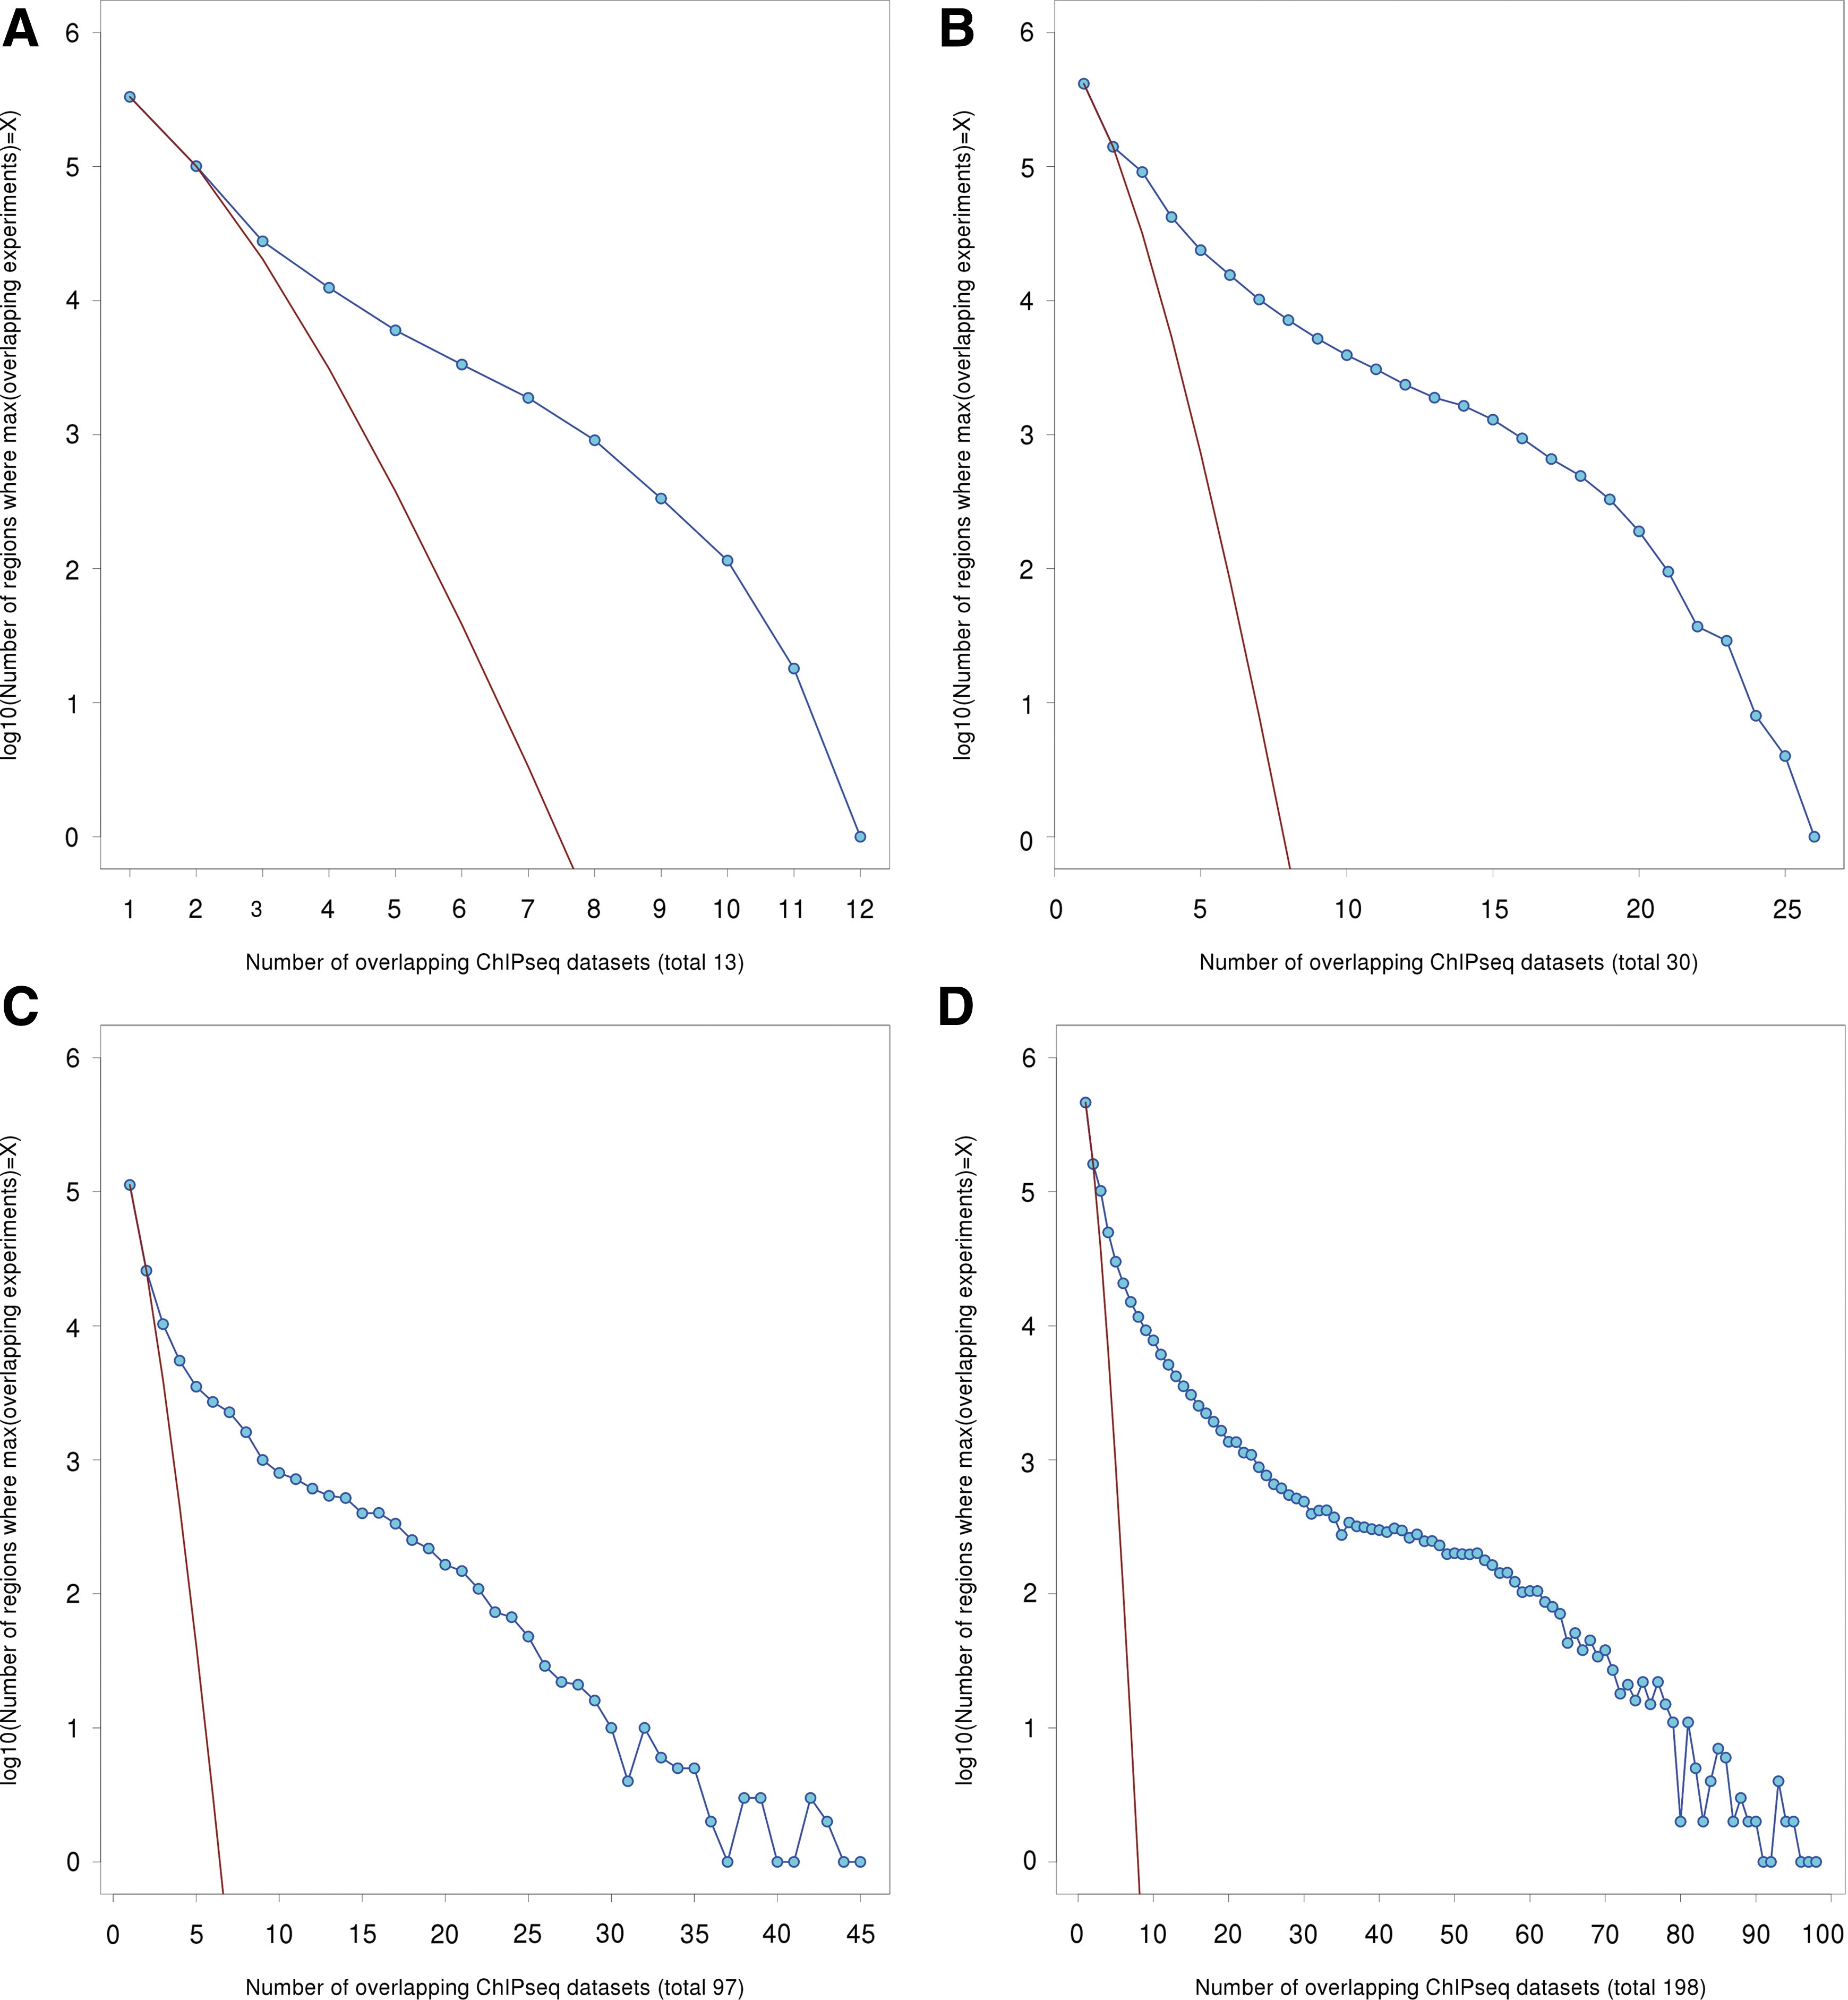
Distributions of peak overlaps have a clustered characteristic.
For randomly distributed peaks, the frequency of finding “islands” of overlapping peaks of maximum depth X would be expected to fit a Poisson distribution (Supplementary Note; Chen et al., 2008). As shown in Figures 2A–D, a Poisson fit to the two left-most points of the distribution (non-overlapped peaks and peaks overlapping only one other peak) significantly underestimates most of the rest of the curve. Thus, although many peaks overlap few others (the high counts at the left ends of the curves) peaks cluster spatially well above what may be expected from a uniform distribution. We hypothesized that these regions of clustered TF-binding correspond to transcriptional cis-regulatory regions.
Highly overlapping peak regions correspond to CRRs
We used the Poisson fit to single and double-peak regions in Figure 2D to select genomic regions with unexpectedly high numbers of overlapping peaks (the Bioconductor “chipseq” package implements this method to detect peaks in individual datasets; see http://bioconductor.org/packages/2.9/bioc/html/chipseq.html). A minimum overlap of 13 peaks is the first point in Fig 2D at which selected peaks include less than one case arising from random chance, as predicted by the Poisson fit to the first two points of the curve. To err on the side of caution, we selected only genomic regions where at least 15 peaks overlap. Genome-wide there are 39,046 such regions covering 13,405,866bp.
Of the overlap regions identified with the above methodology, 30,128 are less than 500bp wide (Supplementary Fig. S5); 7,928 are less than 100bp wide. Since we expect CRRs to span several hundred nucleotides, we extended all <500bp regions to 500bp. This step merges some nearby regions. Genome-wide, there are 32,467 size-adjusted overlap regions and they cover 19,992,599bp, or approximately 0.67% of the sequenced genome. For the sake of brevity, we will refer to these regions as CRR198.
Using only the 30 datasets with >30K peaks each, we identified 4,575 regions with 15 or more overlapping peaks. Every one of the selected regions overlapped CRR198. For the 97 datasets with <10K peaks each, we identified 2,740 regions with 15 or more overlapping peaks. Again, every one of these regions overlapped CRR198. Thus, our methodology makes consistent predictions when applied to different datasets.
Interestingly, although every one of the regions identified from subsets of our total data overlapped the regions obtained from the full dataset (CRR198), only 1,133 regions from the 2,740 regions (∼41%) identified using datasets with <10K peaks overlapped regions identified using datasets with >30K peaks. Our methodology appears to identify different portions of the total human “cis-regulome” when subsets of experiments are used to predict CRRs.
To further explore and verify our findings, we compared the above selected regions with TF-binding regions identified in evolutionarily conserved DNase1 Hypersensitivity regions (Boyle et al., 2011) and predictions of TF-binding regions based on histone modification data (Ernst et al., 2011). Although our selected regions mark only ∼0.67% of the genome, 94.6% of CRR198 regions overlap one of the seven types of regulatory regions identified by Ernst et al. Notably, 70.5% of CRR198 overlaps regions that Ernst et al. identify as Strong Enhancers, defined as regions marked with enhancer-associated histone modifications that are strongly correlated with transcriptional activity in associated genes.
Histone modifications offer insights about the regulatory state of CRRs but cover relatively broad areas of the genome (∼8% for expression-correlated Strong Enhancers). In contrast, Boyle et al. (2011) combined DNase1 footprinting and evolutionary conservation to identify TF-binding regions that cover only 22,388,756bps, or about 0.75% of the sequenced genome. Of the CRR198 regions, 85.6% overlap the binding regions identified by Boyle et al., a remarkable degree of concordance between these two small slices of the genome.
Overall, 27,327 out of 32,467 (84.2%) of CRR198 regions overlap regulatory regions identified by both of the above independent predictions. In all, 20,050 out of 32,467 (61.8%) of CRR198 overlap both Strong Enhancers identified by Ernst et al. and also TF-binding regions identified by Boyle et al. Given that predictions from both Ernst et al. and Boyle et al. are supported by extensive experimental evidence, these observations confirm our hypothesis that the regions we have identified are indeed cis-regulatory regions.
Assessing the quality of predicted CRRs
To establish whether the above overlap rates might have arisen by random chance, we carried out Monte Carlo simulations to estimate empirical p-values for the observed overlap between our data and those of Boyle et al. and Ernst et al. (2011). Supplementary Figures S6A,B and S7A,B show overlap distributions for 1,000 runs in which we measured the overlap between 32,467 randomly distributed regions with the same size distribution as CRR198, as well as Strong Enhancer regions reported by Ernst et al. or DNase1-indentified TF-binding regions reported by Boyle et al. As shown, in both cases, the overlap distributions are well-approximated by a normal distribution, and the degree of overlap is far smaller than the observed overlap with our selected regions. The empirical p-value for the observed overlaps with our selections is effectively zero in both cases (Z-scores of 328 and 715 respectively).
We have described a simple methodology that uses peak overlaps to identify cis-regulatory regions from collections of TF ChIP-seq experiments. To check whether our results are sensitive to the exact choice of overlap threshold, we varied the selection threshold and measured overlaps with the predictions of Ernst et al. and Boyle et al. As shown in Figure 3A,B, the fraction of selected regions that overlap DNase1 and histone-derived CRRs can be increased to ∼100% by increasing the minimum required overlap from 15 to ∼50. However, this would reduce the number and footprint of the selected regions by more than an order of magnitude. Thus, our choice of minimum required overlap appears well selected.

Effect of overlap threshold value on predicted CRRs. Top curves show fraction of selected regions overlapping DNase1-marked and histone-modified cis-regulatory regions (
Could the high degree of overlap we observe be due to sequencing biases? Extensive tests by the ENCODE project have demonstrated good agreement between datasets from ChIP-seq and both NanoString beads and qPCR (see reports at http://encodeproject.org/ENCODE/platform_characterization.html). Moreover, the peak-calling algorithms used by the ENCODE project compensate for potential sequencing and alignment biases by comparing immunoprecipitation peaks to peaks obtained from a mock run. Nonetheless, sequencing biases could in principle concentrate peak calls in a subset of the genome, e.g., CRR198 regions. In counterpoint, we note that an analysis by Jones et al. (2012) found ChIP-seq data to be much less biased than RNA-seq data. The fact that the peak calls from 198 experiments span over 400 megabases of the human genome also argues that ChIP-seq is capable of broadly sampling the genome.
Another potential source of bias could arise from difficulties in mapping short reads to the reference genome. To assess this possibility, we compared the overlap of our selected regions with regions known to be unmapable with 36bp reads (the smallest read size in our dataset). Approximately 8.5% of CRR198 regions overlap unmapable genomic regions at this read length. Therefore, at least 91.5% of our selected regions are outside of difficult-to-map genomic regions.
Discussion
Identification of distal enhancers in the human genome has been challenging thus far. The putative CRRs identified by our methodology are most common near transcription start sites (TSS), but more than 46% lie >5Kbp from TSS of known genes (Supplementary Fig. S8). In addition, as noted above, just over 70% of our putative CRRs overlap areas identified as Strong Enhancers highly correlated with gene expression. Thus, our methodology provides a promising and straightforward approach to identification of distal human enhancers.
The identified CRRs may also be helpful in the characterization of noncoding RNAs and prioritization of disease-associated variants. For example, 1,252 of our predicted CRRs partially overlap the 7,561 disjoint lincRNA regions currently in the Human lincRNA Catalog (www.broadinstitute.org/genome_bio/human_lincrnas/) and may act as proximal promoters of lincRNAs.
We found that six disease-associated common SNPs (Supplementary Table S7) fall within the intersection of CRR198 and histone-marked Strong Enhancers and DNase1-marked TF-binding regions. A further 230 noncoding DNA variants reported in the Catalogue of Somatic Mutations In Cancer (COSMIC, 2011) fall within CRR198. Additional analysis will be necessary to establish whether the specific nucleotides affected are essential components of a TF-binding site. Such a prioritization scheme for noncoding DNA variants is now within reach.
We have shown that a simple procedure can reliably identify CRRs from collections of TF ChIP-seq data. In fall 2011, the ENCODE project released a total of 306 TF ChIP-seq datasets. Thus, the data we analyzed comprises little more than half of the total data available. As we showed above, analyses of subsets of data reveal partially overlapping portions of the global set of all CRRs in the genome, with few detectable false positives. We therefore expect that when our procedure is applied to the full set of ENCODE ChIP-seq datasets, we will find a larger fraction of all human CRRs.
Resource Availability
A BED format browser track (CRR198.bed) listing the coordinates of our selected cis-regulatory regions genome-wide is available as Supplementary Material accompanying this manuscript.
Footnotes
Acknowledgments
We are grateful to Drs. Steven Henikoff, Stephen Tapscott, and Zizhen Yao for stimulating discussions and feedback. All analysis was performed using Bioconductor packages (http://bioconductor.org/) and R scripts (![]() ).
).
Author Disclosure Statement
No competing financial interests exist.
References
Supplementary Material
Please find the following supplemental material available below.
For Open Access articles published under a Creative Commons License, all supplemental material carries the same license as the article it is associated with.
For non-Open Access articles published, all supplemental material carries a non-exclusive license, and permission requests for re-use of supplemental material or any part of supplemental material shall be sent directly to the copyright owner as specified in the copyright notice associated with the article.