
Abstract
Abstract
Triple-stranded DNA:RNA helices of unknown function in vertebrate mitochondria associate with replication and transcription. Antiparallel Hoogsteen pairings form triplexes at physiological conditions. Intermolecular antiparallel triplexes require inverted 3′-to-5′ RNA polymerization, which was never observed. Three rare, long natural 3′-to-5′ inverted GenBank RNAs from mice mitochondria suggest occasional inverted transcription, putatively coding for proteins. BLAST aligns 18 GenBank-stored proteins with hypothetical proteins translated from the 3′-to-5′ inverted Mus musculus mitochondrial genome. Three are DNA-binding, five are membrane proteins. 25% of main frame codons contribute to their 3′-to-5′ overlap coding. Properties of these codons match those of overlap coding protein genes, as compared to codons not expected involved in inverted coding: a) nucleotide contents at synonymous codon positions in mitochondrial genomes fit replicational deamination gradients (A->G and C->T), but digress from gradients when functioning as nonsynonymous positions in putative 3′-to-5′ overlapping genes; b) bias against ‘circular code’ codons (codon groups creating unambiguity between frames), and favouring homogenous codons (AAA, CCC, GGG, TTT) characterize overlapping genes, including putative 3′-to-5′ overlapping genes, as compared to nonoverlapping coding sequences from the same main frame gene. This signature correlates with digression from deamination gradients. Deamination and circular code tests confirm independently alignment-based predictions of overlapping 3′-to-5′ protein coding genes. Results indicate varying expression for different 3′-to-5′ overlapping genes. Inverted 3′-to-5′ RNA is produced, perhaps by an unknown RNA polymerase (invertase) putatively coded by 3′-to-5′ inverted RNA.
1. Introduction
Triplex helices imply regular “Crick and Watson” base pairing between two “inverse complementary” strands (a regular duplex), and Hoogsteen pairing (Hoogsteen, 1963) between one of these strands and a third strand located in the major groove of the double helix (Arnott et al., 1976; Neidle, 2008). Hoogsteen DNA pairing is less rare than usually assumed and occurs transiently 1% of the time (Nikilova et al., 2011).
Two types of Hoogsteen pairings exist, a “parallel” one, where the third strand C is identical to strand A and binds by Hoogsteen interactions with strand B, which is the inverse complement of strand A and C, strands A and B forming a regular duplex (Shchyolkina et al., 2004). Triplex DNA:RNA of that type could occur whenever RNA transcribed from one strand exists, but parallel Hoogsteen interactions are pH sensitive and require nonphysiological low pH (Asensio et al., 1998). Antiparallel Hoogsteen pairing also exists. In this case, strand C is the inverse, yet not the complement, of strand A, meaning that reading strand A in the 3′-to-5′ direction yields the 5′-to-3′ sequence of strand C (Vasquez and Wilson, 1998). Here too, strand C interacts with strand B, but unlike parallel triplex formation, antiparallel triplexes form at physiological pH. They require mirror or palindromic DNA sequences to form intramolecular triplexes (see Fig. 3 in Bhaumik et al., 1998; and Fig. 1 in Buske et al., 2011). Intermolecular antiparallel triplex formation, notably DNA:RNA triplexes, necessitate inverted polymerization of 3′-to-5′ DNA or RNA from 5′-to-3′ DNA or RNA.

Nucleotide contents at third codon positions versus time spent single stranded by a gene during mitochondrial genome replication for protein coding genes in the mitochondrial genome of Mus musculus.
This type of polymerization has not yet been observed. Long antiparallel triplexes are also not known to this author, hence the natural occurrence of intermolecular antiparallel triplexes remains hypothetical. However, it is possible that such polymerization exists, since another type of previously unknown RNA polymerization has been described recently. Indeed, 3′-to-5′ directed polymerization of complementary RNA polymerizes on the template of 5′-to-3′ RNA a complementary strand in the 3′-to-5′ direction by 3′ to 5′ addition of nucleosides (Jackman et al., 2012), an activity first described for mitochondrial tRNAs (Price and Gray, 1999). This observation does not describe polymerization of inverted RNA, yet suggests that some polymerase activities, including inverted 3′-to-5′ polymerization, have not yet been described.
1.1. Inverted RNA in Mus musculus mitochondria
I analyzed the large Mus musculus RNA (expressed sequence tags, EST) library available at GenBank for matches with the inverted sequence of the mouse mitochondrial genome using GenBank's BLAST application (Zhang et al., 2000). Three relatively long RNAs matching almost exactly the 3′-to-5′ inverted mouse mitochondrial genome were detected (Table 1). Their natural occurrence implies that 3′-to-5′ RNA has to be produced, perhaps in relation to antiparallel triplex DNA:RNA.
The first column indicates the involved main frame gene and the strand matching the inverted sequence; ID is the EST's GenBank entry identification, Loc indicates the first and last nucleotides from the 3′-to-5′ sequence in the alignment, N is the alignment length, Sim is its similarity with the EST.
These three RNAs are from a study designed to detect rare ESTs, which detected 207 novel ESTs in mice brains (Davies et al., 1994). In this context, these ESTs matching inverted sequences cannot be considered as erroneously annotated. This conservatively oriented suspicion would be justified if these ESTs were produced by a massive EST project, but not one focused on rare transcripts. Indeed, the 5′-to-3′ RNAs matching the regular orientation of transcription of these sequences are not rare and would not be retained by this study of rare transcripts, as mitochondrial genes are part of the regular housekeeping genes of the cell. The 3′-to-5′ mitochondrial ESTs represent 1.5% of the rare ESTs, and approximately 1/5000 mouse mitochondrial ESTs in GenBank.
The possibility that overlapping genes code for unknown proteins in the 3′-to-5′ direction was also explored. Their expression would be regulated by production of inverted RNA by a putative RNA polymerase, an invertase. This seems a priori highly unlikely, but the RNAs in Table 1 justify investigating further this preliminary working hypothesis. I describe putative overlapping protein genes coding in the 3′-to-5′ direction of mouse mitochondrial genes, as they are detected by alignment methods and confirmed by two independent methods that detect overlapping genes. The congruence between the two methods suggests that 3′-to-5′ coding regions have different expression levels. This is preliminary evidence for inverted polymerization and associated coding, options that should not be neglected in future investigations.
2. Results
2.1. Nonrandom distribution of proteins aligning with 3′-to-5′ coded sequences
The sequences of the 13 protein coding genes, the small and large rRNA (12s and 16s) subunits and of the Dloop were inverted following the procedure where 5′ ATG … TAA 3′ becomes 5′ AAT … GTA 3′. The hypothetical protein sequences corresponding to each of the six potential frames of the inverted sequences were translated according to the vertebrate mitochondrial genetic code using the online software transeq (http://emboss.bioinformatics.nl/cgi-bin/emboss/transeq). Stop codons were not assigned any amino acid, and were coded by asterisks (*). Each of these sequences (6 frames×16 sequences=96 hypothetical protein sequences) were analyzed by GenBank's BLAST application (Altschul et al., 1997; 2005) and 18 hits between hypothetical 3′-to-5′ coded mouse proteins and protein sequences existing in Genbank were recorded (Table 2). These hits do not seem random in terms of functions of the GenBank proteins: three bind DNA (repair and processing), five are membrane proteins (as all main frame encoded mitochondrial proteins), and at least two of the four secreted proteins have functions that are most compatible with mitochondrial metabolism (superoxide dismutase, oxidoreductase).
Main frame gene identity is followed by the frame coding for the hypothetical protein, ‘-‘ indicates coding by the inverse complementary strand; Id, GenBank protein entry; N, alignment length; Origin, protein description and organism of origin for GenBank protein; Seq, first and last codons from the 3′-to-5′inverted sequence aligning with the GenBank protein; Sim, similarity between aligning proteins; Ter, number of stop codons in the aligning 3′-to-5′ sequence. DNA/RNA binding/polymerizing proteins are
Six proteins are hypothetical and have no known function. In terms of taxonomic distribution, half are of bacterial origins, three from fungi, and the rest from other eukaryotes, one from a plant, two from mammals, notably a vertebrate-specific vomeronasal receptor. Note the absence of viral proteins.
The 989 codons in the hypothetical 3′-to-5′ protein coding genes include only seven stops (0.7%), which is 33 times less than the average stop codon density in the 3′-to-5′ inverted sequences of the mouse mitochondrial genome (stops represent 23% of the codons in 3′-to-5′ direction). This suggests that the putative 3′-to-5′ coding regions are not random in relation to stop codons, and decreases the possibility that they result from random matches with GenBank's large number of protein. This also indicates that the expression of 3′-to-5′ coded overlapping proteins is not dependent on stop codon suppressor activity of anti-termination tRNAs (Seligmann, 2010b), which putatively regulate overlapping gene expressions in the regular 5′-to-3′ direction of main frame mitochondrial protein coding genes (Faure et al., 2011; Seligmann, 2011b; 2012a).
Predicted DNA-related protein coding genes could be associated with inverted RNA synthesis. The membrane-bound proteins, and, more generally, the putative functions of most proteins detected, suggest a mitochondrion-adapted integrated coding system.
2.2.1. Replicational deamination gradients and 3′-to-5′ coding regions
Single-stranded DNA has a high tendency for mutations, in particular, hydrolytic deaminations A->G and C->T (Frederico et al., 1990; 1993). Single-strandedness occurs during replication (Francino et al., 1996; Francino and Ochman, 1993) and transcription (see review in Seligmann, 2011b). In mitochondria, the directional, asymmetric replication process creates mutational gradients (Krishnan et al., 2004a,b) that affect gene nucleotide contents, according to their position, which defines the time spent single stranded during replication (Seligmann, 2008, 2010, 2011a). This phenomenon is a spontaneous chemical process that does not account for DNA coding properties. Supposedly, natural selection against detrimental mutations weeds out its effects where deaminations would perturb the function of the coded protein. Hence, nucleotide gradients are most detectable at synonymous third codon positions, and least at second codon positions, with first codon positions being intermediary (Seligmann et al., 2006).
However, for overlapping genes, nucleotides that function as third codon position in the main coding frame frequently function at another codon position in the other protein coding gene. Hence, nucleotide contents at third codon positions in the main frame should fit much less into the replicational deamination gradient when that nucleotide also codes in another frame. This discrepancy from the gradient should be proportional to the level that the gene is expressed. This method, which estimates the digression of nucleotide contents in overlap coding regions from the replication gradient, confirmed the overlap-coding status of alternate frames in the regular 5′-to-3′ mitochondrial protein coding genes (Seligmann, 2012b). Figure 1a,b plots the nucleotide contents that reflect the replicational A->G and C->T deamination gradients for the mitochondrial genome of Mus musculus, separating regions coding only in the regular main frame from those predicted, according to Table 2, to code in the 3′-to-5′ direction. For both deamination gradients, a clear pattern is detected for regular main frame third codon positions (open symbols in Fig. 1). This contrasts with a lack of association between nucleotide contents and single-strandedness for 3′-to-5′ coding regions (filled symbols in Fig. 1) from Table 2. Hence, analyses confirm the coding status of the putative 3′-to-5′ coding sequences, which are much less free to mutate according to the replicational gradient due to their coding function in the overlapping gene.
2.2.2. Sampling inaccuracy and deamination gradients
Results in Figure 1 are not as straightforward as they seem, because sampling effects could confound them. Digressions from the regression line could be due to relatively poor sampling, where short sequences yield low accuracy for nucleotide contents estimations. This effect has to be accounted for in order to make sure that differences between regular and overlap coding regions are not spurious effects due to sampling inaccuracies.
Indeed, for the regular main frame sequences that do not participate in 3′-to-5′ overlap coding, the absolute values of residuals from regressions in Figures 1a,b decrease with site numbers (r=−0.85 and r=−0.88, for Figures 1a,b, respectively). Hence, more than 70% of the variation unexplained by single-strandedness during replication is due to sampling inaccuracy. Overlapping sequences are generally shorter. Therefore, greater digression from the regression line for these sequences could also be due to greater sampling inaccuracy. However, the absolute residuals calculated for the putative 3′-to-5′ overlapping genes for Figure 1a are less well explained by sample size than for regular sequences: site numbers explain only 35.5% of the variation in absolute residuals. For Figure 1b, absolute residuals unexpectedly increase with site number (r=0.51, not statistically significant at p<0.05). This shows that sampling effects account for much less variation in absolute residuals for putative overlapping genes in Figure 1a than for regular coding sequences. Results of absolute residual analyses for Figure 1b are not compatible with sampling effects. These analyses confirm for putative overlapping genes that digressions from regression lines have, besides sampling inaccuracies strong (for Fig. 1a) and very strong (for Fig. 1b), additional cause(s) inexistent for regular main frame coding regions of the same genes. This is compatible with coding by 3′-to-5′ overlapping genes constraining nucleotide contents, preventing their evolution towards the replication gradient.
2.3. Circular codes and 3′-to-5′ coding regions
The matter of the production of 3′-to-5′ inverted RNA and the associated issue of 3′-to-5′ protein coding genes, if confirmed, would be a major discovery. Evidence is based on the detection of three ESTs matching 3′-to-5′ sequences (Table 1), protein alignment data (Table 2), and their confirmation by replicational mutation gradient analysis (Fig. 1). This evidence is diverse, yet still relatively weak, considering issues at stake. However, overlapping genes can be confirmed by a totally independent approach, which could strengthen the working hypothesis of 3′-to-5′ overlap coding.
The analysis of each of the three frames of protein coding genes yields three sets (one per frame) of the 20 most common codons in that frame (Ahmed and Michel, 2011; Arqués and Michel, 1996; 1997; Gonzalez et al., 2011; Michel, 2008). These codons as a group have properties that are defined to form a circular code, due to the lack of frame redundancy for sequences formed by them. They do not include any of the four homogenous nucleotide sequences AAA, CCC, GGG, and TTT. For reasons that are only intuitively apprehended by this author, empirical applications show that overlapping genes can be detected according to the levels by which these sequences avoid the circular code codons, while the four homogenous codons are over-represented in sequences involved in overlap coding (Ahmed et al., 2007; 2010; Ahmed and Michel, 2011). This approach can be used as an empirical test to confirm the status of the putative 3′-to-5′ overlapping protein coding genes presented in Table 2.
For that purpose, I analyzed all three frames of the main frame protein coding genes of the mitochondrial genome of Mus musculus according to each of the three sets of 20 codons that form the circular code, scoring codons matching these codons by ‘1’, and those matching homogenous codons by ‘ −1’. This analysis expects that the mean score for overlapping genes is lower than for regular coding sequences. For each putative overlapping 3′-to-5′ coding gene, this score was compared with that obtained for the rest of that gene, for the 12 candidate genes within protein coding genes. I also used this approach for analyzing the putative 3′-to-5′ coding sequences in 16s rRNA.
The score was indeed lower in the overlapping sequences than in the regular regions of the same gene, for 9 among 13 cases. This small majority of cases has the probability of occurring according to a one-tailed sign test of p=0.067. At the level of single overlapping genes, one-tailed t tests indicate significantly lower scores in the overlapping region than in the rest of the gene for all three circular code sets (one associated with each frame), for ND4l (merging all overlapping regions, p=0.035, p=0.027, and p=0.029, for each frame), for ND6 (p=0.029, p=0.045, and p=0.008), and for 16s (p=0.00016, p=0.00027, and p=0.00005). Significantly greater scores in overlapping regions, which are opposite to the expectation of this test, were found for ND4 (p=0.007, p=0.0008, and p=0.003, two-tailed tests). I also found such a case for the putative 3′-to-5′ gene detected in the first frame of the Dloop (p=0.047, p=0.057, and p=0.047, two-tailed tests). Combining the one- tailed ps for all putative overlapping genes according to Fisher's method for combining ps from independent tests sums −2xln(Pi) for a total of k tests, where Pi is the statistical significance obtained for the ith test, where ‘i’ varies from 1 to k. This sum is a chi square statistic with 2*k degrees of freedom (28 degrees of freedom in this case). The chi square statistics and combined ps for each frame (43.96, p=0.028; 41.33, p=0.05, and 51.43, p=0.005) confirm that putative 3′-to-5′ overlapping genes have lower circular code scores than in other regions of the same genes. This test confirms the overall overlap coding status of these putative 3′-to-5′ overlapping genes totally independently of the replicational deamination gradient analyses in Section 2.2.
2.4. Convergence between digressions from deamination gradients and circular code scores
Figure 1 indicates that some putative overlapping genes have nucleotide contents that match fairly well what is expected from gradients in regular sequences, while others do not and are hence more likely to be actually coding overlapping genes (i.e., ND6, Section 2.2.). Similarly, according to the circular code test in Section 2.3., some overlapping genes fit well the prediction of avoiding circular code codons while others do not (i.e., ND6 vs. ND4). The results as they stand for Sections 2.2. and 2.3. confirm independently that putative 3′-to-5′ overlapping genes match at large properties expected for overlapping genes, but wide differences occur in this respect for different candidate overlapping regions, and for the different analyses.
If these differences are not statistical artefacts, they should reflect in each independent analysis a common biological reality, such as gene expression level. If this is indeed the case, one expects a negative correlation between absolute values of residuals from deamination gradients and subtractions of circular code scores for regular coding regions from scores for putative overlapping regions. Such negative correlations would show consistency in overlapping gene prediction between the two approaches. This could indicate different expression levels for different 3′-to-5′ genes.
Analyses of circular code scores in Section 2.3. are congruent for all three frames, but those associated with the third frame circular code yield the statistically most significant results. Hence I focus on these scores to test for correlations with absolute values of residuals of nucleotide contents from the regressions in Figures 1a,b. Using only 3′-to-5′ coding regions from regular protein coding genes (excluding 16s rRNA and the Dloop), the absolute residuals from Figure 1a correlate positively (not, as expected, negatively) with the circular code score (r=0.08, two-tailed p=0.81). For absolute residuals from Figure 1b, one gets the expected negative correlation (r=−0.446, one-tailed p=0.073). Summing absolute residuals from Figures 1a and 1b yields r=−0.439, one-tailed p=0.077. These results, though not statistically significant, are nevertheless in principle confirmative.
However, Section 2.2.2 indicates that sampling inaccuracy affects the estimation of residuals. For that reason, I used a further residual analysis. The regressions between absolute residuals of nucleotide contents (dependent) with site numbers (independent) were used to calculate (signed) residuals, which indicate to what extent digressions from the original regressions in Figure 1a,b are smaller or greater than expected by sampling inaccuracy. For the purpose of studying overlapping genes, this new residual would be a better estimate of digressions from deamination gradients, where sampling effects are accounted for. These residuals correlate negatively with circular code scores for each Figure 1a,b and their sum (r=−0.478, p=0.058; r=−0.452, p=0.07; r=−0.46, p=0.066; respectively, one-tailed tests).
The data for the putative 3′-to-5′ coding region in 16s rRNA can also be added to these analyses, as the nucleotide contents for 16s rRNA fit within the frame of the regressions in Figure 1a,b. This is not the case for nucleotide contents of the Dloop, which are known strongly biased towards A and T, and therefore are excluded from these analyses. Including the putative 3′-to-5′ coding region in 16s rRNA data, which according to the circular code score is the most probable 3′-to-5′ coding region in the correlation analyses between absolute residuals of nucleotide contents and circular code scores, yields stronger correlations between the two tests for each absolute residual analyses based on Figure 1a,b and the sum of absolute residuals from both (r=−0.283, p=0.174; r=−0.433, p=0.07; r=−0.544, p=0.027, one-tailed ps). This result is strengthened further when sample size is accounted for by residual analysis as explained in the previous paragraph (r=−0.483, p=0.047; r=−0.57, p=0.021; r=−0.55, p=0.026, one-tailed ps). Figure 2 plots the data for the sum of the absolute residuals from Figures 1a,b, after accounting for sample size in each. This negative correlation is also confirmed by the more robust nonparametric Spearman rank correlation analysis (rs=−0.55, one-tailed p=0.0281).
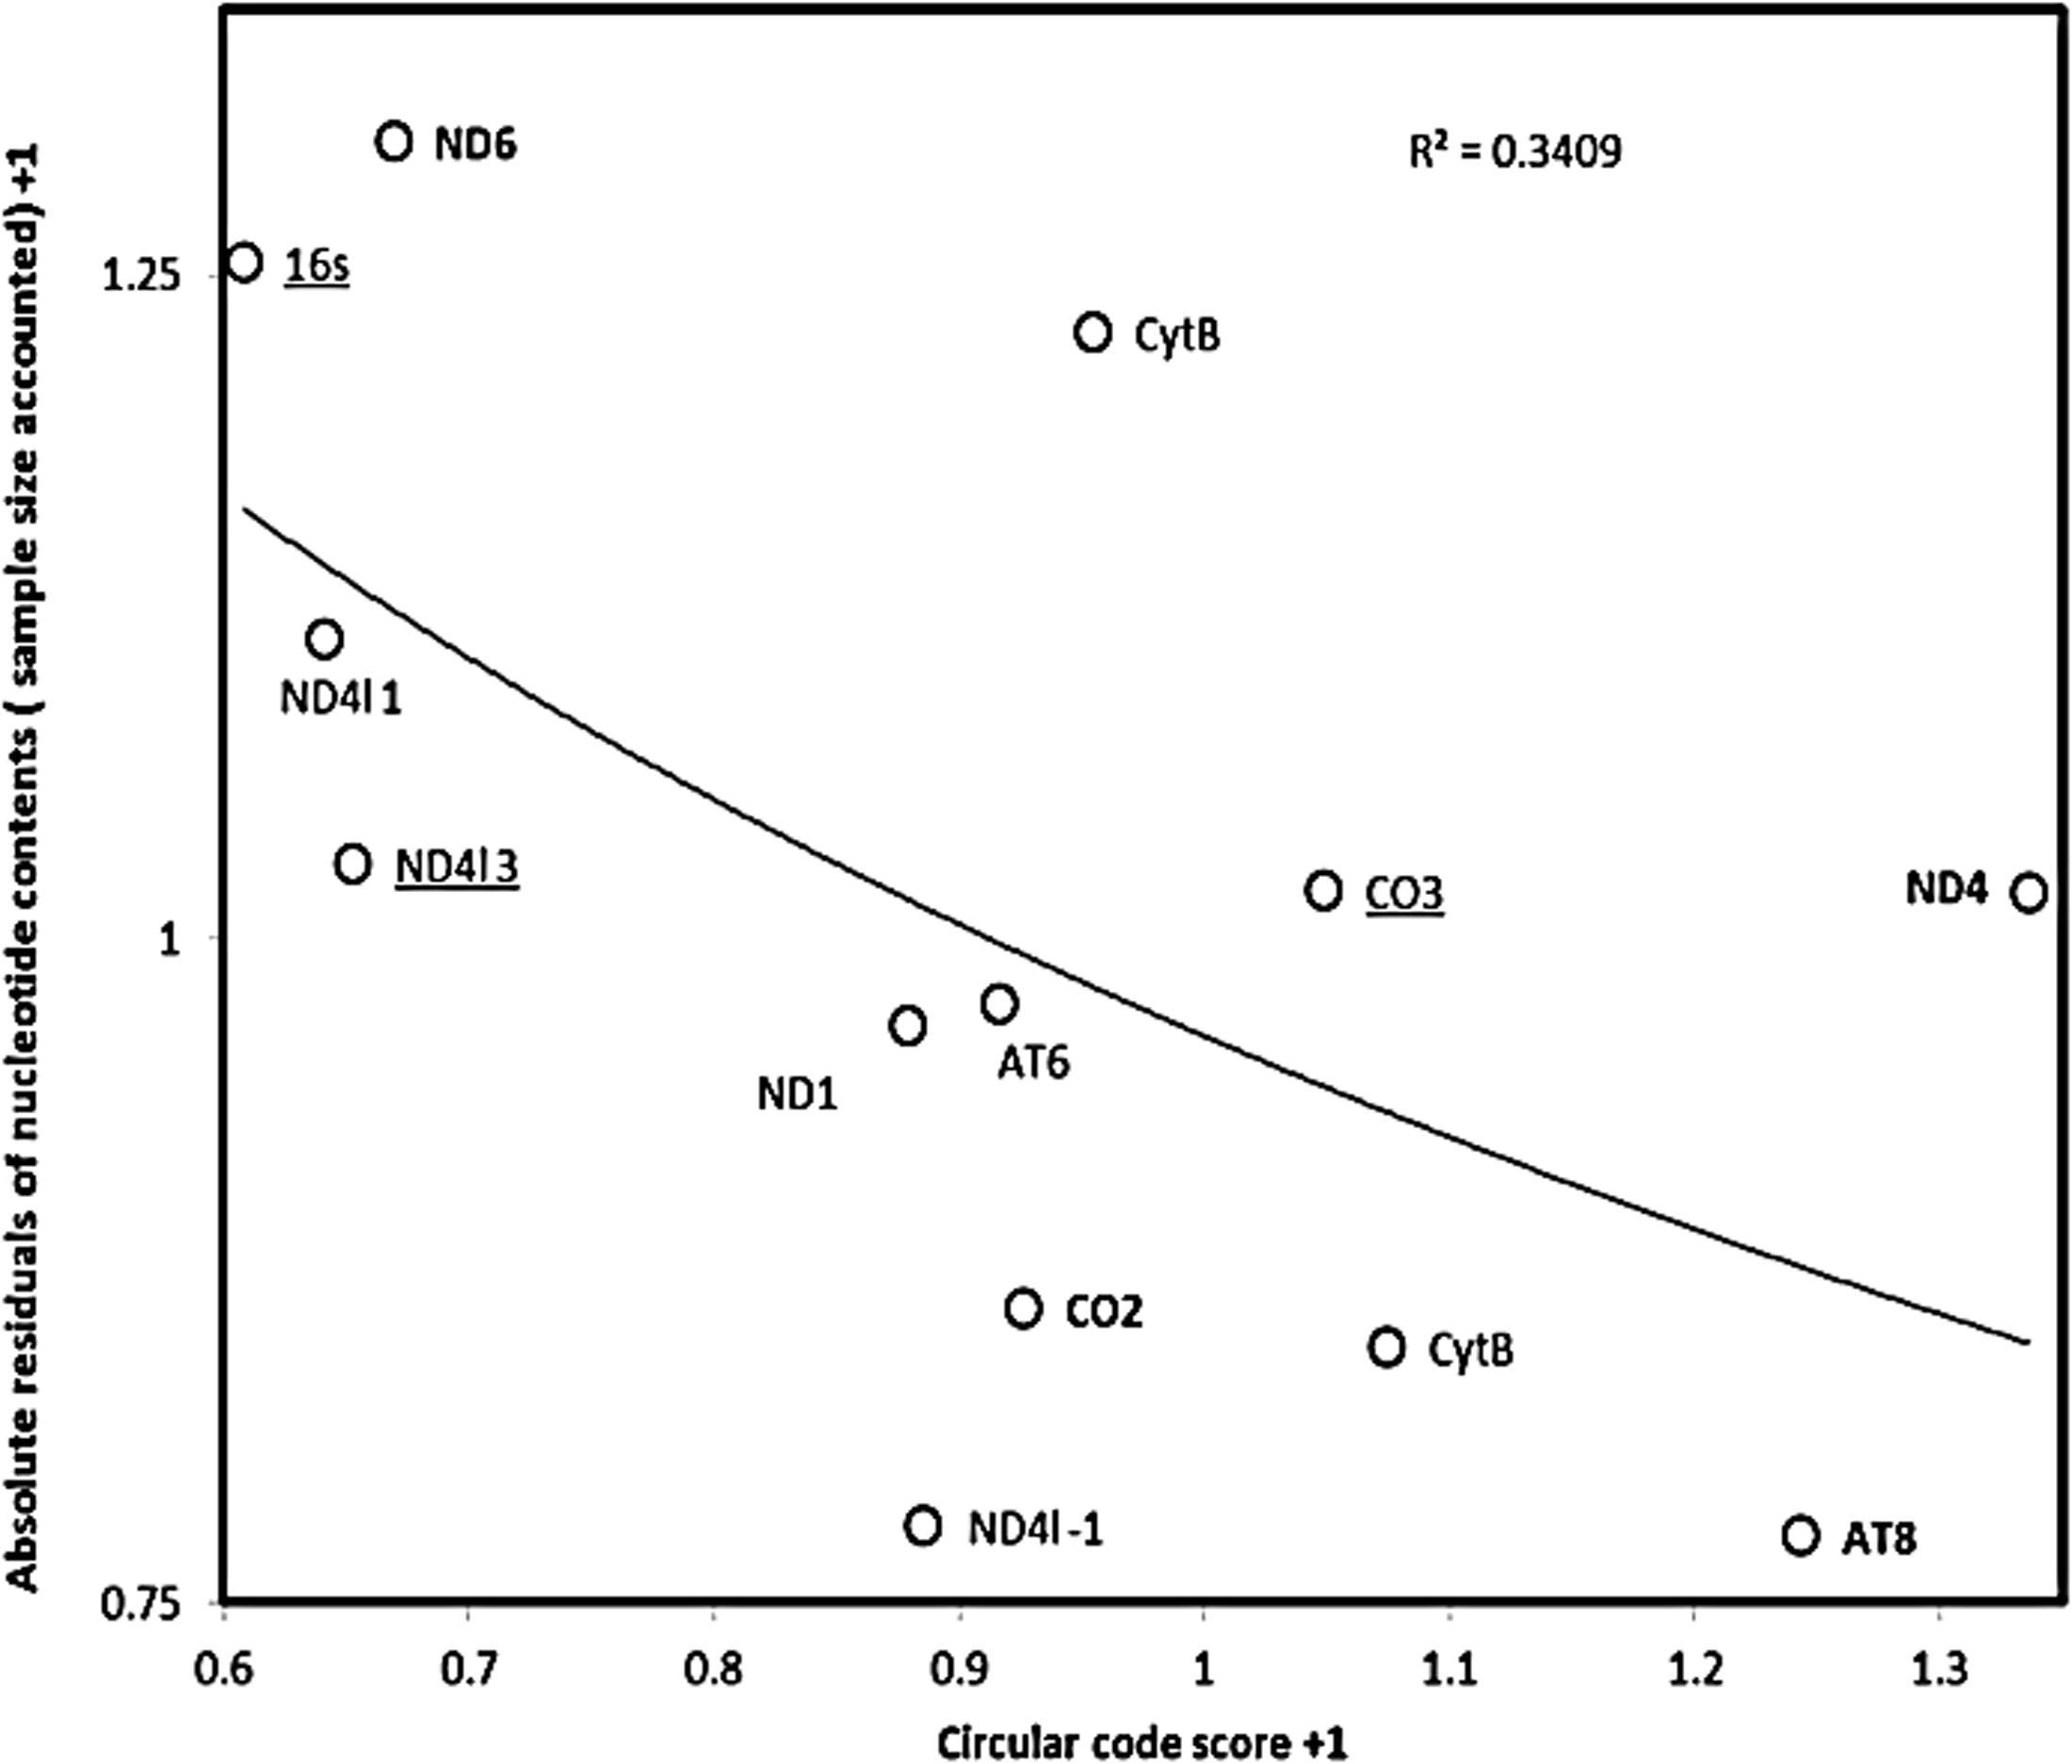
Digression from deamination gradient versus circular code score. Sum of absolute residuals from Figures 1a and 1b adjusted for sample sizes (+1) as a function of the circular code score for the third frame in putative 3′-to-5′ overlap coding genes from the Mus musculus mitochondrial genome. The y axis is calculated from the absolute residual of the regressions in Figures 1a and 1b of nucleotide contents with replicational single-strandedness for putative 3′-to-5′ overlap coding genes (from Table 2). Site numbers affect these absolute residuals, as a result of sample size effects on estimation inaccuracies. These sampling effects are accounted for by calculating residuals from the regression between absolute residuals and sample sizes. These are then summed for data from Figures 1a and 1b. The x axis is the subtraction of the circular code score (for the circular code associated with frame 3) of regular sequences for that gene from the circular code score for the putative 3′-to-5′ overlap coding region in that gene. For the x and y axes, lower and greater values, respectively, suggest greater probability of overlap coding. Consistency between the two estimates by the independent tests (y-axis: based on nucleotide contents at third codon positions according to replicational gradients; x-axis: based on the match of codon usages with circular code theory) expects a negative correlation as observed in Figure 2. This means that some genes, such as 16s, ND6, and ND4l 1 (1 indicates the frame coding for the overlapping gene when putative overlapping genes are detected in more than one frame) have according to both tests a high probability of coding for a 3′-to-5′ overlap coding gene, while AT8 and ND4 a low one. These consistent differences probably reflect variation in gene expression.
These results show that estimates of 3′-to-5′ overlap coding are consistent between independent tests. Some genes appear as very probable 3′-to-5′ overlap coding genes (ND6, 16s, ND4l), while others not (AT8, ND4). This probably reflects expression levels of the various 3′-to-5′ overlap coding genes. This consistency between methods is also an important confirmation that results are not due to artefacts or random effects, indicating that the conclusion of 3′-to-5′ overlap coding is relatively robust.
3. Discussion
Several lines of independent evidence suggest that inverted polymerization might occur: a) inverted RNA exists; b) translating into protein sequence inverted RNA yields several alignments with existing proteins; c) these putative 3′-to-5′ coding regions are much poorer in stop codons than one would expect if these were random matches; d) properties of these putative 3′-to-5′ coding regions are as expected for overlapping genes according to two independent tests, and results between these tests confirm each other and the results of alignment analyses. This would mean that the ample evidence for the existence of triplex DNA, RNA, and DNA:RNA might be a corollary of 3′-to-5′ coding that remained unnoticed until now. Polymerase active sites seem to have the potential to bind also triplexes (Lestienne, 2011), which suggests that antiparallel RNA might be produced on the template of DNA duplexes. Templating on the basis of a single strand is also plausible at this stage. It is important to note in this context that the catalytic site of the polymerase that elongates RNA in the 3′-to-5′ direction on the basis of a regular single stranded 5′-to-3′ RNA and yields regular parallel complementary RNA is similar in structure to that of regular RNA polymerases (Jackman et al., 2012).
3.1. Transcript evidence
At this point, the evidence and analyses presented here do not indicate much on the process that produces noncomplementary 3′-to-5′ RNA, but the body of evidence strongly suggests that such a process exists. This is because such RNA is detected, and because bioinformatics analyses using very different approaches yield quite coherent results. It is important to stress here again that the three 3′-to-5′ RNAs detected could not be erroneous sequence annotations, where sequence manipulation published in GenBank accidentally inverted (yet not complemented) RNA sequences. This is because the relevant mouse EST study (Davies et al., 1994) was designed to detect rare transcripts. In this context, regular 5′-to-3′ transcripts of AT8-AT6 genes, and cytochrome B, would not have been selected, as these are frequent RNAs. The three detected RNAs are part of the 207 rare transcripts detected by that study. Annotation errors are much more likely for projects describing the whole transcriptome, where very large numbers of RNA transcripts are being sequenced and annotated, not for a restricted, specialized transcript search as in this case.
3.2. Sampling inaccuracies and gradient analyses
Replicational gradient analyses can confirm the detailed structure of overlapping genes (of the regular frameshifting type along the 5′-to-3′ direction) in mitochondrial genomes (Seligmann, 2012a). This analysis uses for control the positive evidence for deamination gradients in non-overlapping sequences, which contrasts with the expected lack of evidence for fitting the deamination gradient in the overlapping genes. The latter is a type of negative evidence, and could be considered therefore as relatively weak, despite it actually being a matched contrast between overlapping genes and regular coding sequences. Indeed, negative results such as a lack of correlation can easily be produced by low accuracy of estimates, rather than a biological process. It is in this respect that it was important to check whether site numbers affect the lack of correlation between nucleotide contents and the replicational gradient. The analyses confirmed a strong sampling effect for the control, but a much weaker or a lack thereof for overlapping genes. This observation indicates that negative evidence from the analyses of nucleotide contents of overlapping genes is not simply the by-product of sampling inaccuracies.
3.3. Congruence between tests and the non-random distribution of predicted protein functions
The latter estimates are congruent with a totally different test, based on circular code theory. This congruence is strong evidence that results are not artefacts, and reflect the biological reality of a 3′-to-5′ coding system. In this respect, the identity of the proteins detected, including three DNA-binding proteins, numerous membrane proteins, and two soluble proteins with functions obviously associated with mitochondrial metabolism (oxidoreduction and the prevention of free oxygen radicals) add to this coherence between various lines of evidence. As noted for the 5′-to-3′ frameshifted overlapping genes (Seligmann, 2011a, 2012b), the expression of this 3′-to-5′ coding system could be associated with specific stress conditions and/or embryo development. The latter is indicated by the fact that the 3′-to-5′ RNAs were extracted from brains of mouse embryos, that triplex formation associates with high replication rates (which occur during early developmental stages), and that one of the candidate 3′-to-5′ genes aligns with mouse Tolloid-like 2 protease, an enzyme family with significant functions during animal development (Scott et al., 1999). The fact that DNA-related proteins tend to be among the more likely 3′-to-5′ cases (or the more expressed overlapping genes) is also notable (see underlined genes in Table 2 and Fig. 2).
3.4. Simulation analyses of randomized synonymous codons
An anonymous reviewer of a previous publication testing for the existence of frameshifted overlapping genes in Drosophila (Seligmann, 2012b) suggested to test, by randomizing synonymous codon usages, that natural synonymous codon usage is optimized for overlap coding. This test found that simulated sequences maintaining main frame coding properties but altering coding properties of other frames yield protein sequences that match significantly less frequently proteins existing in GenBank than natural sequences. This showed that detected alignments do not result from chance, and also that some natural sequences were designed to avoid frameshifted overlap coding. For several reasons, I did not use this approach in the 3′-to-5′ context. The first one is that these simulations do not alter the coding properties of the main frame of the regular gene. This is an adequate approach for testing for frameshifted overlapping genes, but in the context of 3′-to-5′ coding, coding properties of one frame would not be altered, and hence remain untested.
A second, important point in this context is that these simulations give strong evidence if the test is positive, but do not give any indication if they yield negative results, meaning that the distribution of alignments for simulated sequences resembles that of the natural sequences. Indeed, such a negative result does not mean that there are no overlapping genes, but that these are not more frequent than expected by random hits. Most relevant in this context is the observation that some genes are optimized to avoid overlap coding. Natural sequences were found more coding for overlapping genes than simulated sequences because the overwhelming majority of cases are such that natural sequences are designed to favor, not avoid, overlap coding. In a more balanced situation where approximately as many genes favor and avoid overlap coding, only much more complex analyses of the simulated data could detect the existence of non-random effects. This would shift the focus towards the analysis of simulated, rather than natural sequences, despite that the actually important issue at stake is the detection of a new biological phenomenon. In addition, results show that 3′-to-5′ coding sequences seem to be a much more balanced mixture of ‘favored’ and ‘avoided’ overlapping genes, probably reflecting different expression levels. In this context, simulations would probably necessitate the complex analyses testing for differences between simulated and natural sequences over the whole distribution, and not only between their mean numbers of alignments.
3.5. Simulation analyses versus functional tests
The third argument suggesting that simulation analyses are relatively irrelevant in this context is that these are purely statistical tests, which do not imply biological function. The tests used here develop explicit predictions based on biological functions (replicational mutation gradients, and coding redundancy between frames), and are therefore much more powerful and precise tools for the purpose of detecting genes. Positive results imply explicit biological functional evidence relevant to the matter at stake, which is that of the fine structure of functional genes. This lack of power for simulations randomizing synonymous codon usage is also shown by the previous point, where the method has a great chance of failing to detect a phenomenon if the gene population is of ‘mixed’ nature, and would require much more extensive and carefully designed simulation experiments. The circular code analysis is actually a test based to detect non-random codon usage, contrasting overlapping with non-overlapping sequences, and assuming specific coding properties for overlapping genes. It is in this sense a powerful tool that predicts which synonymous codon usages are favored, and which are disfavored in overlapping genes. Simulation analyses also test for synonymous codon optimization, but do not include explicit predictions in relation to which codons should be favored and which should be avoided, and hence are devoid of any biological, functional meaning beyond that of statistical detection. They become hence relatively obsolete when the circular code approach yields positive results, even if these are not yet well understood in their biological context. Indeed, it is not clear how preference for circular code codons would disfavor the expression of an overlapping gene, and whether the small differences between tests based on codons from different frames of the circular code have a biological signification, especially that empirical results suggest very similar results for the three frames.
4. Conclusions
Various types of evidence coherently suggest that 3′-to-5′ inverted RNA polymerization occurs in mitochondria and that such RNA codes for proteins with different expression levels and probably important mitochondrial functions. Results were based on very diverse types of information and theory and were carefully considered in relation to possible artefacts. Despite that, it is by definition impossible to consider all potential confounding/artifactual factors that could account for positive results. Considering this, one has to keep in mind that while such factors can be found for each type of evidence, it is highly unlikely that a combination of such factors would have created a coherent picture that involves the various lines of evidence. Low probabilities for this at the level of each single test make this particularly unlikely when considering the whole picture. The huge priors against 3′-to-5′ inverted polymerization and coding are based on the force of habit, and a conceptual error where the lack of evidence for 3′-to-5′ inverted polymerization yields an impression of negative evidence. This should not be a reason to dismiss the presented positive evidence that is robust and justifies upholding preliminarily the working hypothesis of 3′-to-5′ inverted polymerization and coding.
Footnotes
Disclosure Statement
The author declares that no competing financial interests exist.