
Abstract
Abstract
1. Introduction
S
Pairwise alignments can be divided into two types: global and local. Global alignment (GA) methods compare sequences that are supposed to be similar along their whole length. These methods are used in some multiple alignment algorithms and for building evolutionary trees of sequences with similar lengths. The Needleman-Wunsch algorithm (Needleman and Wunsch, 1970) is the most popular GA method, though some heuristic algorithms for long sequences have been presented recently (Bray et al., 2011). On the other side, local alignment (LA) methods are used to find similar regions in the strings compared (for example, similar protein domains) and include the rigorous Smith-Waterman algorithm (Smith and Waterman, 1981) and other heuristic methods like BLAST (Altschul et al., 1997) and FASTA (Pearson and Lipman, 1988), more popular for their speed and efficiency. In both cases, an alignment score can be considered as a measure of the shared amount of information (SAI) between a protein and its antecessor (Bastien and Maréchal, 2008).
Raw scores, obtained with either local or global alignment, depend on sequence length and composition; therefore, a high score does not imply a high quality of the alignment and a further study is needed to assess homology of a protein pair. Two major methods for evaluating statistical significance have been proposed. The first method is based on obtaining, either theoretically or experimentally, the scores probability distribution. Karlin and Altschul (1990) derived an estimation of the probability of finding a local ungapped alignment between two random sequences a and b with a score S(a,b) greater than s using an extreme value distribution (EVD) or Gumbel distribution type I:
where m and n are the sequence lengths (a and b, respectively) and K and λ are constants that depend on the average sequence composition and scoring matrix. This model was theoretically proven for ungapped alignments, though further studies have shown that it is also valid for local gapped alignment statistics (Mott, 2000; Altschul et al., 2001). Though less attention has been paid to global alignment statistics, Pang et al. (2005) found that global scores for random protein sequences of similar length could be fitted to a three-parameter gamma distribution. This distribution was the best fit for real but unrelated sequences of similar length, though in some cases no probability distribution agreed perfectly well to real score distribution.
The second method used for evaluating statistical significance is Z-score (Lipman and Pearson, 1985), defined as:
Sequence a is shuffled and aligned with sequence b a large number of times (usually, 100–1000 shufflings), and from the resulting scores the mean μ and standard deviation σ are obtained. Z′(a, b) is not a symmetrical score, as it depends on the sequence being shuffled, so Comet et al. (1999) redefined it as:
The empirical rule that Z(a, b) ≥ 8 corresponds to significant alignments was theoretically proven by Bastien et al. (2004), though a Z-score probability distribution is needed to assure statistical relevance, particularly for high values in the distribution tail. Comet et al. (1999) studied Z-score for local alignments and found that quasi-real sequences (shuffled versions of real proteins) followed the EVD model, but real proteins showed a deviation in the distribution tail. Webber and Barton (2001) studied global alignment Z-scores obtained from unrelated protein sequences and concluded that the best fit was given by the three-parameter gamma distribution. Parameters obtained for different scoring matrices and length-independent gap penalties (gap extension equal to zero) were provided, so that P-values can be obtained for these scoring schemes. These results are based on experimentally fitted distribution alignment scores, using either real proteins, quasi-real, or random sequences, but with no theoretical justification. However, some studies (Bastien and Maréchal, 2008; Bastien, 2008) derive the EVD distribution for local and global alignment score based on the assumption of basic processes guiding the biological evolution of proteins.
Recently we proposed a normalized global alignment (NGA) score that corrected the length dependence of a raw global score (Peris and Marzal, 2011). NGA score was shown to be linearly related to Z-score, and computational cost was sensibly lower, allowing for a faster detection of homologous proteins. In this work, NGA statistical significance is studied and applied to obtain p-values of normalized global alignments of protein pairs.
2. Approach
For an arbitrary global alignment E between two biological sequences a and b (of lengths m and n, respectively), we can compute its score S(E) using a substitution matrix σ (that assigns a value to every residue pair) and an affine function that penalizes gaps (with go for opening a new gap and ge for each additional gap extension). Considering the set of all possible alignments
where L(E) is the alignment length.
This optimization problem cannot be solved using a traditional dynamic programming technique. The solution to Equation (4) involves optimizing the ratio of two linear functions, and this question was solved by Dinkelbach (1967) applying the so-called fractional programming technique. This algorithm has been previously used to compute normalized edit distances (Vidal et al., 1995; Marzal and Vidal, 1993; Peris and Marzal, 2009). Following Dinkelbach's solution, the alignment that maximizes the ratio of alignment score and length can be obtained by solving the parametrized equation:
where ρ is the parameter to be found. This equation is iteratively solved by starting with an initial guess for ρ and obtaining the alignment that maximizes
where Ei represents the best alignment optimized in Equation (5) using ρi.
Though different starting values for ρ0 can be used, we take the standard global alignment EGA score divided by the alignment length, the so-called post-normalized global alignment (PNGA),
Maximization problem (5) can be posed in terms of the classical global alignment problem:
where ns is the number of aligned letter-pairs in E.
The solution to Equation (5) can now be related to global alignment, just by adding parameter ρ to every value in the scoring matrix in every iteration or, equivalently, modifying the diagonal terms in the programming dynamic matrix adding ρ, so that a parametrized global alignment GAρ(a,b) is obtained,
Computational cost of NGA algorithm is
Properties of NGA scores were extensively studied in Peris and Marzal (2011) for a set of proteins extracted from ASTRAL database (Brenner et al., 2000). A linear relationship was found between NGA score and Z-score (see Fig. 1), so that all protein pairs with an NGA score over a certain threshold were homologous and had a high Z-score value. This linearity held even for proteins with a biased amino acid composition, such as those of Plasmodium falciparum. Furthermore, NGA improves Z-score performance on homologous detection in a database (Fig. 2). It was shown that NGA leads to suboptimal alignments with better overlaps between the proteins compared.
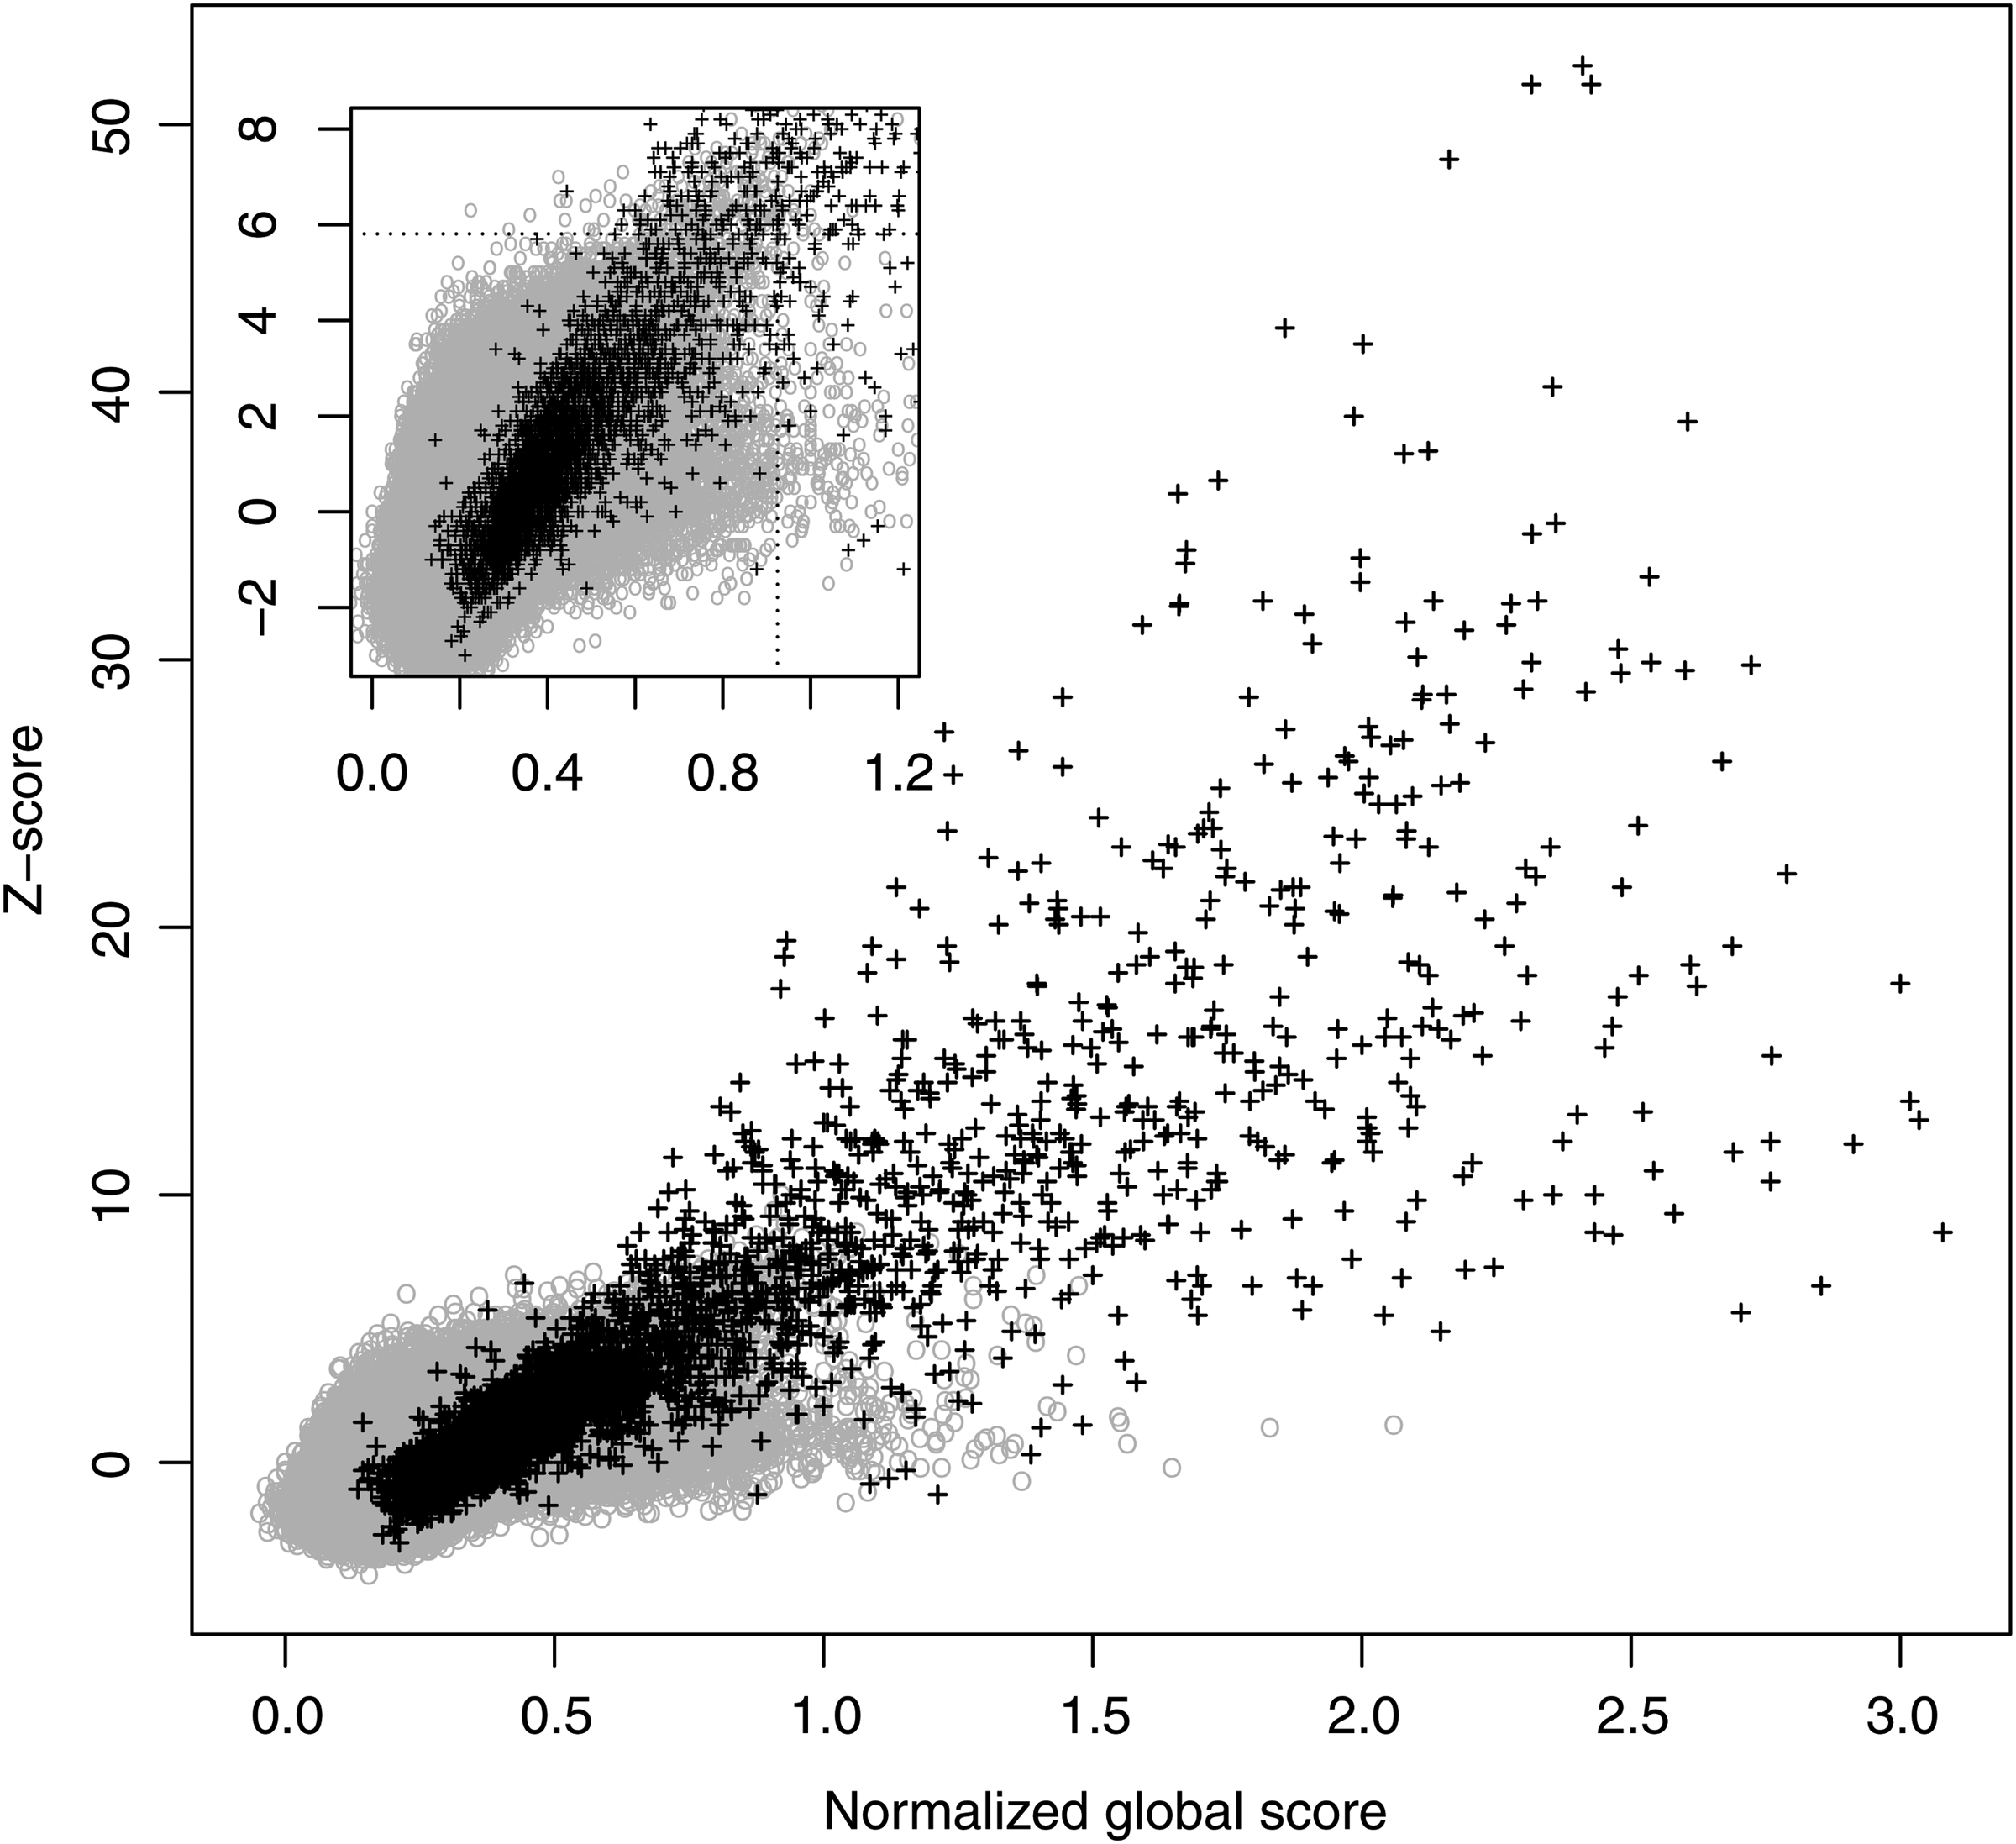
Classification experiments with scoring matrix BLOSUM50 and gap penalties go = 12 and ge = 0, using astral40 training data set. Z-score versus NGA plot is shown, where black crosses represent homologous protein pairs and gray circles non-homologous pairs. NGA, normalized global alignment.
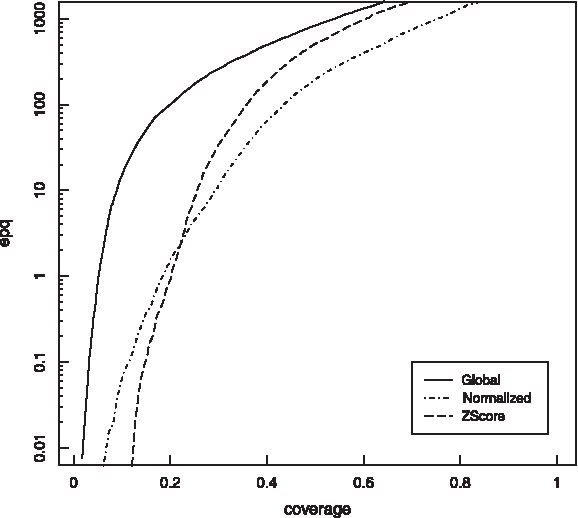
Classification experiments with scoring matrix BLOSUM50 and gap penalties go = 12 and ge = 0, using astral40 training data set. Error per query versus coverage plot is shown using global alignment, Z-score, and normalized global alignment.
However, obtaining a high NGA score does not prove that the two proteins are homologous. In order to decide if a high score is obtained by chance or if it points to a relationship between proteins, the score probability distribution of unrelated protein pairs must be studied.
3. Methods
3.1. Software
The NGA algorithm was implemented in C++ in Peris and Marzal (2011). Basically, it is a modification of Needleman-Wunsch algorithm (Needleman and Wunsch, 1970), changing diagonal contributions in edit graph to include ρ-value in Equation (9). The alignments were not penalized on ending gaps. Z-score was also implemented in the same package, with a standard number of 100 shufflings for each sequence.
3.2. Databases
In this work, a protein subset from ASTRAL database version 1.75 (Brenner et al., 2000) was used. This database is assembled from SCOP database (Hubbard et al., 1997), which contains protein domains manually classified according to its hierarchical evolutionary relationships into classes, folds, superfamily, and family. Protein domains with similar structures, functions, and sequences are arranged in the same family. Members of different families but a common evolutionary relationship are classified into the same superfamily, so they are considered homologous. A fold is comprised of different superfamilies that share common secondary structures, so domains included in different folds are supposed to be non-homologous. Homology of sequence pairs in the same fold and different superfamily is not clear, so they are not considered in our experiments.
The ASTRAL SCOP database is used as a benchmark to evaluate the ability of algorithms to detect remote homology, because the protein domains are filtered so that every pair does not exceed a predefined sequence identity percentage. In this work, 40% filtered set (astral40) was used, and it was further divided into training and test sets. To obtain domain sets of similar sizes, the training set contains the odd-numbered folds in classes a, c, e, and g, and the even-numbered folds in classes b, d, and f, while the rest of the protein domains were included in the test set (Price et al., 2005). The test set was used in Peris and Marzal (2011) for classification experiments. The training set was further filtered selecting one sequence randomly from each fold (592 sequences), so that all protein pairs are non-homologous.
3.3. Scoring schemes
For experiments, we used classical scoring matrices from the BLOSUM series (BLOSUM50 and BLOSUM62; Henikoff and Henikoff, 1992) and the PAM series (PAM120 and PAM250; Dayhoff et al., 1978). BLOSUM matrices are widely used in database searches, while PAM matrices were chosen because they represent different evolutionary time. Though only length-independent gap penalties were used in the previous article (Peris and Marzal, 2011), general affine gap penalty functions were used in this study, with several matrix/gap penalty combinations (Table 1).
In the last column, NGA scores needed to obtain p-values of 1 × 10⁻⁵ and 1 × 10⁻⁸ are shown.
3.4. Statistics
Curve-fitting was carried out with the R statistical package (R Development Core Team, 2009).
4. Results
NGA scores and Z-scores obtained for every scoring scheme were fitted to several positively skewed density distributions (Weibull, log-normal, extreme value distribution, and three-parameter gamma), and the Kolmogorov-Smirnov test was performed for each fitted distribution.
Our results for Z-score agree with Webber and Barton (2001), who pointed out that Z-score fit well to several distributions, including log-normal and three-parameter gamma distribution, though the last one was chosen based only on statistical fitting. As stated by Firth (1988), analyzing log-normal data assuming a gamma distribution is more efficient than analyzing gamma data assuming log-normality.
The three-parameter gamma distribution, or Pearson type III distribution, is given in the equation:
where ξ is the location parameter (0 ≤ (x − ξ) <∞), α is the shape parameter (α > 0), and λ is the scale parameter (λ > 0).
Log-normal distribution is given in the equation:
where parameters have the same meaning as in Equation (10). It is convenient to write Equation (11) as:
where μ and σ are the mean and standard deviation of ln(x − ξ).
For NGA scores we find similar trends, that is, log-normal and gamma are the best-fitting distributions according to Kolmogorov-Smirnov and χ-squared tests. However, in this case log-normal outperforms gamma distribution, with a lower Kolmogorov-Smirnov mean value. Furthermore, the distribution tail fits better to the log-normal equation, as shown in Figure 3, and Q-Q plots confirm this fact (Figs. 4 and 5). So, we use log-normal distribution to model NGA data, though this is based only on goodness of fit and with no theoretical support. Furthermore, it must be stated that no scores have been obtained for the high distribution tail (with p-values around 1 × 10⁻⁸), which is a really interesting area for database searching. Though some techniques are available to obtain such high scores using randomly generated proteins (Bundshuh, 2002; Sheetlin et al., 2005), there are no such algorithms for real proteins. This problem becomes worse when a normalized score is upper bounded.
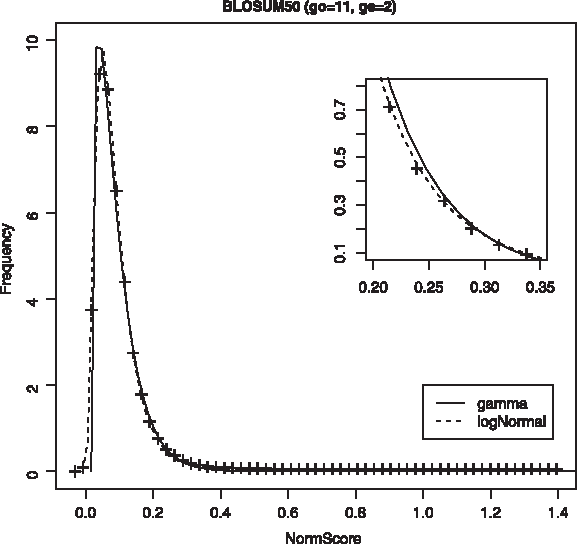
Distribution of NGA scores for astral40 training set, using as a scoring scheme BLOSUM50 and 11/2 for gap penalty. Fitted log-normal distribution (dotted line) and gamma distribution (solid line) are shown.
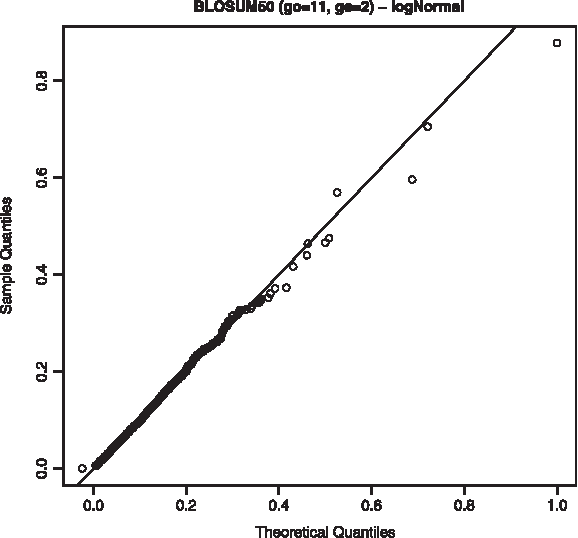
Q-Q plot for log-normal distribution using the scoring scheme BLOSUM50, 11/2.
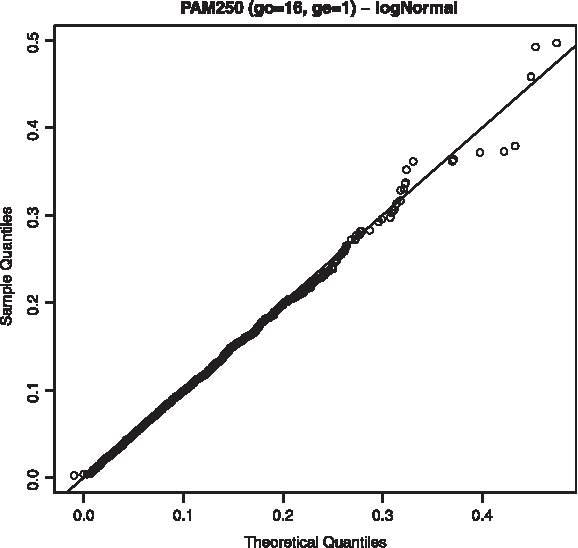
Q-Q plot for log-normal distribution using the scoring scheme PAM250, 16/1.
In Table 1, the probability density function (PDF) parameters of log-normal distribution obtained for every scoring scheme are shown. Figures 6–9 show the fitted distributions for the different substitution matrices used and the different gap penalty schemes. In the insets, the upper tails of the distributions are highlighted because this area is more difficult to distinguish between homologous and non-homologous protein pairs. It can be seen that there is good agreement between experimental and fitted distribution in this twilight region.

Distribution of NGA scores for astral40 training set, fitted to log-normal distribution and scoring scheme BLOSUM50, 11/2.
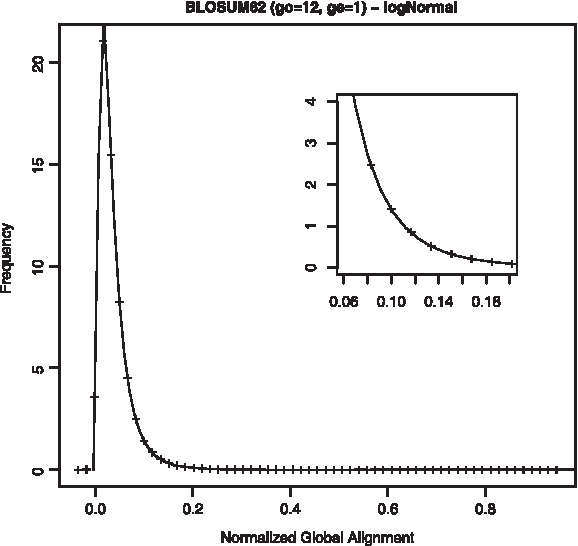
Distribution of NGA scores for astral40 training set, fitted to log-normal distribution and scoring scheme BLOSUM62, 12/1.
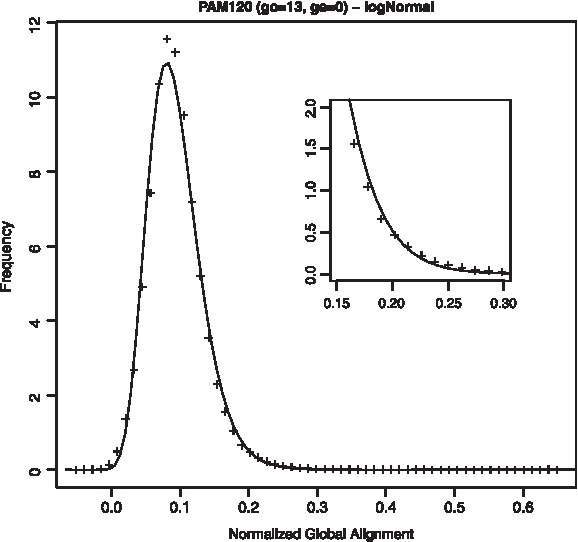
Distribution of NGA scores for astral40 training set, fitted to log-normal distribution and scoring scheme PAM120, 13/0.
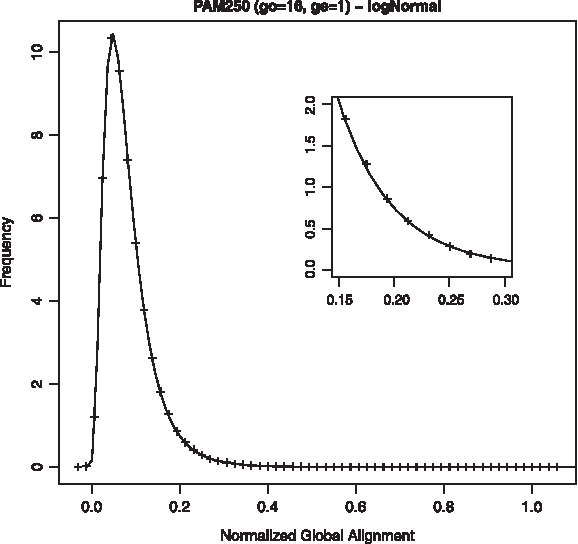
Distribution of NGA scores for astral40 training set, fitted to log-normal distribution and scoring scheme PAM250, 16/1.
NGA scores needed to obtain a predetermined p-value of 1 × 10⁻⁵ and 1 × 10⁻⁸ are shown in the last columns of Table 1.
5. Discussion
In a previous article we introduced the definition of normalized global alignment based on the normalized edit distance as a way to correct the length dependence of a global alignment score. It was shown that NGA allows the selection of a suboptimal global alignment with a better overlap between the proteins compared, which is consistent with the fact that structurally accurate alignments are often suboptimal (Zuker, 1991). Comparing NGA scores with Z-scores, we found a linear relationship between both scores. This relationship allows homologous detection with a high NGA value at a lower computational cost than Z-score. Furthermore, NGA scores improve homologous detection on a database search versus global aligment score and Z-score.
In this article we have studied the statistical significance of NGA scores, finding that these scores can be fitted experimentally to a three-parameter, log-normal distribution. This distribution allows for a good fitting in the right tail of the distribution, an important area to decide if a protein pair is homologous or not. We have obtained the PDF parameters for several scoring schemes. In all, we consider NGA a good and low-cost algorithm for detecting homologous protein pairs, or as a first filter for more elaborate and expensive algorithms. We must remember that distributions have been obtained based only on goodness of fit and with no theoretical support. Furthermore, it was not possible to obtain high scores with p-values around 1 × 10⁻⁸.
Footnotes
Acknowledgments
The authors would like to thank the editor-in-chief and the associate editors for carefully reading the manuscript and contributing their comments, which greatly improved the article.
Author Disclosure Statement
No competing financial interests exist.