
Abstract
Abstract
1. Introduction
At any given time, within-host virus populations consist of a collection of distinct, albeit closely related genetic variants known as quasispecies. Each individual variant, a haplotype, occurs with a different relative frequency. The high genetic diversity of a pathogen population has important consequences in disease progression as it allows the virus to respond to changes in the host environment such as evading host defenses and therapeutic interventions. The high coverage and enormous sequence data output by NGS technologies have the potential to resolve the genetic variation within a virus sample and thereby infer the population structure and composition, which will directly benefit research on disease progression, drug resistance, vaccine design, and viral evolution (Hoffmann et al., 2007).
A number of methods have been published for quasispecies reconstruction that are able to infer genomes of individual haplotypes as well as their prevalence (Jojic et al., 2008; Astrovskaya et al., 2011; Beerenwinkel et al., 2012). In Eriksson et al. (2008) and Zagordi et al. (2010a), the authors proposed a set of methodologies based on a graph theoretic solution, where a set of haplotypes were obtained by calculating a minimal coverage set of paths over a graph of aligned reads. In Prosperi et al. (2011), a reconstruction algorithm based on combinations of multinomial distributions was designed to account for the overlaps between reads with similar frequencies. These methods have been applied to HIV datasets with diversity in the range of 3–10%, and they require a reference genome to which the reads are aligned. De novo assembly of short reads has been modeled as an NP-hard optimization problem. Moreover, the presence of rampant structural polymorphisms, high mutation rate, and sequencing artifacts makes it difficult to obtain a meaningful consensus sequence. In Beerli et al. (2002), the authors explored the limitations of consensus sequencing. In some regions of HIV env gene (eg., V1, V2, V5), where insertions and deletions accumulate rapidly, the consensus sequence has no biological meaning, making their use for phylogenetic analyses questionable. Also, for viruses with variable region, alignment of reads to the consensus is problematic. To the best of our knowledge, not much has been published about resolving the population structure when an assembled reference is not well defined.
We present a computational framework, Mutant-Bin, for clustering individual haplotypes in a viral population and determining their prevalence based on a set of deep sequencing reads. The main advantages of our method are that: (i) it enables determination of the population structure and haplotype frequencies when a reference genome is lacking, and hence, avoids the costly clonal sequencing and compute intensive alignment required by other methods; (ii) the number of haplotypes does not have to be specified in advance; and (iii) it identifies the regions with co-occurrence of polymorphic sites in a subset of haplotypes and the frequency with which they appear in the population. Our main motivation is to use this framework to survey the genetic diversity of viral populations in situations where there is substantial structural variation among haplotypes.
Mutant-Bin is tested on both simulated and real deep sequencing datasets. We evaluate its accuracy as a function of diversity, sequencing errors, relative frequencies, and number of haplotypes. We assess its performance in isolating regions containing polymorphic sites into clusters and estimating haplotype frequencies. Also, we compare our method to the existing state of the art, ShoRAH (Zagordi et al., 2010a).
2. Methods
Consider a quasispecies with K haplotypes of genome length G that appear with a frequency of
We define the pairwise difference dij between two sequences si and sj as the number of base positions on which the two sequences differ. The diversity of a population containing K haplotypes is then,
We designate as the reference the variant with the lowest average pairwise difference in the population. The regions within the reference genome that have polymorphic sites with derived nucleotides that result in different haplotypes are called suspect regions. Even a single base difference, if it appears consistently in all copies of variants will lead to its identification as a new haplotype.
Mutant-Bin is an application of the Lander-Waterman model to viral population estimation and is based on the l-tuple (ordered sequence of length l) content of the reads. Its framework consists of three steps. First, the distribution of l-tuples within the population is modeled as a mixture of Poisson distributions, whose means correspond to the coverage of suspect regions, determined by the subset of haplotypes in which the polymorphic sites co-occur. Second, the l-tuples are clustered by their frequency using the Variable Bandwidth Mean Shift (VBMS) algorithm. We bin the l-tuples by their cluster centers to identify the l-tuples spanning the polymorphic sites that co-occur in a subset of haplotypes and determine the frequency with which they appear. Finally, we propose a greedy heuristic to bin the l-tuples by the genomes they originate from and thereafter infer the local haplotype structure.
2.1 Mixture of Poisson distributions
According to Lander-Waterman model, the probability that a base is sequenced m times follows a Poisson distribution,
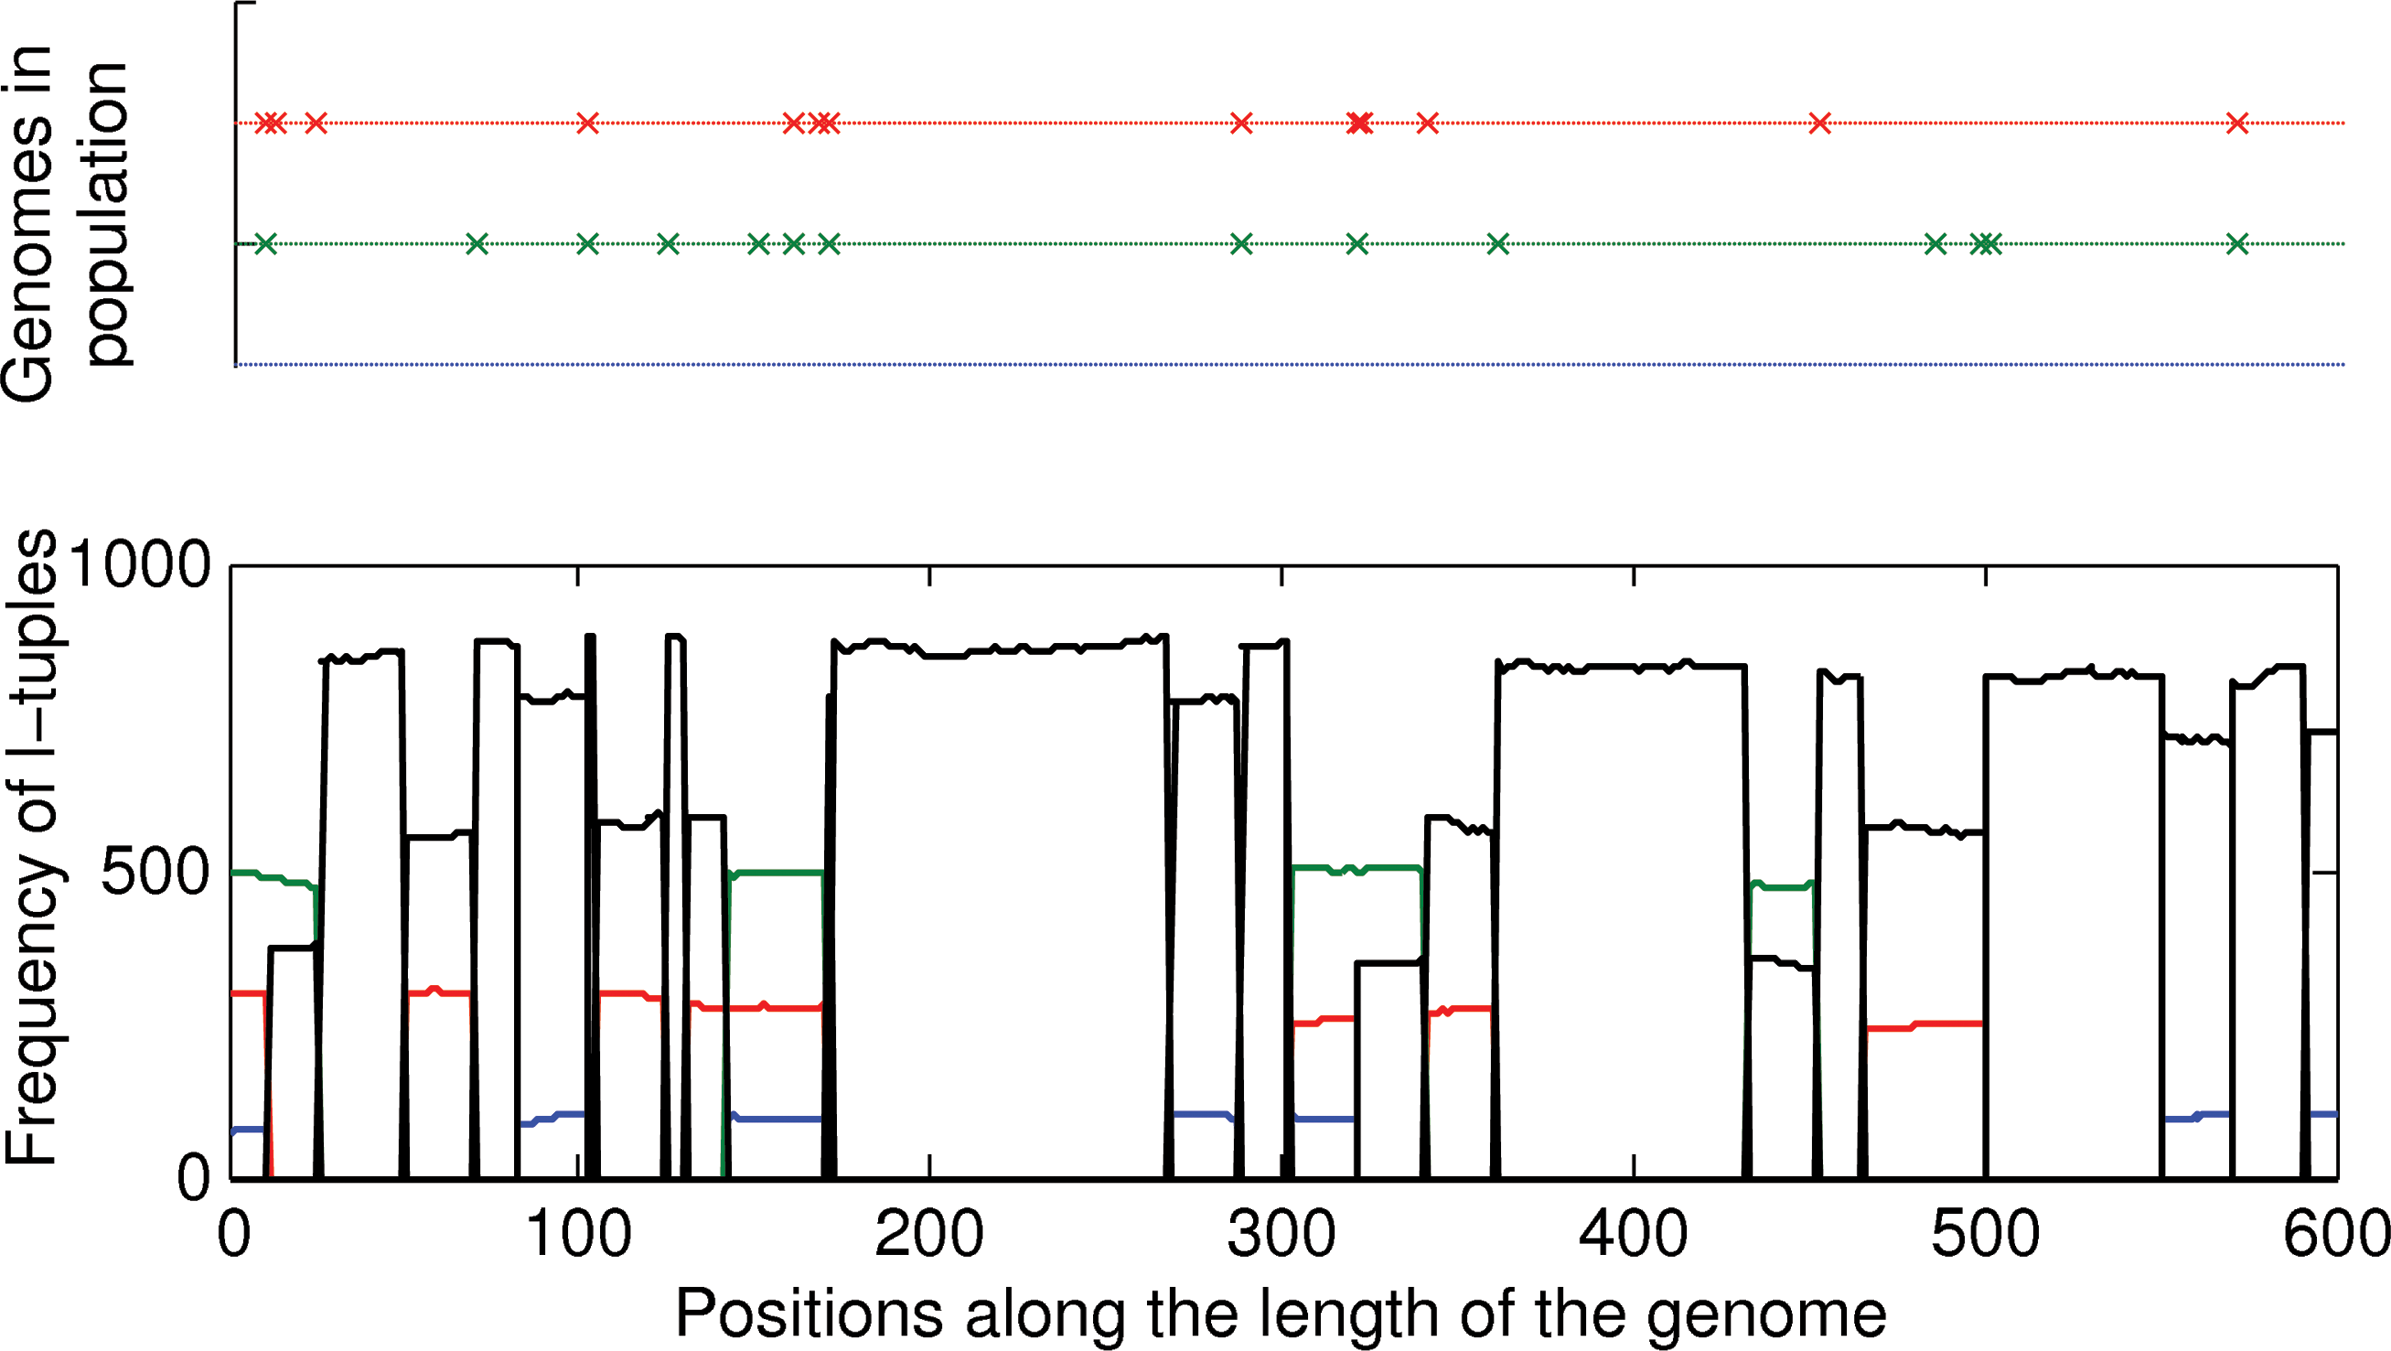
In a viral population, at any given time each haplotype occurs with a different relative frequency. In Figure 1, the frequency spectrum illustrates the distribution of l-tuples within a quasispecies being modeled as a mixture of Poissons for a population containing two haplotypes that appear with a coverage of xA and xB (proportional to their relative frequencies in the population).a The distribution of l-tuples that span the portion of the genomes that is common to both haplotypes will be Poisson with mean xA+xB and those that span the suspect regions unique to A and B with means xA and xB respectively. Now the problem of identifying different suspect regions is transformed to that of a modeling mixture of Poisson distributions.

Virus population with two haplotypes in frequencies xA and xB. Frequency spectrum of l-tuple counts in the population. The figure depicts two genomes of length G and a shaded region that corresponds to the base positions on which the two genomes differ (i.e., the suspect region).
The frequencies
2.2. Cluster l-tuples using variable bandwidth mean shift analysis
The frequency spectrum of l-tuples is multimodal with modes corresponding to the frequency of suspect regions unique to each subset of haplotypes. We propose to use VBMS method to assign each l-tuple, based on its count, to a cluster that represents a mode of the Poisson distribution. The mean shift procedure was originally described in Comaniciu et al. (2002, 2001) and adapted in Zhao et al. (2010) to detect and remove sequencing errors prior to assembly. Mean shift analysis is a robust nonparametric method that estimates the modes of the distribution. This technique is attractive, since it needs no prior knowledge of the number of clusters nor will it be affected by the variance in data due to the presence of sequencing biases.
Given the set of reads
where a is the normalization constant and hi is the kernel bandwidth that determines the range of influence of the kernel located at l-tuple i. Here,
While using the adaptive KDE
We define
This process converges at a point in which the estimate has zero gradient (Comaniciu et al., 2002) (i.e., the modes of the density). Our method clusters l-tuples based on their corresponding mode at convergence. The obtained modes will correspond to the composite frequencies,
VBMS Analysis
2.3. Greedy heuristic for the generating set
Once we determine the composite frequencies
We propose a greedy heuristic for constructing the generating set
Here,
Generating Set
3. Results
We evaluated our method on simulated and real deep sequencing data from HIV samples. All of our simulations were based on a 2000 bp region at the 5′ end of the HIV-1 genome. We used Metasim's population sampler to simulate heterogeneous HIV samples of different diversities, evolved from a single parent genome (Richter et al., 2008). Reads were generated from these populations by mixing the haplotypes in various proportions and coverage depths using Metasim, which replicates the error process of 454/Roche sequencing.
We require the size of l-tuple to be large enough to avoid repetition within the genome, yet be small enough that a large number of reads contain the l-tuple. We select a lower bound on l as 1/pl > G, where p is the probability that the most frequent nucleotide will appear at a given position and G is the genome size. When G is unknown, we approximate l using pl > NL, where N is the number of reads and L is the average length of reads (Li and Waterman, 2003). Experimentally, l-tuple length of 10 bp gives us optimal results. A default read length of 250 bp and error rate of 0.5% was used for the simulations. Note that in our method, even a single base difference, if it appears consistently in all copies, will lead to its identification as a new haplotype.
Our goal is to identify mutations that co-occur in each subset of haplotypes and the frequency with which they appear in the quasispecies. We report precision and recall averaged over different suspect regions (i.e., over the l-tuples that vary between the haplotypes and that do not include the large number of l-tuples common to all). Our method estimates cluster Cyi to contain l-tuples that span the polymorphic sites that co-occur in haplotypes
Our method derives its strength from high and uniform coverage of the data. However, sequencing biases due to both statistical (e.g., CG bias) and biological effects (e.g., mappability bias) can skew the coverage by causing certain regions of the genome to be unevenly sampled. Elimination of these biases is imperative for avoiding spurious conclusions regarding the data. In the presence of a reference genome, the adverse effects of such sequencing biases can be mitigated by normalizing the nucleotide bias in the data (Schwartz et al., 2011).
Error rates with Roche GS20 system have been estimated at 5–10 errors per kbp (Huse et al., 2007; Wang et al., 2007). We simulated datasets with sequencing errors varying from 3–40 errors per kbp, using an 454/Roche sequencing error model. Sequencing errors produce an excess of l-tuples that appear only once in the population, as opposed to polymorphic sites that appear several times. The true distribution of l-tuple counts is expected to be a mixture of an exponential distribution, for erroneous l-tuples, and a series of Poisson distributions describing the true l-tuple counts (Zhao et al., 2010). We combine two existing techniques to handle errors. Prior to clustering, our method uses spectral alignment to perform error correction (Pevzner, 2001). Subsequently, we configure our method to discard l-tuples that appear below a cutoff threshold defined by the first minimum in the frequency spectrum. More tailored approaches for error correction have been discussed elsewhere (Li et al., 2008; Zagordi et al., 2010a; Zhao et al., 2010; Yang et al., 2012). We observe from Table 1 that the outlined error correction scheme resulted in significant performance gain. Thus, Mutant-Bin is fairly robust to error rates of 2%. However, when the error rate exceeds 2.5%, the accuracy drops as more than 22% of the l-tuples are expected to be contaminated.
Parameters: Simulated datasets with two haplotypes in mixing proportion of 1:3, at diversities of 4–6%, containing 10,000 reads. If we consider an error rate of 0.5% per bp, then approximately 4.9% of the l-tuples and 71% of the reads are expected to be contaminated with at least one sequencing error.
Next, we assess the sensitivity of the method to different diversities, depth of coverage, and number of haplotypes. Figure 2 illustrates high recall values (above 0.85) uniformly at all diversities. Precision, on the other hand, is strongly correlated to diversity. The main problem at low diversities is that sequencing errors can masquerade as polymorphic sites, resulting in a low precision. The evaluation as a function of depth of coverage indicates that given uniform coverage, our method is robust to the overall depth of coverage in the population (Fig. 3). The overall accuracy for populations with different numbers of haplotypes is shown in Figure 4. For five or more haplotypes, we obtain a high precision at the cost of low recall. Even when the cardinality of the generating set obtained using the greedy heuristic is greater than the optimal, the true basic frequencies were correctly identified and formed a subset of the generating set.
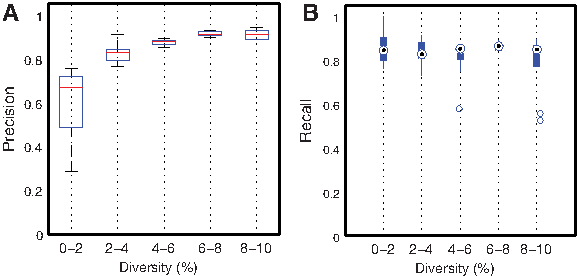
Precision (
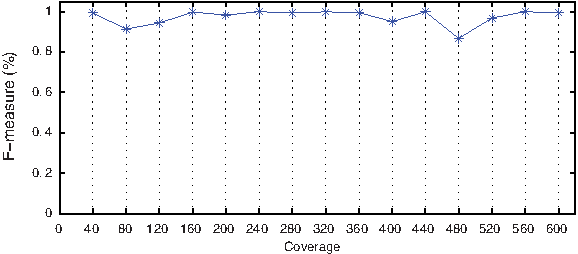
F-measure with varying coverage. Parameters: Simulated datasets with two haplotypes in mixing proportion of 1:3 at diversities of 4–6%.
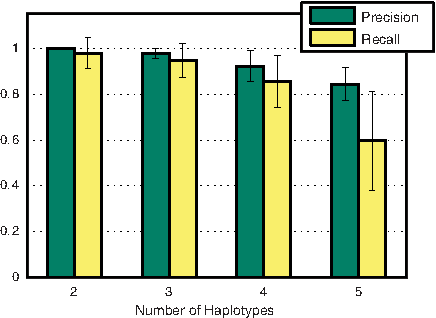
F-measure with the number of haplotypes in the population. Number of reads = 20000. Haplotypes were considered with frequencies to 1:3, 1:3:5, 1:3:5:10, and 1:3:5:10:12.
We assessed the ability of the algorithm to recover the true haplotype frequencies using the greedy heuristic. We consider populations consisting of 2 to 5 haplotypes. Figures 5 and 6 compares the estimated haplotype frequencies of Mutant-Bin and state-of-the-art ShoRAH (Zagordi et al., 2010a) on the same datasets. ShoRAH aligns the reads to a reference genome to extract a minimal subset of haplotypes that explain the observed reads, while Mutant-Bin finds the minimal set of basic frequencies that explain the observed frequencies of l-tuples and clusters the l-tuples of haplotypes with similar frequency together, without any sort of alignment. The mixing proportions predicted by our method are in agreement with the true mixing proportions and are comparable to that of ShoRAH. Note that our method being frequency-based will conflate haplotypes with identical frequencies. For instance, for a population containing four haplotypes in the ratio 1:3:3:10, our method bins the l-tuples into three clusters, with predicted frequencies in the ratio 1:3:10. Our method predicted the right number of haplotypes in 88.1% of the cases. This can be explained by the number of outliers for datasets containing haplotypes with similar frequencies. The sum of frequencies of K most frequent haplotypes predicted was more than 90% in 88.5% of the cases, where K is the actual number of haplotypes in the population. Whereas, for ShoRAH, the sum of top K frequencies accounted for 90% of the data in 98.93% of the cases.
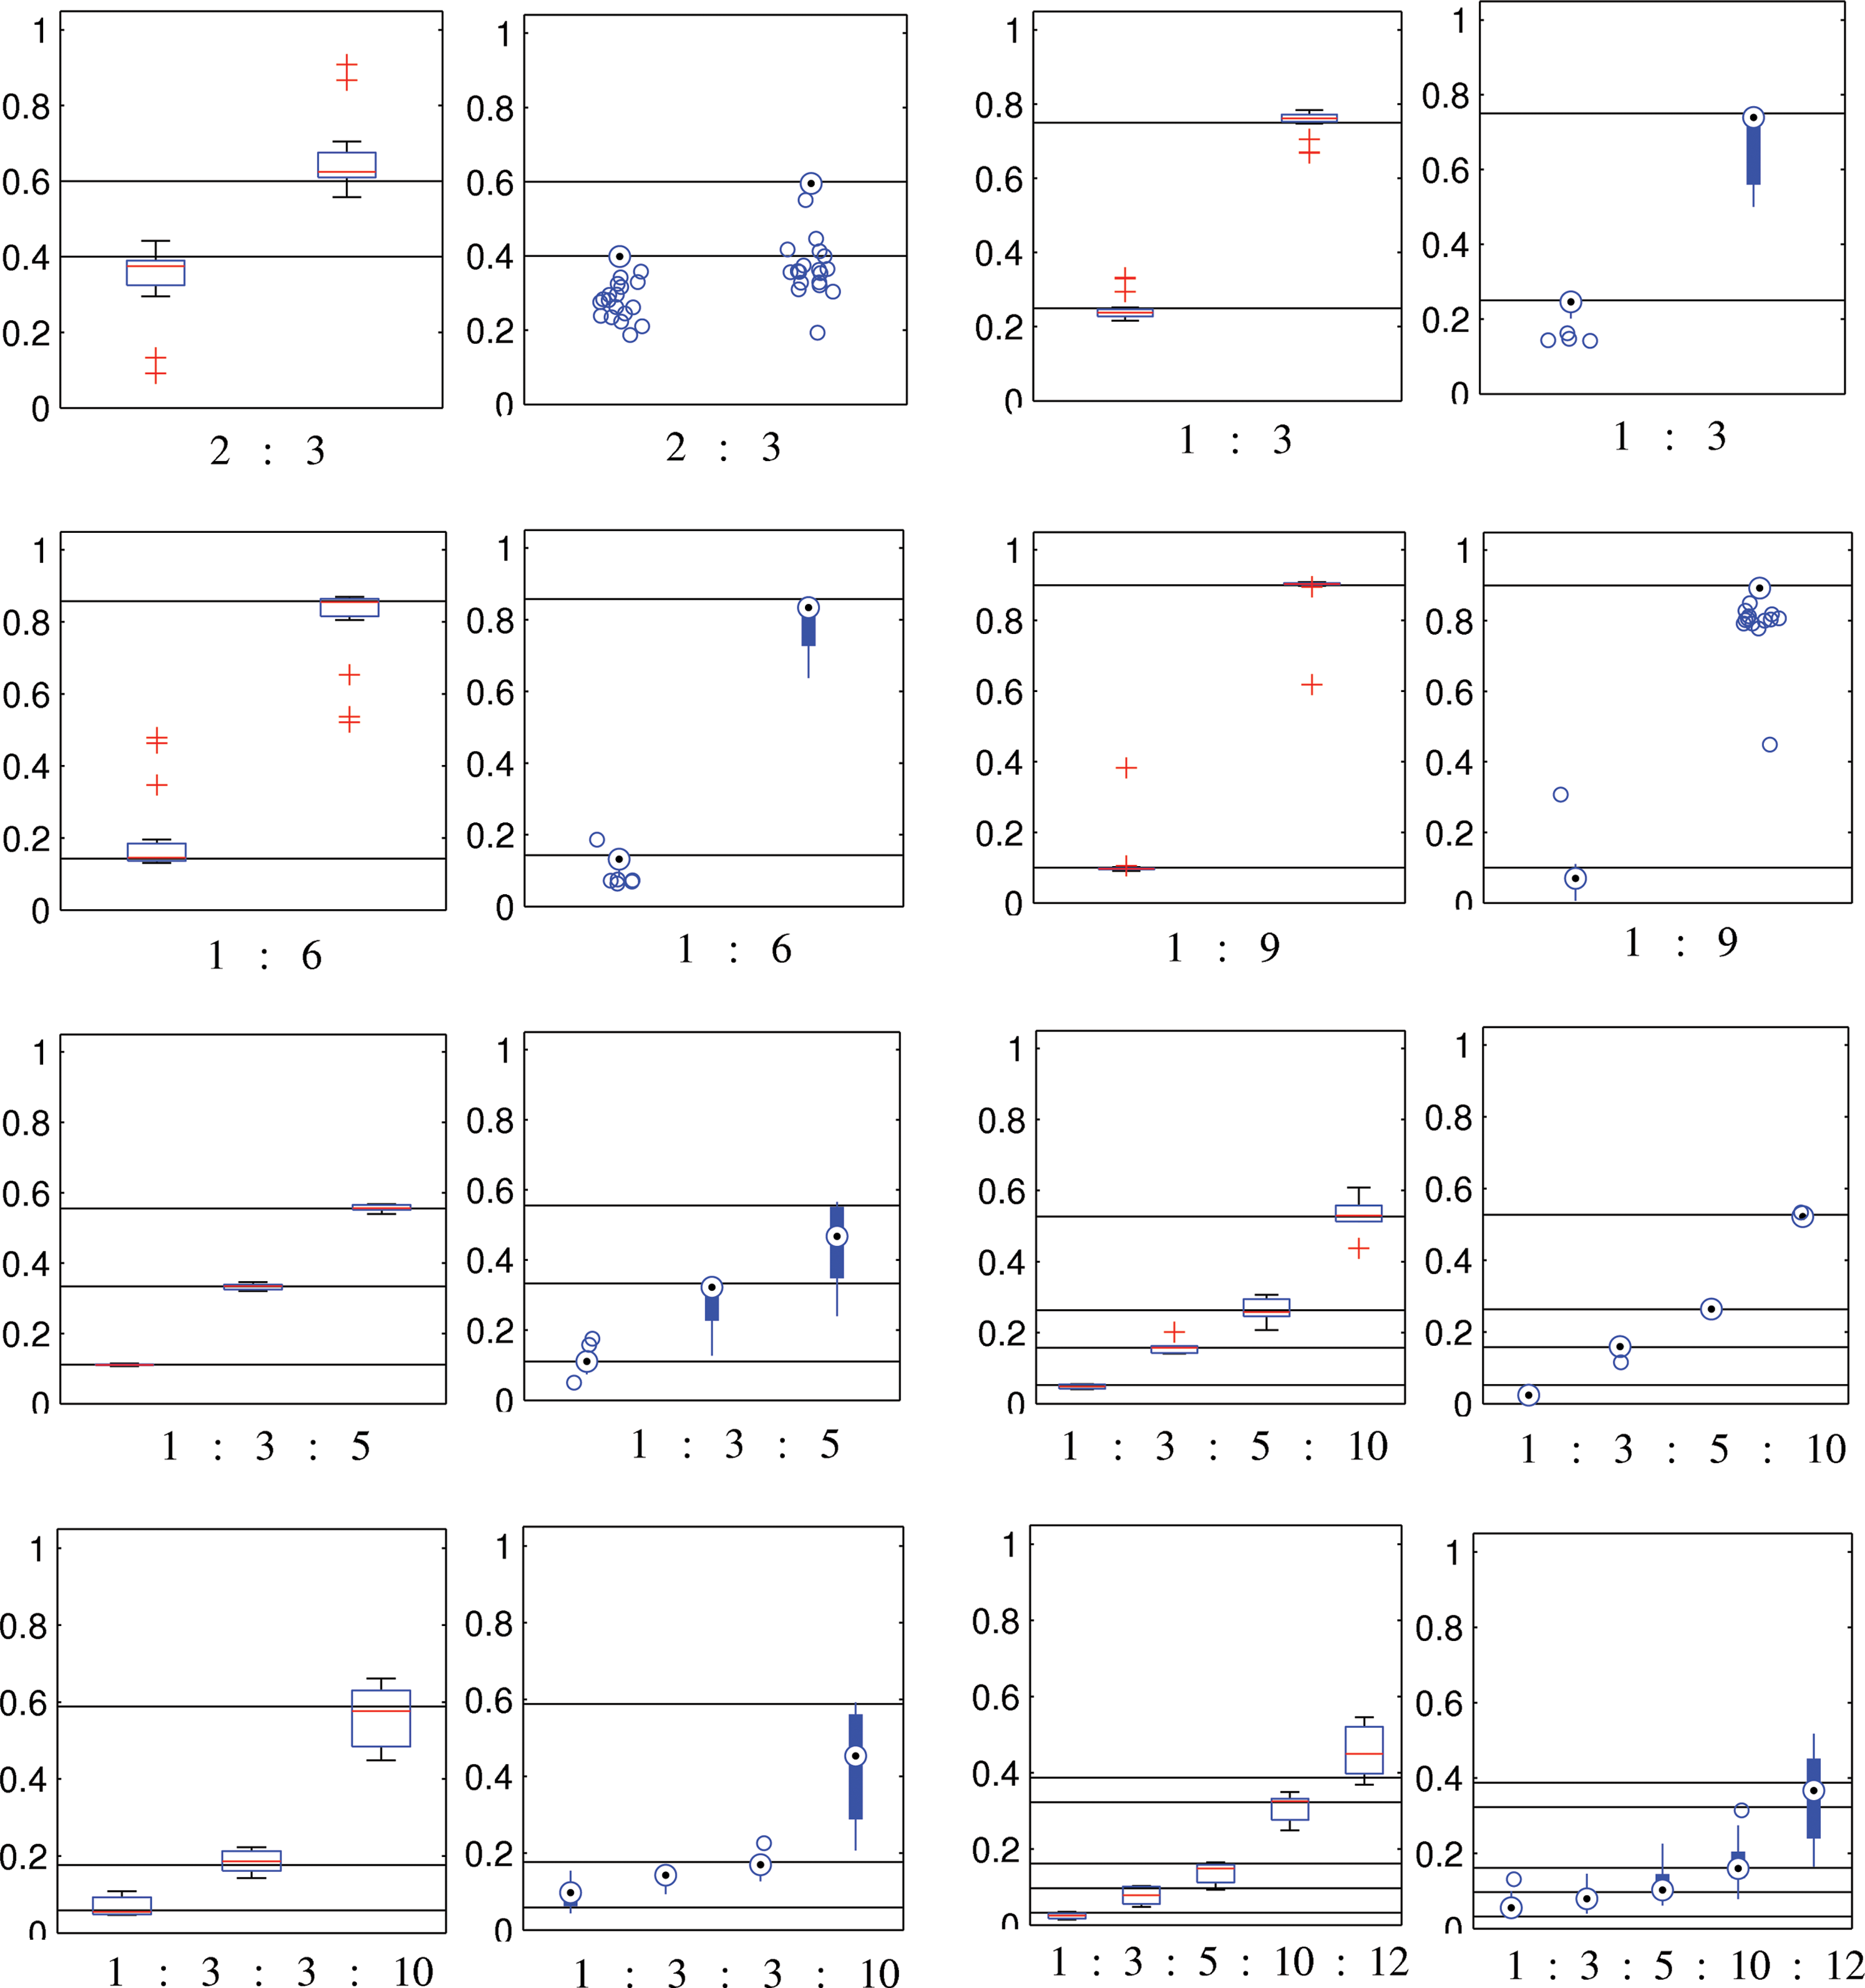
Estimated haplotype frequencies by our method (left rectangular box plot) and ShoRAH (right circular box plot) in sampling from mixing ratios (solid black lines) indicated beneath the panel for diversities 0.1–10%. All parameters of ShoRAH were set to default values, and the algorithm was run for 5,000 iterations.
Our final evaluation on real deep-sequencing HIV data obtained from 454/Roche FLX pyrosequencing platform allows for hard assessment of the performance (Zagordi et al., 2010a). Of the four datasets, two are of subtype A and two of subtype B. The 454 reads from the two subtypes, which are at a diversity of 10.9%, were taken in the proportion of 1:4. After error correction by spectral alignment, our method obtained an average F-measure of 87.3% and accurately predicted the haplotype frequencies (results for ShoRAH in Zagordi et al., 2010a). Simultaneously, we generated reads in silico with 454 sequencing errors from the 1.5 kbp region of HIV pol gene that has been sequenced from cloned sequences (Zagordi et al., 2010b). We applied our method to reads sampled from four clonal sequences that are at a diversity of 7.8%, mixed in proportions of 1:3:5:10. Our method achieved an F-measure of 94.2% and identified the frequencies of the three most frequent haplotypes correctly.
4. Conclusions
In this article we have proposed an unsupervised method for quantifying the genetic diversity of heterogeneous populations in datasets for which no reference genome is available. Phylogenetic and evolutionary studies that do not require the knowledge of the sequence itself, but only the number of variable sites and the nucleotides in these sites, can benefit from such a method. For viruses with variable regions, alignment of reads to the consensus is problematic. Hence there is much added value for methods that avoid alignment. Our method determines the population structure and haplotype frequencies without the use of a reference genome and hence, avoids the compute-intensive alignment required by other methods. Note that our method does not reconstruct the haplotypes, it identifies suspect regions within the population. Deep sequencing technologies can produce much shorter reads of about 36 bp at a higher coverage. Our method is especially suitable for such short reads, as long the length of the reads exceeds the length of the l-tuple.
In its current implementation, our model possesses several limitations. The method performs well on datasets obtained at uniform coverages. However, in real sequencing projects, the frequency spectrum will be obscured by errors stemming from the sequencing process and nonuniform coverage across the genomes. Our method relies on the frequencies of the haplotypes in the population being distinct, which cannot always be guaranteed. Determining exact values of composite frequencies is one step that is difficult with the increase in the number of haplotypes and reduced coverages. However, with better mode detection algorithms and high depth provided by NGS technologies, it should be possible to obtain a good separation between the distributions and improve the scalability of the method with the number of haplotypes. Currently, the output of our method is a cluster of l-tuples, each corresponding to a haplotype in the population. We intend to extend our method to enable reconstructing the l-tuples in each cluster into a genome of the corresponding haplotype. Given how mutations occur within a population, it is possible to predict the shape of the frequency spectrum in theory (Johnson and Slatkin, 2006). Using our method, we can work backward to infer the population parameters and the evolutionary tree, given the shape of the spectrum. Such analyses play an important part in evolutionary and population genetics.
We foresee the application of this method in the context of cancer and bacterial communities that are also characterized by increased genetic diversity. The method can also be used for calling SNPs without a reference genome and will have application for conservation efforts of nonmodel organisms and endangered species (Ratan et al., 2010). An SNP commonly has only two haplotypes in the population and hence, determining the composite frequencies will be much easier.
Author Disclosure Statement
The authors declare that no competing financial interests exist.
Footnotes
Acknowledgments
We are grateful to Osvaldo Zagordi and Niko Beerenwinkel for providing the HIV deep sequencing data.
a
The frequencies of the haplotypes in the population can be approximated by their coverages. Hence, we use the terms interchangeably.