
Abstract
Abstract
Nowadays, the reconstruction of genome-scale metabolic models is a nonautomatized and interactive process based on decision making. This lengthy process usually requires a full year of one person's work in order to satisfactory collect, analyze, and validate the list of all metabolic reactions present in a specific organism. In order to write this list, one manually has to go through a huge amount of genomic, metabolomic, and physiological information. Currently, there is no optimal algorithm that allows one to automatically go through all this information and generate the models taking into account probabilistic criteria of unicity and completeness that a biologist would consider. This work presents the automation of a methodology for the reconstruction of genome-scale metabolic models for any organism. The methodology that follows is the automatized version of the steps implemented manually for the reconstruction of the genome-scale metabolic model of a photosynthetic organism, Synechocystis sp. PCC6803. The steps for the reconstruction are implemented in a computational platform (COPABI) that generates the models from the probabilistic algorithms that have been developed. For validation of the developed algorithm robustness, the metabolic models of several organisms generated by the platform have been studied together with published models that have been manually curated. Network properties of the models, like connectivity and average shortest mean path of the different models, have been compared and analyzed.
1. Background
One of the new research fields that emerges from this panorama is systems biology (Snoep et al., 2006): the bottom-up approach to quantitatively explaining the properties of biological systems from the modeling and simulation of the interactions and characteristics of its macromolecular components. From these systematic studies based on mathematical modeling and computational simulations, a new discipline appears: synthetic biology, which is focused on the design and construction of “a la carte” new biological entities with new biological functions (Heinemann and Panke, 2006). This new field of biotechnology lies in the limit between biology and engineering and aims at the partial design of modified organisms for different technological applications. For this purpose, rational design principles of engineering must be combined with the available biological information and biotechnological techniques. The huge amount of biological information and the complexity of the engineering principles and analysis tools make evident the need for a good computational platform that aids in the data mining and design development for artificial biological systems.
One of the cornerstones of systems biology is the reconstruction of genome-scale metabolic models. This means to gather information on all enzymatic reactions that take place in an organism based on genetic information available for this organism's genome. The current state of art of this process requires the effort of a specialist during a long-term period (usually one year) in order to collect the available information from many different databases and the literature. Currently there are few software applications specially designed to help in this specific task. Moreover, different available software applications are too specific for a few determined tasks that do not embrace all steps in the whole process, leaving huge gaps that must be filled manually by the researcher.
The genome-scale metabolic reconstruction is the starting point of many different researches and applications, like the determination of the metabolic capacities or the determination of protocols for an optimal growing strategy for some organism, and in particular, the search for potential sites for metabolic engineering (Oberhardt et al., 2009; Patil et al., 2004). The aim of metabolic engineering is the modification and/or introduction of biochemical reactions with technologies, like recombining DNA, to optimize the production of some metabolites of interest in order to redirect metabolic fluxes to new pathways or even extend the metabolic capacities of an organism for the production of new metabolites. The accomplishment of these objectives for a specific organism depends on a good reconstruction of its metabolism, from which one can study the structure of the metabolic network and the consequences of adding or deleting specific genes (Edwards et al., 2001).
In this context, several projects have been developed for the reconstruction of genome-scale metabolic models with different ends, like the production of fuel from cyanobacteria (Montagud et al., 2010) or yeast. Other examples are the genome-scale metabolic reconstruction of the Burkhoderia cenocepacia J2315 (Fang et al., 2011) for research of treatment in patients suffering from cystic fibrosis; the Rhodobacter sphaeroides (Imam, 2011), capable of producing hydrogen, polyhydroxybutyrate, and other biofuels; the Clostridium beijerinckii (Milne, 2011) capable of producing butanol.
Genome-scale metabolic models result from the integration of genomic, proteomic, and metabolomic information obtained at different experimental levels. The study of these theoretical reconstructions of cell metabolism allows researchers to investigate emergent phenomena in biology, like the feedback control loops that regulate the organisms and other aspects of metabolic and genetic transcription and regulation. The metabolic models constitute an important tool for the comprehension of an organism, its metabolic capacities, and prediction of its responses to different environmental and genetic changes. Moreover, they facilitate the development of strategies for the engineering of metabolic systems focused on the improvement of metabolic efficiency.
The process, in order to generate the models, consists of a first step to collect all available information on the metabolome of a species, as well as all genes that code for different enzymes that catalyze each one of the metabolic reactions that take place in cell metabolism. Other aspects that must be taken into account are the coenzymes and cofactors needed for the enzymatic catalysis, the stoichiometry and reversibility of the reactions and information on the biomass composition and metabolic regulation (Förster et al., 2003). Among all possible applications of a metabolic model, there is the possibility of evaluating projects for production and optimization of a metabolite of interest (Oberhardt et al., 2009). If a model is satisfactorily constructed, it should allow a realistic simulation of the organism's metabolism, submitted to different environmental and genetic perturbations. This simulation would represent, with its natural restrictions, a virtual organism or an “in silico” cell in which one can apply different computational algorithms to explore possible flux distributions inside the cell subjected to different environmental conditions and genetic configurations (Montagud et al., 2010). For the analysis of metabolic models, there are several computational tools and algorithms already developed (Edwards et al., 1999). Those include flux balance analysis (FBA) (Varma and Palsson, 1993, Edwards et al., 1999), minimization of metabolic adjustments (MOMA) (Segre et al., 2002) and metabolic flux analysis (MFA) (Schilling et al., 1999; Varma and Palsson, 1994) among others.
Currently, researchers that work in the genome-scale metabolic reconstruction use different computational tools in order to accomplish different tasks. For example, in order to generate the list of biochemical reactions for a specific organism, the software Pathway Tools (Karp et al., 2002) is a common choice. This software allows the compilation of specific databases for proteins, enzymes, and metabolites of a determined organism, and to obtain a rough draft for the network. Nevertheless, it might be said that this software obtains the list of reactions with no regard to associations between metabolic routes and the reactions, or to completeness and unicity criteria for such models. These drawbacks leave a considerable amount of work to be done manually by the biologist, who has to consider the reversibility of all reactions and the analysis of possible repeated reactions inside the model, as well as the inclusion of reactions studied for other organisms that complete specific metabolic pathways but do not show up in the database due to gaps in the genomic annotation for the organism at hand. Other specific software might be found with different computational algorithms implemented, like the Optgene software that includes an evolutionary programming-based method to rapidly identify gene deletion strategies for optimization of a desired phenotypic objective function (Patil et al., 2005).
The lengthy work of reconstructing a genome-scale metabolic network and analyzing it would be much faster and greatly simplified if one could find all algorithms and computational tools needed in the same software or platform. The aim of this work is to present a platform developed by our research group in order to automatically generate genome-scale metabolic models. With respect to other software that might be found for this purpose, our platform has the advantage that it automatically takes into account the criteria for unicity of the biochemical reactions and presents the possibility for the biologist to automatically complete gapped metabolic pathways based in probabilistic criteria and comparison of the same metabolic route in different organisms. Moreover, the platform produces the metabolic generated network in different outputs: either as an SBML file or directly as an OptGene file format that might be directly piped in other analysis software. For the generation of the OptGene file, the biologist is also given the possibility to choose the biomass composition among the metabolites appearing in the model and directly fulfill the restrictions for the flux analysis and balance.
The work is divided as follows. In the next section, we explain the algorithm for the generation of genome-scale metabolic models implemented in a web-based platform. The algorithm automatically obtains information from the KEGG database for a specific organism and constructs from it the list of reactions in its metabolism. Criteria of unicity and completeness are taken into account in order to cope with different enzymes catalyzing the same reactions or to fill in missing reactions. Section 3 presents an analysis done with the models generated by the platform. The generated OptGene files are used as inputs in different algorithms to study network properties of the reconstructed metabolic models and compare them with manually reconstructed models taken from the literature. In the end, we present our conclusions, an overview, and future perspectives.
2. Methods
The algorithm for automatically generating metabolic models comprises several steps. The information compilation from free-access biological databases, following some interaction of the user with the platform in order to properly select the parameters for the probabilistic criteria and choices for the biomass components and restrictions, and finally application of unicity and completeness criteria and production of the output.
2.1. Obtaining the biological information
In the last years, applications of biotechnology in different areas of science and technology have considerably increased, causing an exponential growth on the available information about different organisms on their genetics, regulation processes, and metabolism. Such information, obtained by different techniques with growing efficiency, becomes part of huge databases, many of which are free to access. This information, together with the vast published scientific work, pus in the hands of researchers a rich, ever-growing amount of data and information.
A starting point for the genome-scale metabolic reconstruction is to obtain the relevant information about the organism for which the model is going to be generated, namely the list of reactions, genes, metabolites, and enzymes present in the studied cell. This information is available from public free-access databases like Biocyc (Karp et al., 2005), KEGG (Kanehisa et al., 2008), Brenda (Chang et al., 2009), Uniprot (Uniprot, 2008), etc. Nevertheless, the lack of quality in some entries of the databases are an inconvenience that one must amend: false positives, false negatives, as well as objects wrongly annotated, may pose obstacles in the efforts to compile a meaningful correct list of reactions (Weise et al., 2006). As a consequence, the reconstruction must be done under strict control of all the reactions, the biomass equation must be based in constituent molecules, and coherence and integrity of the network must be prerequisites for the generation of a quality and useful model (Feist et al., 2009).
The first objective of the project is to obtain the relevant rough information. For this aim, we have chosen to use KEGG API web service offered by the KEGG database. This service allows one to access the KEGG system via SOAP/WSDL, which offers valuable tools in order to access the available information in the above-mentioned database. These tools are designed for the search of cellular biochemical processes as well as analyzing the universe of genes and completed genomic sequences of thousands of organisms. The users might access KEGG API server by the simple object access protocol (SOAP) technology through HTTP protocol.
SOAP defines how two objects in different processes may communicate through exchange of XML (extensible markup language) data for a variety of bioinformatic applications. With this protocol, an application running in a machine anywhere in the world can use algorithms, data, and resources stored in different servers (Snell et al., 2001). Web services description language (WSDL) is based in XML and allows one to have the description of a web service, specifying the abstract interface through which a client may access the service and the details on how to use it (Christensen et al., 2001).
These technologies allowed us to access KEGG API and to construct a service web client using Java (Horstmann, 2010) as programming language and Netbeans (Myatt, 2008) 6.8 as integrated development environment. This way, we obtained biological information from the definition of directional data model that relates biological elements for its storage in a database constructed in Postgres (Smith, 2010; Bourne, 2005; Altman, 2004), taking into account the relationships among them and their importance in the reconstruction of the genome-scale metabolic models. The relevant biological elements identified at this point are the organism, gene, pathway, enzyme, reaction, compound (metabolites and glycans), and the references. In Figure 1, we show a schema of how information is organized and related in the KEGG database, as well as the methods to obtain the relationships between the different elements.
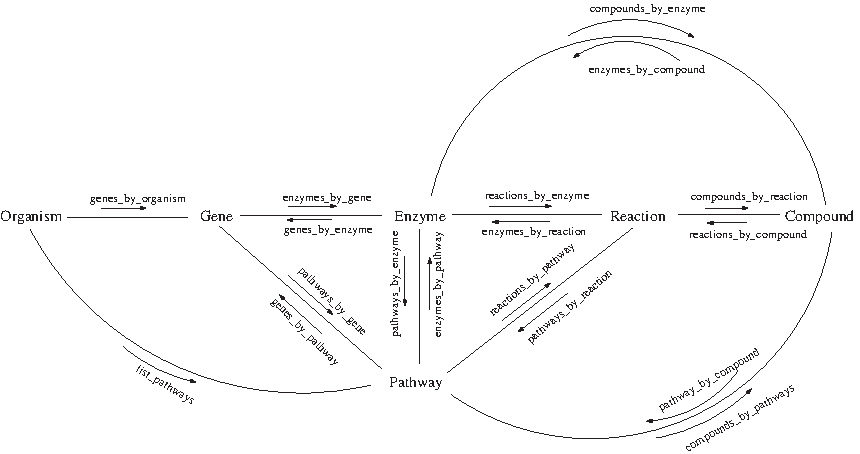
Scheme of KEGG information with the WSDL method for obtaining information. The same methods that appear referencing compounds also exist for glycans (which are not shown in the figure).
2.2. Computational platform for the access of biological information (COPABI)
All the biological databases available on the internet offer a web application to display their information, as well as methods for exporting this information in different forms. The first aim of our project is to implement an application that allows biologists to consult the relevant information from the database and automatically generate metabolic models from it, where probabilist criteria for unicity and completeness are taken into account in order to generate more accurate models with greater quality in an efficient way. The platform resulting from the project is named COPABI (from computational platform for the access of biological information).
Every web application requires for its publication a web server, which is responsible for taking client requests and answering them. In the case of COPABI, the chosen web server application is Apache, an open-source code that works under any platform and has become one of the best web servers in terms of efficiency, functionality, and speed (Tong, 2008).
In order to select the tools for the implementation of COPABI, it has been taken into account that among the possible web applications there are two major groups: the languages that run from the side of the server, like PHP, and the ones that run from the side of the client, like HTML (Castro, 2006), Javascript (Stefanov, 2010), etc. In the case of COPABI, PHP has been chosen because it is an open-source and very popular programming language, especially in web development (Gutmans et al., 2004; Schlossnagle, 2007). As web application framework (WAF), we have used Codeigniter 1.7.3 (Upton, 2007). The aim of this framework is to aid in the development of code, from a rich sample of libraries, a simple interface, and a logical structure for accessing the libraries. Javascript has been used for interactivity of the pages and for validations and the completion of data in the search for biological information.
2.3. Formats for the output
Different analysis tools in systems biology make use of different file formats. Therefore, a good choice for the output file format will be determined by the uses and utility of the generated models. Some examples of file formats used by different databases are: SBML (System Biology Markup Language) (Hucka et al., 2003), FASTA (Fast All) (LLC Books, 2010), BLAST (Basic Local Alignment Search Tool) (Camacho et al., 2008), and KEGG presents its information in a particular markup language called KGML (Kanehisa and Goto, 2000).
The lack of a standard makes the use of different softwares that usually have specific formats for their inputs and output more difficult. Sometimes the user has to go through the lengthy work of converting the information from one format to the other. One of the most versatile formats is certainly SBML, since it is a description language based on XML that can be used to represent models of different biological processes like metabolic network, cellular signaling pathways, genetic regulation networks, among others. A very useful file format specific for metabolic networks is the one following the input requisites for the OptGene software (Patil et al., 2005), also called BioOpt and used in BioMet toolbox (www.sysbio.se/biomet).
For the COPABI platform, these two output file formats have been chosen: the standard SBML level 2, version 1, and the OptGene file format, which can be readily used for flux balance analysis.
2.4. Construction of the models
For the generation of metabolic models for any organism, the applied methodology follows the same steps used in the manual reconstruction of the first model of a photosynthetic organism, the Synechocystis sp. PCC6803 (Montagud et al., 2010), also taking into account the probabilist criteria followed in this article in order to deal with duplicated and missing reactions, which will be discussed later.
About the list of reactions in the reconstruction of the metabolic model, before applying the probabilist criteria one has to properly organize and identify the chemical reactions. Three issues should be noted here:
• First is the compilation of all chemical reactions of a particular pathway present in the organism. There are two kinds of reactions that one has to take into account: most reactions are catalyzed by enzymes and each enzyme has a code called EC (enzyme commission); each reaction in the model receives this number as its identifier. On the other hand, there are a few reactions in some pathways that are not catalyzed by enzymes; they are spontaneous reactions instead. These spontaneous chemical reactions receive as their identifier the name “non-enzymatic” and a number after it, indicating the order in which these reactions appeared. • Next is related to enzymes that can catalyze different reactions of the same type. This usually happens because different substrates have very similar structure and can couple to the enzyme that performs its catalytic activity. In these cases, next to the EC number of the enzyme, in the identifier there's an extra letter (a,b,c, … ). • In a last step, the reversibility (or irreversibility) of each reaction in a pathway is checked from KGML files for every pathway present in an organism.
Example of output from Synechocystis sp. PCC6803 in OptGene format follows (the symbol # indicates comments, and we use it for specifying the name of the metabolic pathway):
-REACTIONS # Glycolysis / Gluconeogenesis 1.2.4.1a: Pyruvate + Thiamin diphosphate -> CO2 + 2-(alpha-Hydroxyethyl)thiamine diphosphate 2.7.1.40a: ATP + Pyruvate -> ADP + Phosphoenolpyruvate 6.2.1.1a: ATP + CoA + Acetate -> Diphosphate + AMP + Acetyl-CoA 1.2.1.5a: H2O + NAD+ + Acetaldehyde <-> NADH + Acetate + H+ 1.1.1.2: NADP+ + Ethanol <-> NADPH + H+ + Acetaldehyde # Citrate cycle (TCA cycle) 1.1.1.42a: Oxalosuccinate <-> CO2 + 2-Oxoglutarate 1.1.1.37: NAD+ + (S)-Malate -> NADH + Oxaloacetate + H+ 2.3.3.1: CoA + Citrate <-> H2O + Acetyl-CoA + Oxaloacetate 6.2.1.5a: ATP + CoA + Succinate <-> ADP + Orthophosphate + Succinyl-CoA
2.5. Probabilistic criteria
Until this point, the reconstructed model will have exactly the same information stored in the database. The next steps are the implementation of automatic algorithms that will take into account the probabilistic criteria in order to complete missing gaps in some metabolic pathways (completeness) or to exclude duplicated reactions (unicity).
2.5.1. Unicity
For the unicity criteria, the algorithm identifies reactions that appear more than once and also identifies their enzymes. Repeated reactions must be eliminated, and the criteria to choose which reaction is eliminated follows: The enzyme that appears less frequently in the model is not eliminated. As an example, we show the reactions:
1.2.1.12a: A + B <-> C + D 1.2.1.12b: G + E <-> K + L 1.2.1.12c: P + V -> Y 1.1.1.1: G + E <-> K + L
In the example, enzyme EC1.2.1.12 catalyzes three different reactions, one of which is the same as the reaction catalyzed by enzyme EC1.1.1.1. Following the algorithm criteria, reaction 1.2.1.12b is eliminated from the metabolic model.
2.5.2. Completeness
The addition of new reactions to a metabolic model is associated with the comparison between the information available about the metabolic reactions in a determined pathway of a specific organism with a general pathway (theoretical one) generated from the compilation of all metabolic reactions present in “all” organisms in nature. In many cases, the genomes are not perfectly annotated and some genes are missing from the annotation. This comparison of pathways is a tool to help biologists identify these missing genes.
The reactions associated with gaps identified in a particular pathway are going to be added to the metabolic model if they satisfy the following criteria:
• The reactions have as final product a metabolite belonging to the biomass equation. • The reactions present in the model in this pathway correspond to, at least, a determined percentage of the whole general pathway.
The COPABI interface allows the user to choose the metabolites that compose the biomass equation, as well as the percentage value used in the second criteria.
The reactions added to the model with these criteria are added to the end of the output after a comment (# not pres ! ∼∼IMPORTANT, following X reactions not in sequence!!∼∼), and their identifier is the correspondent EC number with the symbol “·” preceding it.
3. Results and Discussion
For the validation of the metabolic models generated by the COPABI platform, we have analyzed the models generated for determined organisms with manually curated metabolic models taken from the literature. First, we analyze general properties of the generated models (number of metabolites, reactions, … ) and properties of the networks described by the metabolic model.
From the network point of view, each metabolite of a model can be thought as a node and each reaction represents links between the metabolites in the left-hand side with the metabolites on the right-hand side of the reaction equation. These links can be directed if one takes into account the direction of each reaction and the reversibility of the reactions, or undirected if one neglects this information.
In a first step of the analysis, our algorithms generates an automatic debug of the metabolic models. This means looking for bad reactions, without substrates or products (some transport reactions in the SBML files taken from the literature presented in this issue), reactions in which the same metabolite appears as substrate and product or reactions decoupled from the network, meaning that at least one substrate and one product of the reaction appears only in this reaction and nowhere else. All these bad reactions are excluded from the models before any calculation is done, because these bad reactions add up errors and uncertainties to the results.
Each metabolic model now represents a network, and as a first step, we have chosen to work with the directed version of it, meaning that the links connecting two metabolites have direction from the substrate to the product, and in reversible reactions, the pair of metabolites would have two links from opposite directions connecting them.
For each organism, two versions of the metabolic model have been generated with two different values for the parameter appearing in the decision-making process for the completeness criteria, explained in the previous section. In one model, the parameter is chosen to be 100% and in the other 10%, two possible extremes. Taking this parameter to be 100% means that only reactions for enzymes that are annotated in the genome of an organism will be written to the model. On the other hand, if the parameter is taken to be 10% (a fairly low value), it means that if one out of ten reactions in a pathway are annotated in the genome, the generated model will have all reactions in this pathway. In the end, for each organism there are three models being studied, two automatically generated by the COPABI platform, and one manually constructed as taken from published works. The models taken from the literature correspond to the following organisms: the Synechocystis sp PCC6803 (Montagud et al., 2010), Synechococcus elongatus PCC7942 (Triana et al., in preparation), Burkhoderia cenocepacia J2315 (Fang et al., 2011), Rhodobacter sphaeroides (Imam 2011), Clostridium beijerinckii (Milne, 2011), Mycoplasma genitalium (Suthers et al., 2009), Lactobacillus plantarum (Teusink et al., 2006), Thermotoga maritima (Zhang et al., 2009) and Yerisinia pestis (Navid and Almaas, 2009).
In Table 1, we show results for the general comparison of the models. As one can see from this table, although the networks usually have hundreds of different metabolites, two different metabolites are on average only three steps apart from each other. As a consequence, the whole network should very quickly respond to changes in any of the metabolites' concentrations or to environmental perturbations. This closeness of the nodes in the network is known as small-world behavior and is a consequence of a property of the network connectivity know as scale-free distribution. Metabolic networks are known to follow a free-scale distribution for node connectivity, meaning that the number of nodes P with some number of connections x follows a power law: P(x) ∼ x-γ where γ is usually a number between 2 and 3. From this law, one concludes that there are very few nodes with a large number of connections (these are called hubs), and most of the nodes have very few connections.
In column # Met., one can see the number of different metabolites (or compounds) found in each model, and in column # Reac, the number of reactions present in each model (after excluding bad reactions). In columns % Rev and % Irr, we show the percentage of the reactions that are reversible and irreversible, respectively. Column ASP has the calculated average shortest path (for each pair of metabolites in the model we have used Dijkstra's algorithm to calculate the shortest path connecting them in the network) and column σASP has the standard deviation for the ASP calculation. Columns NR and NU show the number of pair of metabolites for which a path connecting them was and was not found, respectively (one should note that the network is directed, so metabolites that have no link pointing in their direction can not be reached by any pair and are therefore either external metabolites that should be absorbed by the cell from the environment or badly incorporated into the model).
When studying node connectivity, for each metabolite an algorithm counts how many reactions it appears as a substrate (or product in reversible reactions). In Figure 2, we show results for the three metabolic models of some organisms. It is clear from these plots the tendency of the distribution to follow a power law.
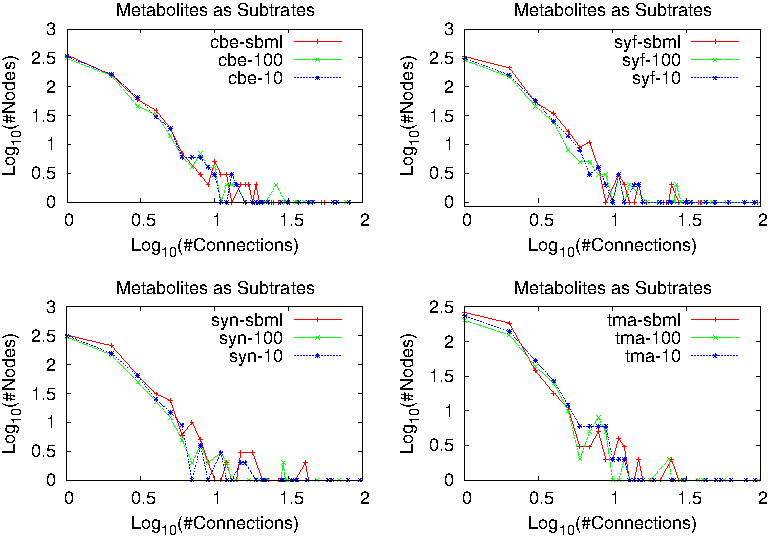
Connectivity distribution for the three metabolic models in different organisms.
As one can see, all metabolic networks are very similar when studying their global network properties. Therefore, in order to be able to differentiate the metabolic network of one organism from the network of another organism, one has to look into the details of the networks, namely specific metabolites and hubs that are particular for each organism.
In order to find these differences, we are going to define a similarity parameter to measure the degree of similarity of two metabolic networks. Two criteria are taken into account in the definition of this parameter: first, the metabolites present in each metabolic network and the degree (number of connections) of each metabolite to all others. Since important metabolites for one organism might be different from the essential metabolites in another, we would like to take into account the identity of the metabolites in the different connections and not only the number of connections. This step is rather tricky, because the metabolites' names used in the metabolic models taken from literature do not follow any standard, and the authors of each model chose different abbreviations and names for each compound. For some models, however, the authors have also made available the association of each compound name used in their models with a KEGG identifier. For these models, we were able to construct an algorithm that translated the metabolic model to the same standard metabolite names used by KEGG, and therefore, we were also able to compare the metabolite identities.
3.1. Network comparison
Our goal here is to define a distance between two networks. We call it a distance in the sense that the bigger the value of this number, the more the two networks differ, while the smaller the number, the closer the networks are.
Given two metabolic networks, each one has a set of metabolites (let's call the set in each network by set A and set B). Among all metabolites in the two networks, there are three different sets: metabolites particular to network A, metabolites particular to network B, and metabolites common to the two networks:
Now, let's consider the connections of the metabolites. Each metabolite i has ni connections in total and nαi connections only to metabolites in the set
Let's define the number of metabolites in each set and the total number of connections inside each set:
Here, ∥C∥ means the number of elements in the set C.
Now, for each set, let's sum the proportion of connections of each metabolite to metabolites inside the set, weighted by the inverse of the total number of connections and averaged for all metabolites.
Analogously, we define β and γ for the metabolites in the other two sets.
The distance between the two networks is defined as:
For an identical network, α and β are zero, so dist = 0. For two networks that have not one single metabolite in common, γ = 0 and so dist = ∞.
For validating our models, we proceeded by doing this rough comparison, calculating the distance between each one of the automatically generated models to each model taken from the literature. In Table 2, we show results for the comparisons between five models taken from the literature with the automatically generated ones. As one can observe, the smallest value of the comparison in each column is when comparing the literature model with the automatically generated one for the corresponding organism.
In boldface are the smallest number in each row, showing that the best comparison between models is when comparing models of the same species.
This is a rough comparison, since the identification of the metabolites' names is not perfect. Moreover, since the automatically generated models have not yet been used in flux balance analysis, there is no distinction between internal and external metabolites, and we used a version of these models where no biomass was defined. This introduces a lot of errors and uncertainties in the comparison made, because the models from the literature do have these features defined, and they appear, from the point of view of the comparing algorithm, as new and different metabolites for which there will be no counterpart in the automatically generated models. Despite these pitfalls, the features already contained in the models are enough to differentiate the various organisms when compared to models from the literature.
4. Conclusions
We presented here the metabolic models automatically generated by an algorithm developed by our research group. This algorithm, implemented in the COPABI platform, is capable of automatically downloading genomic, metabolomic, and proteomic information from the KEGG database, and constructing, from this information, a genome-scale metabolic model either in OptGene or XML (SBML) file formats. The tools presented here will soon be made available on the internet.
The metabolic models generated have been throughly analyzed by standard algorithms in order to calculate average shortest mean path between nodes in the network and connectivity distribution. Commonly observed features in these networks are small-world behavior and scale-free distribution for the nodes degree.
After a general analysis of the global properties of the networks, we proceeded to compare the automatically generated models with manually curated models from published works. For this task, a distance parameter between metabolic networks has been defined. The comparison shows that the automatically generated models are consistent with manually constructed models found in the literature.
The reconstruction of genome-scale metabolic models is an important step in different areas of research related to systems biology. Nowadays, this is a lengthy and slow process that might take over a year to be completed for a single organism. The algorithm developed here will certainly speed up the process and help researchers gain access to reconstructed models for any organism in just a few days, time.
Footnotes
Acknowledgments
The authors would like to thank Alberto Conejero for his useful discussions. This work has been funded by MICINN TIN2009-12359 project ArtBioCom from the Spanish Ministerio de Educación y Ciencia.
Disclosure Statement
The authors declare that no competing financial interests exist.