
Abstract
Abstract
Protein-based virtual screening plays an important role in modern drug discovery process. Most protein-based virtual screening experiments are carried out with docking programs. The accuracy of a docking program highly relies on the incorporated scoring function based on various energy terms. The existing scoring functions deal all the energy terms with the equal weight function or other weight function derived by physical characteristics. These existing scoring functions are not protein dependent. We expect that a protein-specific scoring function, which can reflect the protein characteristics, may improve the docking results. Therefore, we propose a protein-specific rescoring approach to select potential ligands by adjusting the weights of energy terms. The protein-specific scoring function is based on the linear regression analysis associated with an outlier detection approach. The scoring function incorporated in DOCK program is used as the model system. The performance of our method was evaluated by the DUD docked data set, which contains 40 protein targets. The study results show that this method can improve the enrichment factors for most of the 40 protein targets. We further expend the protein-specific scoring function to a larger database, and the results also show significant improvement. Our method is not limited to improving the DOCK scoring function. It can be adopted to improve other programs such as GOLD and Glide. We believe that this method can be applied to virtual screening experiments and elevates the hits rate significantly, which can be beneficial to the modern drug discovery process.
1. Introduction
A complementary method to HTS is structure-based virtual screening (Mestres, 2002), which relies on the key-and-lock theory that each protein structure is like a lock and we just need to find a key (ligand) to fit the lock. With the advance of computational techniques, this process can now be done on the computer (Dolghih et al., 2011; Prakhov et al., 2010; Sakakibara et al., 2012; Sircar and Gray, 2010; Whisenant et al., 2010), and many successful cases have been reported (Kuo et al., 2008; Lu et al., 2006a; Lu et al., 2006b). The central technique in structure-based virtual screening is docking, which refers to use computer programs to find ligands based on the target protein structure. A docking program generally consists of two parts: an algorithm to predict how a ligand binds to a protein (the position and orientation) (Dias and de Azevedo Jr, 2008), and scoring functions to retrieve the correct binding poses of interested ligands as well as distinguish binders from nonbinders (Jain, 2006).
DOCK is a popular docking program developed by Kuntz group in UCSF and can be obtained freely for academic institutes. The scoring function incorporated in DOCK was used as the model system in our study. In the DOCK version 3.5.54 scoring function (Meng et al., 1992), a compound is usually associated with four energy terms (Eele, Evdw, Epol, Eapol), where Eele, Evdw, Epol, and Eapol denote the electrostatic interaction energy, the van der Waals interaction energy, the polar component of the ligand desolvation energy, and the apolar part of the cost of ligand desolvation energy, respectively. Assume that we have a set of compounds that, from experiments, is shown to be ligands. The aim of this study is to find a model, based on the four energy terms of the known ligands, that selects potential active compounds from a very large compound library. A typical simple scoring function, with equal weight score, calculates the total docking energy Etotal, which is defined as
The selection criterion involves selecting compounds with smaller Etotal values as potential ligands (Meng et al., 1992). Other scoring functions based on the physical or biological characteristics are adopted in DOCK 6.
In addition, many scoring functions have been developed (Jain, 2006) and comprehensively evaluated (Cheng et al., 2009). The results showed that no single scoring function outperformed others for all proteins, which means that a suitable scoring function may depend on the characteristics of the protein. That is, different protein may associate with different scoring functions. Instead of adopting the existing scoring functions, which may be derived based on biological background, we intend to provide a protein-specific scoring function from a statistical viewpoint. By modifying the original scoring function, the protein-specific scoring function would be a fast, simple, and efficient rescoring method.
To evaluate the performance of a scoring function, it is common to create noise compounds to examine if the scoring function can select the correct ligands in a set including ligands and noise data. Noise data is called a decoy. Directory of useful decoys (DUD) (Huang et al., 2006) docked dataset was chosen to validate our method, which included 40 proteins and their corresponding active ligands, as well as potential inactive molecules (decoys). A decoy for a ligand is created with similar energy terms as the ligand itself.
Therefore, with a tolerance interval approach and regression analysis, we propose a procedure to select better weights on energy terms in scoring functions for each specific target protein. Regression analysis is widely used for modeling several variables based on training data and can provide a useful tool for predicting and forecasting (Chekmarev et al., 2009), and as such, it should be suitable to apply on the scoring function modification. We adopt a linear regression analysis associated with an outlier detection approach in analyzing the ligand and decoy datasets to provide an efficient scoring function in a post-filter process. The improved scoring functions were evaluated in terms of the enrichment factor using small and large databases respectively.
2. Materials and Methods
2.1. The DUD dataset
The DUD datasets were built for evaluating docking programs (Huang et al., 2006) (see Supplementary Material, available online at www.liebertonline.com/cmb). There are 40 target proteins and 2,950 active ligands in the DUD datasets. To avoid bias, for each ligand, 36 decoys were created, which are physically similar to the ligand in molecular weight, cLogP, and number of hydrogen bonding groups, but topologically different.
The docking procedure was performed on the 40 protein targets, with all ligands and decoys using DOCK program (Meng et al., 1992). The crystallographic ligand against its target protein was used as the controlled calculation, which means the docking procedure is validated. Therefore, DUD dataset should be a suitable data source for our post-filter method development.
2.2. Enrichment factor
The purpose of virtual screening is to discover active compounds from a large library. Our study focuses on re-ranking the active compounds to the top ranking position. Therefore, the enrichment factor (Cavasotto and Abagyan, 2004) should be a good indicator for evaluating the performance of the methods used in this study. The enrichment factor of a method for a selected subset is defined as the ratio of the percentage of active compounds in the selected subset to the percentage of active compounds in the entire database. The enrichment factor (EF) of a method is defined as:
where ligandselect is defined as the number of active compounds in a subset selected by this method, Nselect is defined as the number of compounds in this subset, ligandtotal is defined as the number of total active compounds in the entire library, and Ntotal is defined as the compound number of the entire library. A scoring function leading to a large EF value is more successful at selecting valid active compounds. A scoring function, with an EF value greater than one, means that this scoring function method is better than a randomly selected method. In this study, we select the top 1% and 20% subsets of the entire database to evaluate EF values of the scoring functions, that is
2.3. The protein-specific scoring method
In this study, we develop a method to derive a protein-specific weight β ele , β vdw , β pol , and β apol on the energy terms Eele, Evdw, Epol, and Eapol to obtain a new scoring function instead of using the equal weights on Eele, Evdw, Epol and Eapol.
A protein-specific scoring function has the form
where the values of β ele , β vdw , β pol , and β apol depends on protein.
In the equal weight scoring function method, a compound with lower Etotal score is regarded as having more potential to be an active compound than the compound with higher Etotal score. In this study, a regression model approach is adopted to derive the weights β ele , β vdw , β pol , and β apol . For Eele, Evdw, Epol, and Eapol in the protein-specific scoring function such that the enrichment factor for the protein-specific scoring function can be higher than that for the equal weight scoring function.
The proposed method can be performed in two steps: (1) outlier detection and (2) regression analysis. From our study, both steps are necessary to obtain better weights for the four energy terms. For a protein, suppose we have a ligand dataset from experiments and a decoys dataset. It may be due to incorrect placement in the docking process that is causing measurement errors for the energy terms Eele, Evdw, Epol, and Eapol data. Thus, the first step is to evaluate if there are measurement errors of the four energy terms for the ligand data. Since the number of the decoys in the data is much larger than that of the ligand data and the decoys are created to have similar energy terms as the ligands, we use the decoy data with low score as a standard to detect the outliers for the ligands data. It is possible to use both decoy and ligand data sets to detect the outliers.
2.4. The first step: detection of outliers for ligand data
First, for a protein, we rank the decoys from the lowest to the highest score based on the equal weight scoring function Etotal. The top r decoys were then used as a standard to detect the outliers, where r can be selected as the same number of ligands in the ligand dataset or 0.01 proportion of the total decoy number of the decoy dataset.
Let
In this study, since a compound with smaller energy value is preferable, we adopt an upper tolerance bound instead of using a two-sided tolerance interval to detect outliers here. The factor c can be selected to be 1.64 corresponding to an upper (0.95 − content, 0.95 confidence) bound when the sample size is large. The factor value c depends on the sample size and can be obtained from literature (Hahn and Meeker, 1991). Note that in this step, we emphasize using the decoy data to detect outliers instead of using only ligand data. We have compared the outlier detection results using the decoy data with the result using the ligand data. It is shown that using only the ligand data cannot lead to a satisfactory result, which may be due to the small size of the ligand dataset.
2.5. The second step: regression analysis
According to the new ligand set that the outliers removed, a linear regression model is applied to fit the new dataset. First, we consider the regression model:
with Y = a or b corresponding to a ligand or a decoy, respectively, where e is an error term, which is assumed to follow a normal distribution.
It is worth noting that the efficiency of the regression model depends on the selection of a and b. To distinguish the ligand and decoy data, we can set a and b such that |a − b| is large. In this study, we set a = 1 and b = 30. In this model, we use all ligand data in the new set in which the outliers have been removed to fit the regression model. But we do not use all decoy data because it would cause the instability of the regression model. Only a few top decoys with low Etotal score are selected to fit the model.
We intend to propose a model to well distinguish ligands from decoys with low Etotal score. We rewrite (1) as
where
To derive β
ele
, β
vdw
, β
pol
, and β
apol
, we adopted the BLUE (best linear unbiased estimator) estimators
Then the values
In this study, we set a to be smaller than b such that the criterion of discovering a potential ligand is to select compounds with lower
For a protein, we can adopt training data in Procedure 1 to obtain appropriate values for c and ndecoy, and then use these values to predict active compounds.
3. Results and Discussion
3.1. The overall enrichment
In this section, we use DUD docked dataset as our data source and apply the proposed procedure to obtain a protein-specific scoring function in virtual screening. There are forty proteins in DUD datasets. The proteins were grouped into six types by their function: nuclear hormone receptors, kinase, serine protease, metalloenzymes, folate enzymes and other enzymes. Each protein target has its own experimental confirmed ligands. For each ligand, 36 decoys were created. All ligands and decoys were docked to each protein, resulting in a very huge database. The number of ligands and decoys for each protein are listed in Table 1.
Own decoys indicated the enrichment factor was calculated based on the decoys against corresponding protein.
All decoys indicated the enrichment factor was calculated based on all the decoys in the DUD dataset.
EF1 indicated the enrichment factor was calculated for the top 1% of the database.
EF20 indicated the enrichment factor was calculated for the top 20% of the database.
EF, enrichment factor.
To compare the performance of the equal weight scoring function method and the protein-specific scoring function method, we first evaluate these two methods on the top 1% subset of the ranked database, which was ranked by each scoring function. We compare the enrichment factors of the equal weight scoring method and our protein-specific scoring method for the top 1% subset of each protein. The averages of the enrichment factors for 40 proteins using the equal weight scoring method and protein-specific weight scoring method were 7.86 and 16.49, respectively. There were 37 out of the 40 systems that the protein-specific scoring function leads to a larger enrichment factor than the equal weight scoring function. There were two (TK and AChe) out of the 40 systems with the same enrichment factor using the two methods. And only one system (NA) failed to be better enriched using the protein-specific weight scoring function. In addition, we also evaluate these two methods on the top 20% of subsets of the ranked database.
The averages of the enrichment factors for the top 20% subset using the equal weight scoring method and the protein-specific weight scoring method were 3.64 and 3.78, respectively. Although the difference of the average enrichment factor for the top 20% subset between the two scoring methods was not as significant as the case for the top 1% decoys subset, there were 31 out of the 40 systems that had greater enrichment factors using the protein-specific scoring method than that using equal weight scoring method. These results indicated that our method can significantly improve the equal weight scoring function. In general, virtual screening focuses on enriching the true hits of the top-ranked compounds of the database. Therefore, our method should be a potential tool for improving the validity of virtual screening.
The decoy data used in the above results for a specified protein is the corresponding decoy created for this protein. Since the enrichment factor of the 40 protein targets were improved, we further applied the protein-specific scoring function to all decoys and evaluated its performance. The total decoy number is 105,463 (Table 1). Results showed that both enrichment factors using the protein-specific scoring method for the top 1% and 20% subset were improved. The average of enrichment factors for the top 1% subset using the equal weight score and the protein-specific score were 14.36 and 20.28, respectively, and for the top 20% subset were 2.60 and 2.80, respectively. These results indicated we can use a smaller database to derive our protein-specific scoring function and then apply this scoring function to a larger database.
Moreover, the overall profile of percentage of ligands found (y-axis) is plotted as a function of the percentage of the ranked docked database (x-axis) for each system (Figs. 1–3). The two different enrichment factors use two different background databases. The “total database” contains 3,178 DUD ligands and 105,463 decoys (cyan line and yellow line for the equal weight score and protein-specific score respectively), while the “own decoys” only includes the native ligands and their corresponding decoys (pink line and blue line for the equal weight score and protein-specific score respectively). The result shows that most of the percentage of true ligands found by the protein-specific score were greater than that from the equal weight score both in total database and own decoys. For the own decoys (the blue line and pink line), the protein-specific scoring method outperforms in several systems, such as ERagonist, ERantagonist, FgFr1, PDGFrb, etc. For the total database, the improvement was even more significant (the yellow and cyan line), such as the ERagonist, PR, DHFR, GART, etc. These results suggest that our method can sucessfully distinguish ligands from nonligands whether in small or large databases.
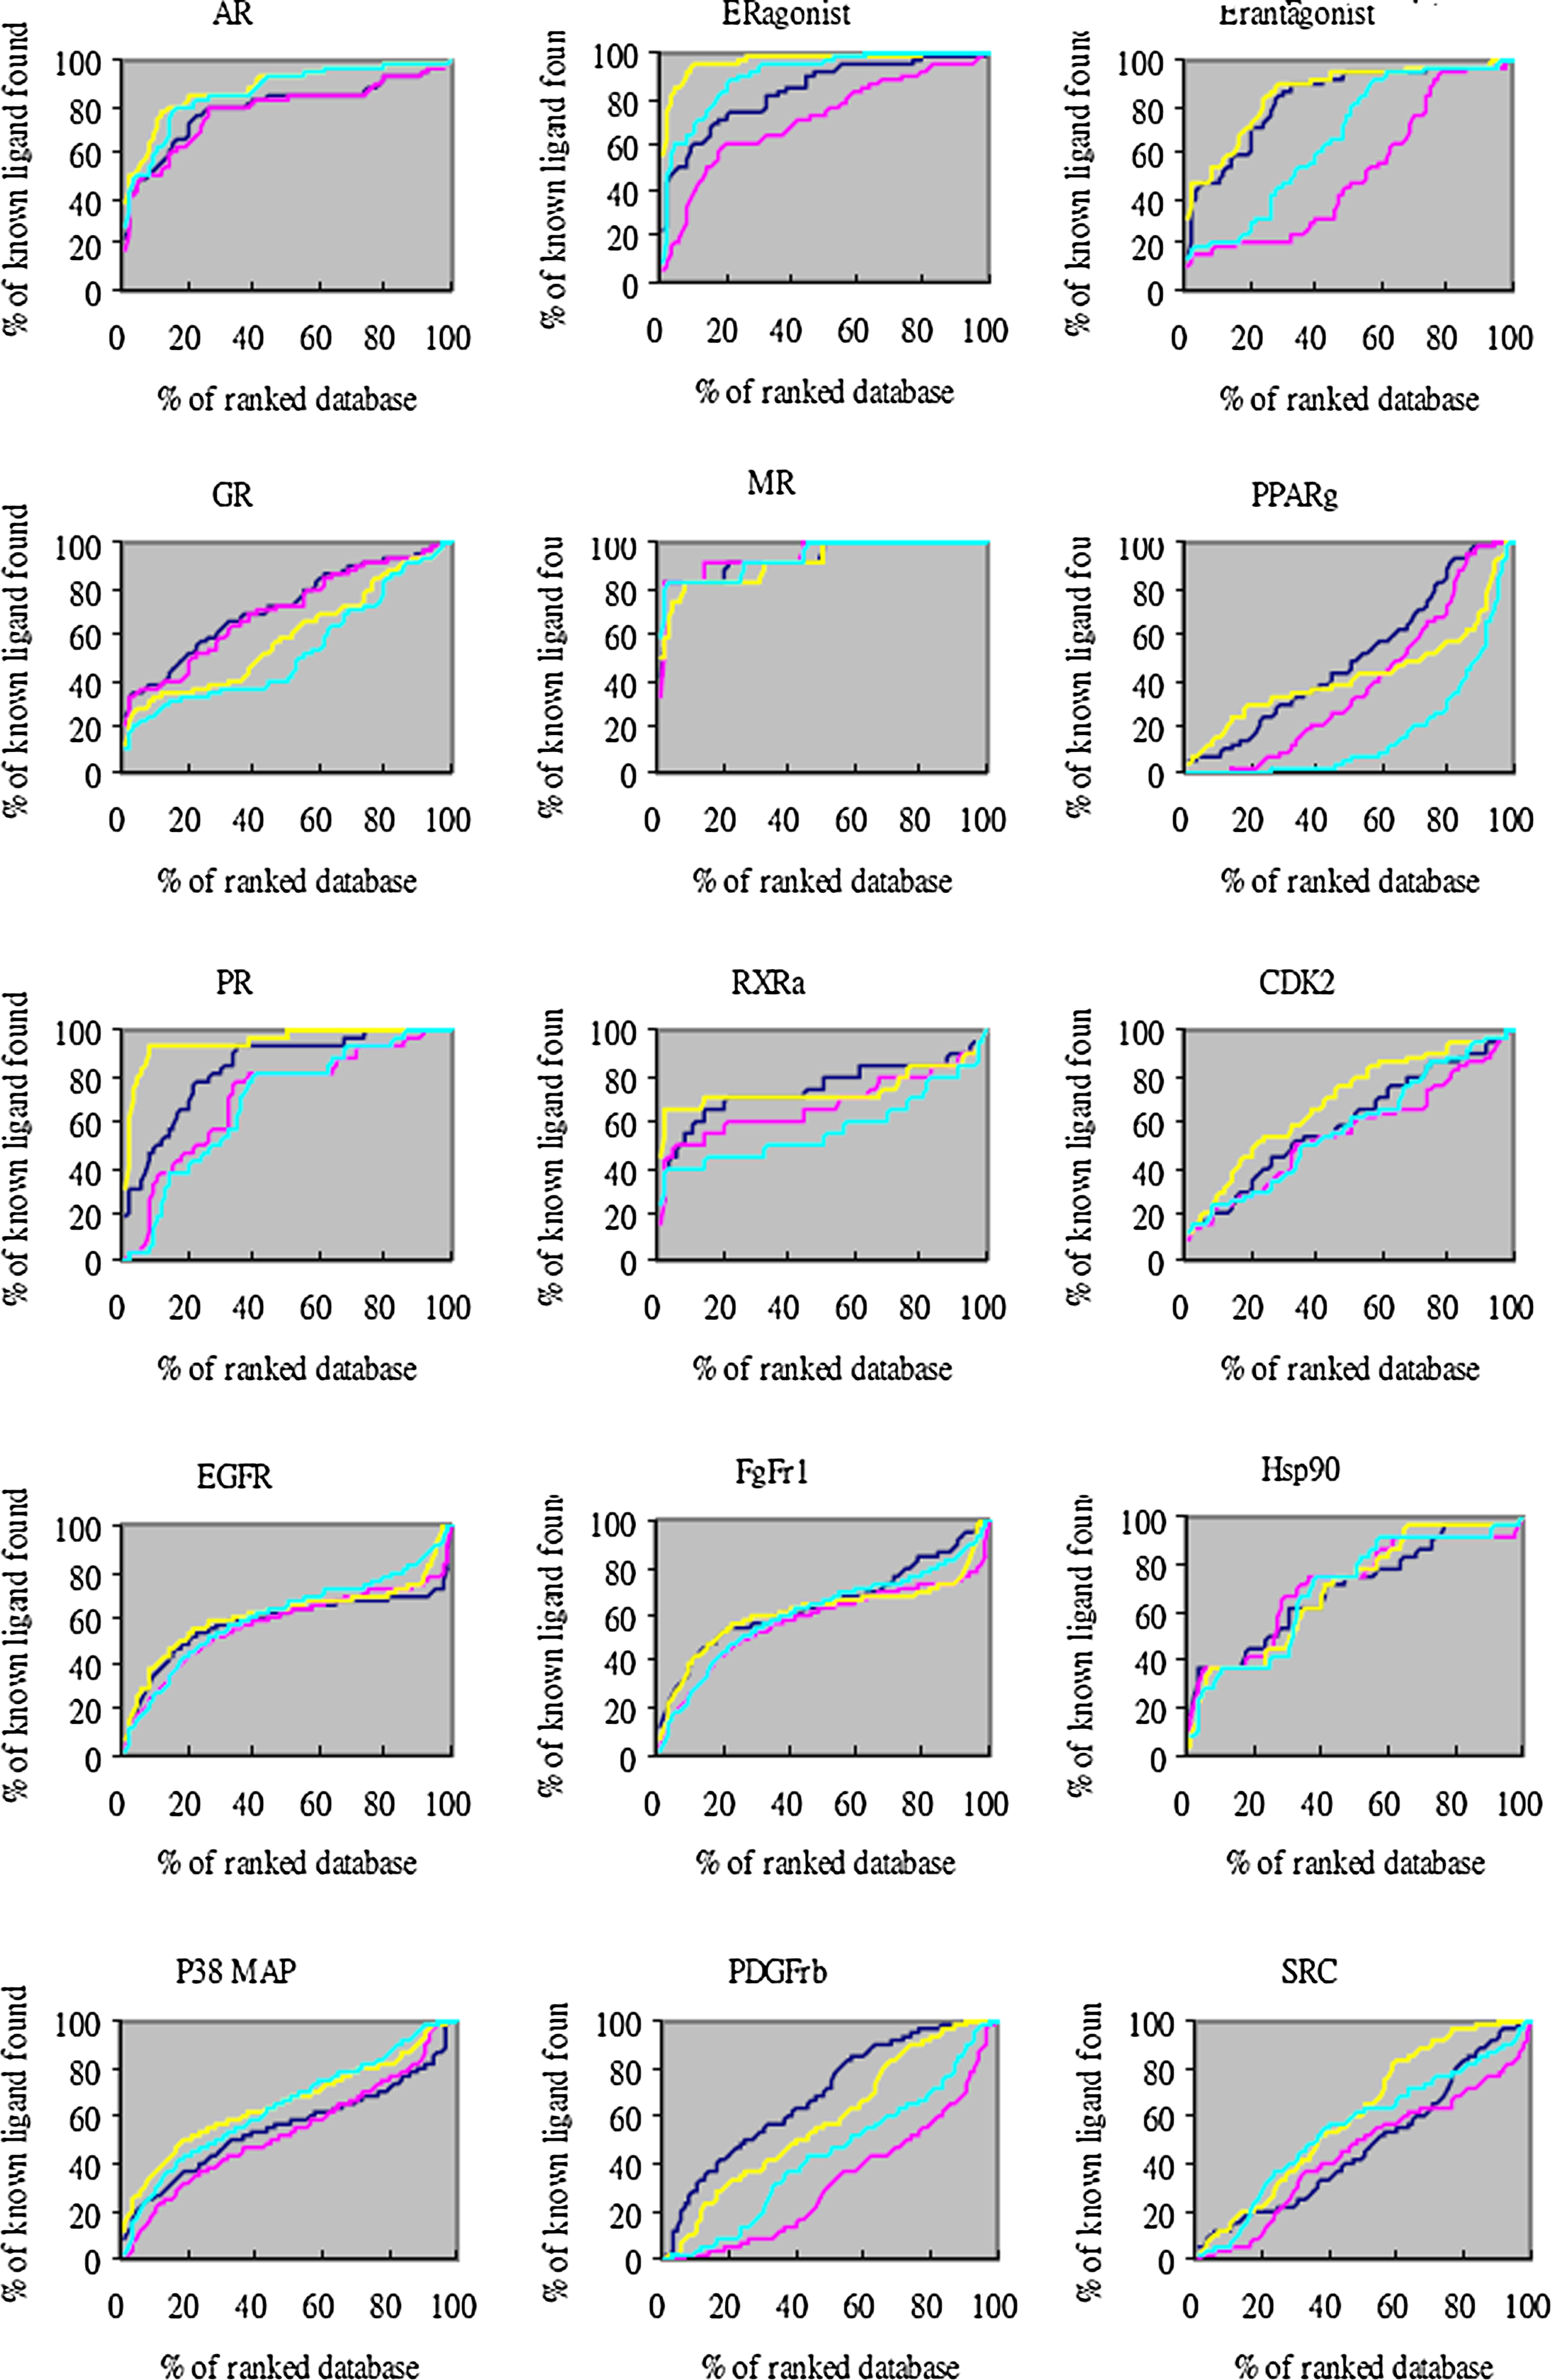
Docking enrichment plots for some 40 protein targets with equal weight scoring and protein-specific scoring using DUD dataset. The docking ranked database (x-axis) was plotted against the percentage of known ligands found by calculation (y-axis) at any given percentage of ranked database. The “total database” contained 3,178 DUD ligands and 105,463 decoys (cyan line and yellow line for equal weight scoring and modified scoring respectively), while the “own decoys” only include native ligands and their corresponding decoys (pink line and blue line for equal weight scoring and protein-specific scoring respectively).
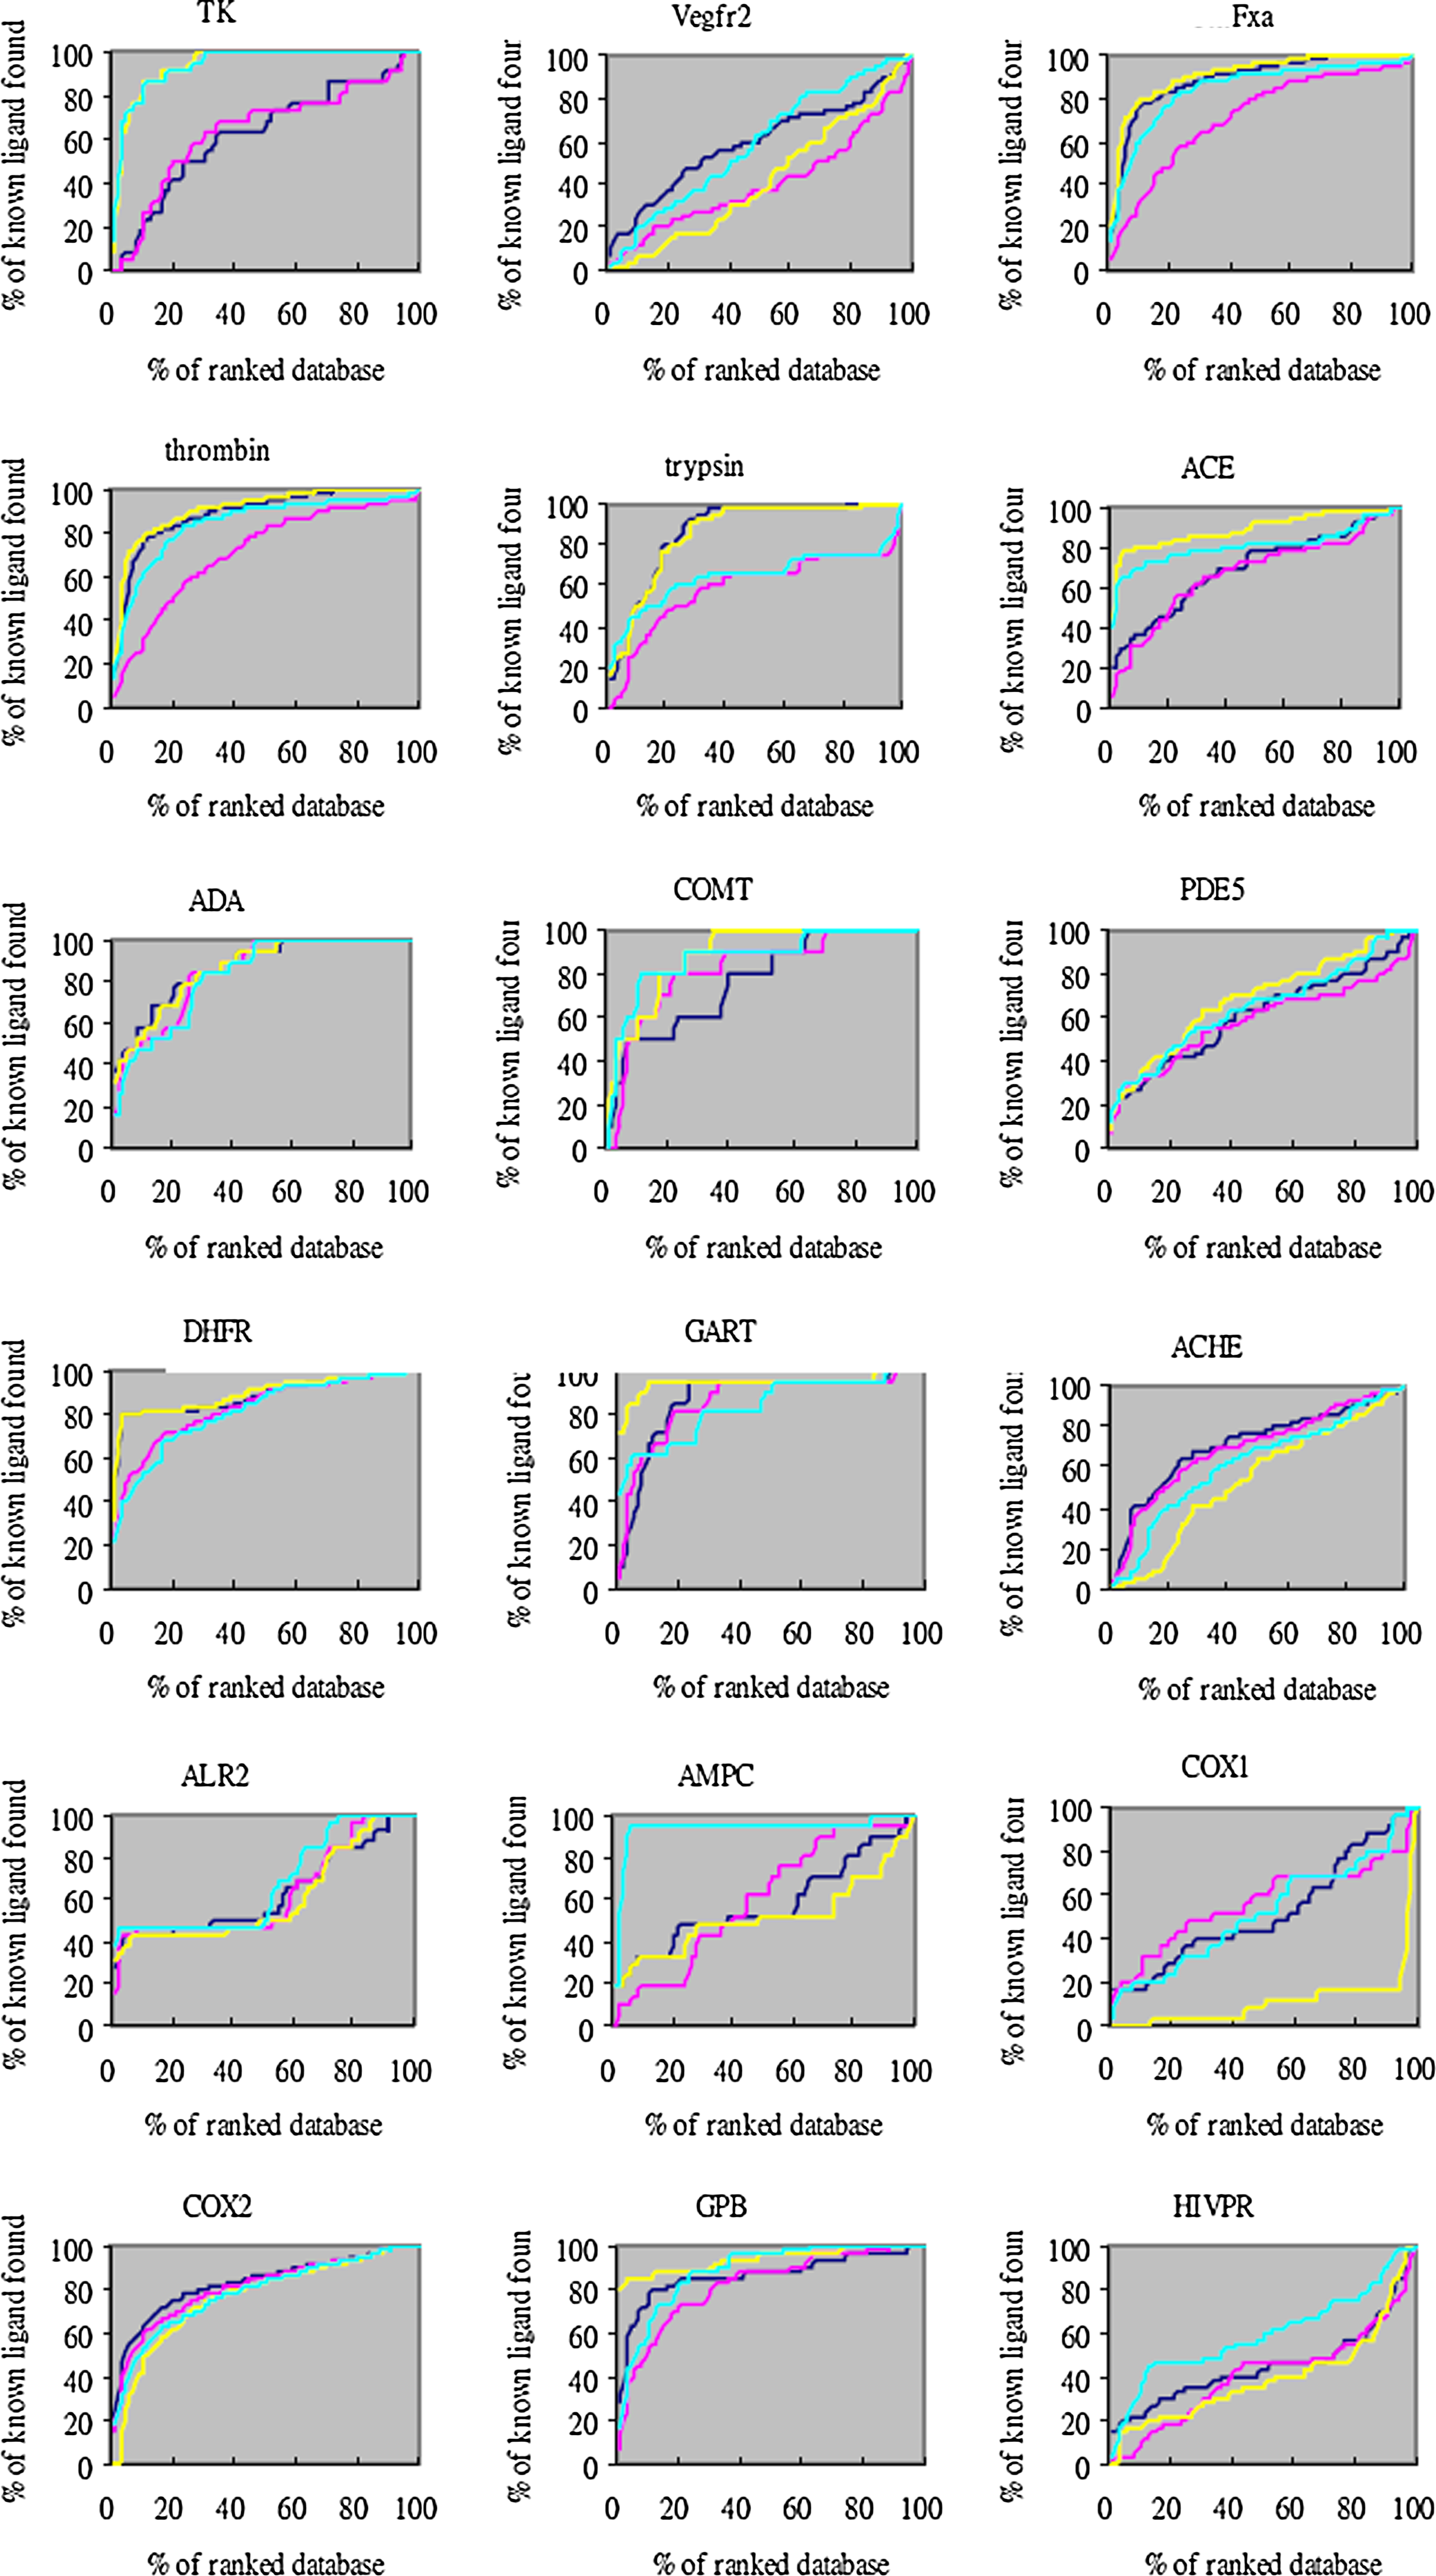
Docking enrichment plots for some 40 protein targets with equal weight scoring and protein-specific scoring using DUD dataset. The docking ranked database (x-axis) was plotted against the percentage of known ligands found by calculation (y-axis) at any given percentage of ranked database. The “total database” contained 3,178 DUD ligands and 105,463 decoys (cyan line and yellow line for equal weight scoring and modified scoring respectively), while the “own decoys” only include the native ligands and their corresponding decoys (pink line and blue line for equal weight scoring and protein-specific scoring respectively).

Docking enrichment plots for some 40 protein targets with equal weight scoring and protein-specific scoring using DUD dataset. The docking ranked database (x-axis) was plotted against the percentage of known ligands found by calculation (y-axis) at any given percentage of ranked database. The “total database” contained 3,178 DUD ligands and 105,463 decoys (cyan line and yellow line for equal weight scoring and modified scoring respectively), while the “own decoys” only include the native ligands and their corresponding decoys (pink line and blue line for equal weight scoring and protein-specific scoring respectively).
3.2. Comparison to other rescoring methods
Because detailed calculation of binding free energy between protein and ligands is time consuming and is not suitable for large-scale compound screening, approximation of binding affinity between proteins and ligands was adopted by most scoring functions to save time. However, this approximation procedure usually results in the inaccuracy of scoring function. To avoid the bias of single scoring function, Charifson et al. (1999) developed the consensus scoring method. They combined two different docking methods as well as 13 different scoring functions and applied their method on three targets of high pharmaceutical interest. Their results showed that the hit rates of the three targets were significantly improved.
However, other researchers demonstrated that the success of the consensus scoring method highly depends on the method of scoring function combination and the number as well as the nature of individual scoring functions involved in the combination (Wang and Wang, 2001). Muthans et al. (2008) applied pharmacophore constraints that derived from X-ray complex structures to post-filter the docking results. They used three docking programs and a database containing 9,997 compounds to evaluate six target proteins. Results showed that post-filtering with a pharmacophore indeed improves the docking performance over the six proteins.
Kortagere et al. (2009) applied one-dimensional Shape Signature descriptors as a weighting factor to the Gold Score and obtained a docking prediction accuracy of 61% on the human pregnane X receptor (PXR). Several programs have also incorporated the post-processing function to automate the post-filter process. Most of the post-filter methods were developed using the interaction pattern, and large-scale validation of these methods are unavailable. Moreover, some methods are bound to specific programs, resulting in difficulties for popular usage.
We focused on improving the DOCK scoring function in this study. DOCK is software that can be used by academic researchers freely. We applied our model to all the 40 target proteins in DUD docked set and the result is promising. The code for implementing the proposed method is available online (see Supplementary Material, available at www.liebertonline.com/cmb).
4. Conclusion
In this study, we adopt a method based on tolerance interval and regression analysis approaches to develop a procedure for obtaining a protein-specific weight for the energy terms to increase the enrichment factor. Basically, we believe that the conventional equal weight scoring approach established from a scientific basis has its own merits. However, due to different features of proteins, this scoring function is not rigorous enough for protein target predictions.
We have modified the scoring functions so that they can be based on the characteristic of the proteins to predict active compounds. Our results show that this protein-specific scoring method could successfully improve the equal weight scoring function for the 40 DUD datasets. It can also be expanded to larger databases. Furthermore, this method is not limited to the DOCK scoring function. It can be applied to modifying other scoring functions, such as GOLD score and Glide score. We believe that this method can elevate the hits rate significantly, which can be beneficial to the modern drug discovery process.
Footnotes
Acknowledgments
This work was partially supported by the National Science Council (NSC) and National Center for Theoretical Sciences (NCTS) in Taiwan.
Disclosure Statement
No competing financial interests exist.
References
Supplementary Material
Please find the following supplemental material available below.
For Open Access articles published under a Creative Commons License, all supplemental material carries the same license as the article it is associated with.
For non-Open Access articles published, all supplemental material carries a non-exclusive license, and permission requests for re-use of supplemental material or any part of supplemental material shall be sent directly to the copyright owner as specified in the copyright notice associated with the article.