
Abstract
Abstract
Phylogenetic tree construction process might produce many candidate trees as the “best estimates.” As the number of constructed phylogenetic trees grows, the need to efficiently compare their topological or physical structures arises. One of the tree comparison's software tools, the Mesquite's Tree Set Viz module, allows the rapid and efficient visualization of the tree comparison distances using multidimensional scaling (MDS). Tree-distance measures, such as Robinson-Foulds (RF), for the topological distance among different trees have been implemented in Tree Set Viz. New and sophisticated measures such as Maximum Agreement Subtree (MAST) can be continuously built upon Tree Set Viz. MAST can detect the common substructures among trees and provide more precise information on the similarity of the trees, but it is NP-hard and difficult to implement. In this article, we present a practical tree-distance metric: MASTtreedist, a MAST-based comparison metric in Mesquite's Tree Set Viz module. In this metric, the efficient optimizations for the maximum weight clique problem are applied. The results suggest that the proposed method can efficiently compute the MAST distances among trees, and such tree topological differences can be translated as a scatter of points in two-dimensional (2D) space. We also provide statistical evaluation of provided measures with respect to RF-using experimental data sets. This new comparison module provides a new tree–tree pairwise comparison metric based on the differences of the number of MAST leaves among constructed phylogenetic trees. Such a new phylogenetic tree comparison metric improves the visualization of taxa differences by discriminating small divergences of subtree structures for phylogenetic tree reconstruction.
Introduction
The Robinson-Foulds (RF) distance metric had been implemented in the Tree Set Viz module by summing the number of internal edges (branches) that must be collapsed or removed from one tree to another (Robinson and Foulds, 1981). Although RF computed the number of edges in disagreement, one may wish to conduct tree-to-tree comparisons based on the number of leaves causing the disagreement by detecting the subtle differences reflecting their least common ancestors or their maximum similarity of subtrees. These two methods differ conceptually and may differ greatly in practice. However, Maximum Agreement SubTree (MAST) is NP-hard and computationally sophisticated. In this research, we have provided a computationally proficient MAST tree–tree comparison metric solution for tree comparisons in Tree Set Viz module.
Implementation
MAST can be used either in rooted or unrooted trees (Farach et al., 1995; Bryant 1997; Patric and Ostergard, 2001). It has been implemented in PAUP (Swofford, 2012), a computational phylogenetics program. The MAST method focuses on extracting the common structure in multiple trees (Finden and Goron, 1985), whereas the Robinson-Foulds method determines how different the given trees are according to the internal edges' dissimilarity (Robinson and Foulds, 1981), therefore having a computational advantage for certain cases of phylogenetic tree reconstruction (Bryant, 1997).
The proposed MASTtreedist can compare with two trees, T1 and T2, as an agreement subtree with the largest possible number of leaves, which is given by MAST (T1, T2) that equals the number of leaves in common for the maximum subtree in T1 and T2 (Bryant, 1997). The MASTtreedist tree-to-tree pairwise distance metric was implemented in the Tree Set Viz module version 2.1 (Hillis et al., 2005) in the Mesquite software package (version 1.01) (Maddison and Maddison, 2012). To implement the MASTtreedist module, a parallel folder named “MAST” was built, along with “Robinson-Foulds,” containing the class files for the MASTtreedist module. The “MAST” class inherited the “NumberFor2Trees” class from the Mesquite library. The MAST class used the “NumberFor2Trees” class method: “calculateNumber” to compute the MAST number of leaves for two trees. At the end, MASTtreedist metric returns the value of the number of pruning leaves (total taxa minus the MAST leaves for two trees) to represent the tree “distance” (indicating similarity of trees), and such distances were visualized under multidimensional scaling. However, MASTtreedist implementation can be runtime slow since it is NP-hard.
In this application, several techniques were used to optimize the program. MASTtreedist has many set operations implemented with a Boolean array. The program also takes advantage of symmetries for rooted triples and fan triples (see their definitions in Bryant, 1997, p. 180). A Java build-in class “Hashtable” was used to save all possible repeats of the calculation, including the least common ancestor (Bryant, 1997, p. 175). Dynamic programming technique was also applied to traverse each pair of tree leaves, determine if the pair had been computed, and memorize the result for every pair of leaves in a 2D array.
The maximum weight clique calculation is NP-hard and the most time-consuming step. In particular, the algorithm conducts combinatorial backward searching from the end of the array containing all the possible subgraphs. If the nodes in the maximum weight clique were stored in the front of the array, then the algorithm has to take more time to enumerate almost all possible combinations that can be found in the weighted graph. If the nodes in the maximum weight clique can be put toward the end of the array, the search can end sooner without considering all possible node combinations.
A key value (integer) was assigned to each node so that the nodes can be rearranged from low to high in accordance with the correspondent key value. The key value is related to the weight of the current node and the degree or weight of adjacent nodes. It can be defined as the following:
where k represents the current node, adj(k) is the set of adjacent nodes of the current node k, and d(i) and w(i) are the degree and weight of node i respectively. In this equation, the runtime complexity is O(n × d), where n is the number of leaves and d is the maximum degree of the tree. It is much faster compared to the runtime of maximum weight clique. It also does not affect the overall time complexity, and can then improve the computing speed for maximum weight clique.
The runtime complexity of the MASTtreedist metric is O(k × n3 + nd), where k is the total trees for comparison, d is the maximum degree of the internal nodes, and n is the number of total leaves of taxon.
Results
Two datasets, Camp (Cosner et al., 2000; Moret et al., 2001; Stockham et al., 2002) and PEVCCA (Van de Peer et al., 2000; Stockham et al., 2002), were obtained to test the MAST performance and compare the results with the ones from RF. The Camp dataset is for the phylogenetic trees breakpoint reconstruction for the Campanulaceae family (Moret et al., 2001), which contains 216 trees on 13 leaves. The PEVCCA datasets in this research contain 168 trees on 129 leaves, obtained by maximum parsimony searches of the small subunit ribosomal RNA sequences (Van de Peer et al., 2000; Stockham et al., 2002).
The MASTtreedist tree comparison metric can be deployed along with other metrics (e.g., Robinson-Foulds) in the Tree Set Viz module within Mesquite. The Tree Set Viz module used multidimensional scaling to represent the relationships between topologies. In this case, the topologies as a scatter of points in 2D space. The software arranges the points such that they group according to the distance between the trees (distance between trees was calculated using MAST or RF). The tree distances were indicated by their similar levels (similar trees are close to each other). The default step size, which suggested the speed of positional change for each tree during the MDS process in Tree Set Viz, was used in all analyses. The MDS was allowed to proceed until the stress function stopped changing. To avoid being trapped in local optima, this procedure conducted multiple restarts to make sure that similar results were being achieved. We collected the tree–tree distance output generated by MAST and RF methods for further analysis.
For Camps dataset, MAST and RF arranged the trees differently based on their distances. Results from RF show three clusters of trees, while the display generated by MAST categorizes the trees into eight groups (Fig. 1) based on different numbers of similar leaves. Thus, the MAST metric can detect detailed topological differences (identify trees based on their similar maximum subtrees). Figure 2 shows that the histogram of RF only had four unique tree–tree distance values, but MAST had five, leading to the conclusion that MAST is more discriminative than RF in this dataset. MAST is also more reminiscent of the normal distribution than RF in this dataset (Fig. 2).
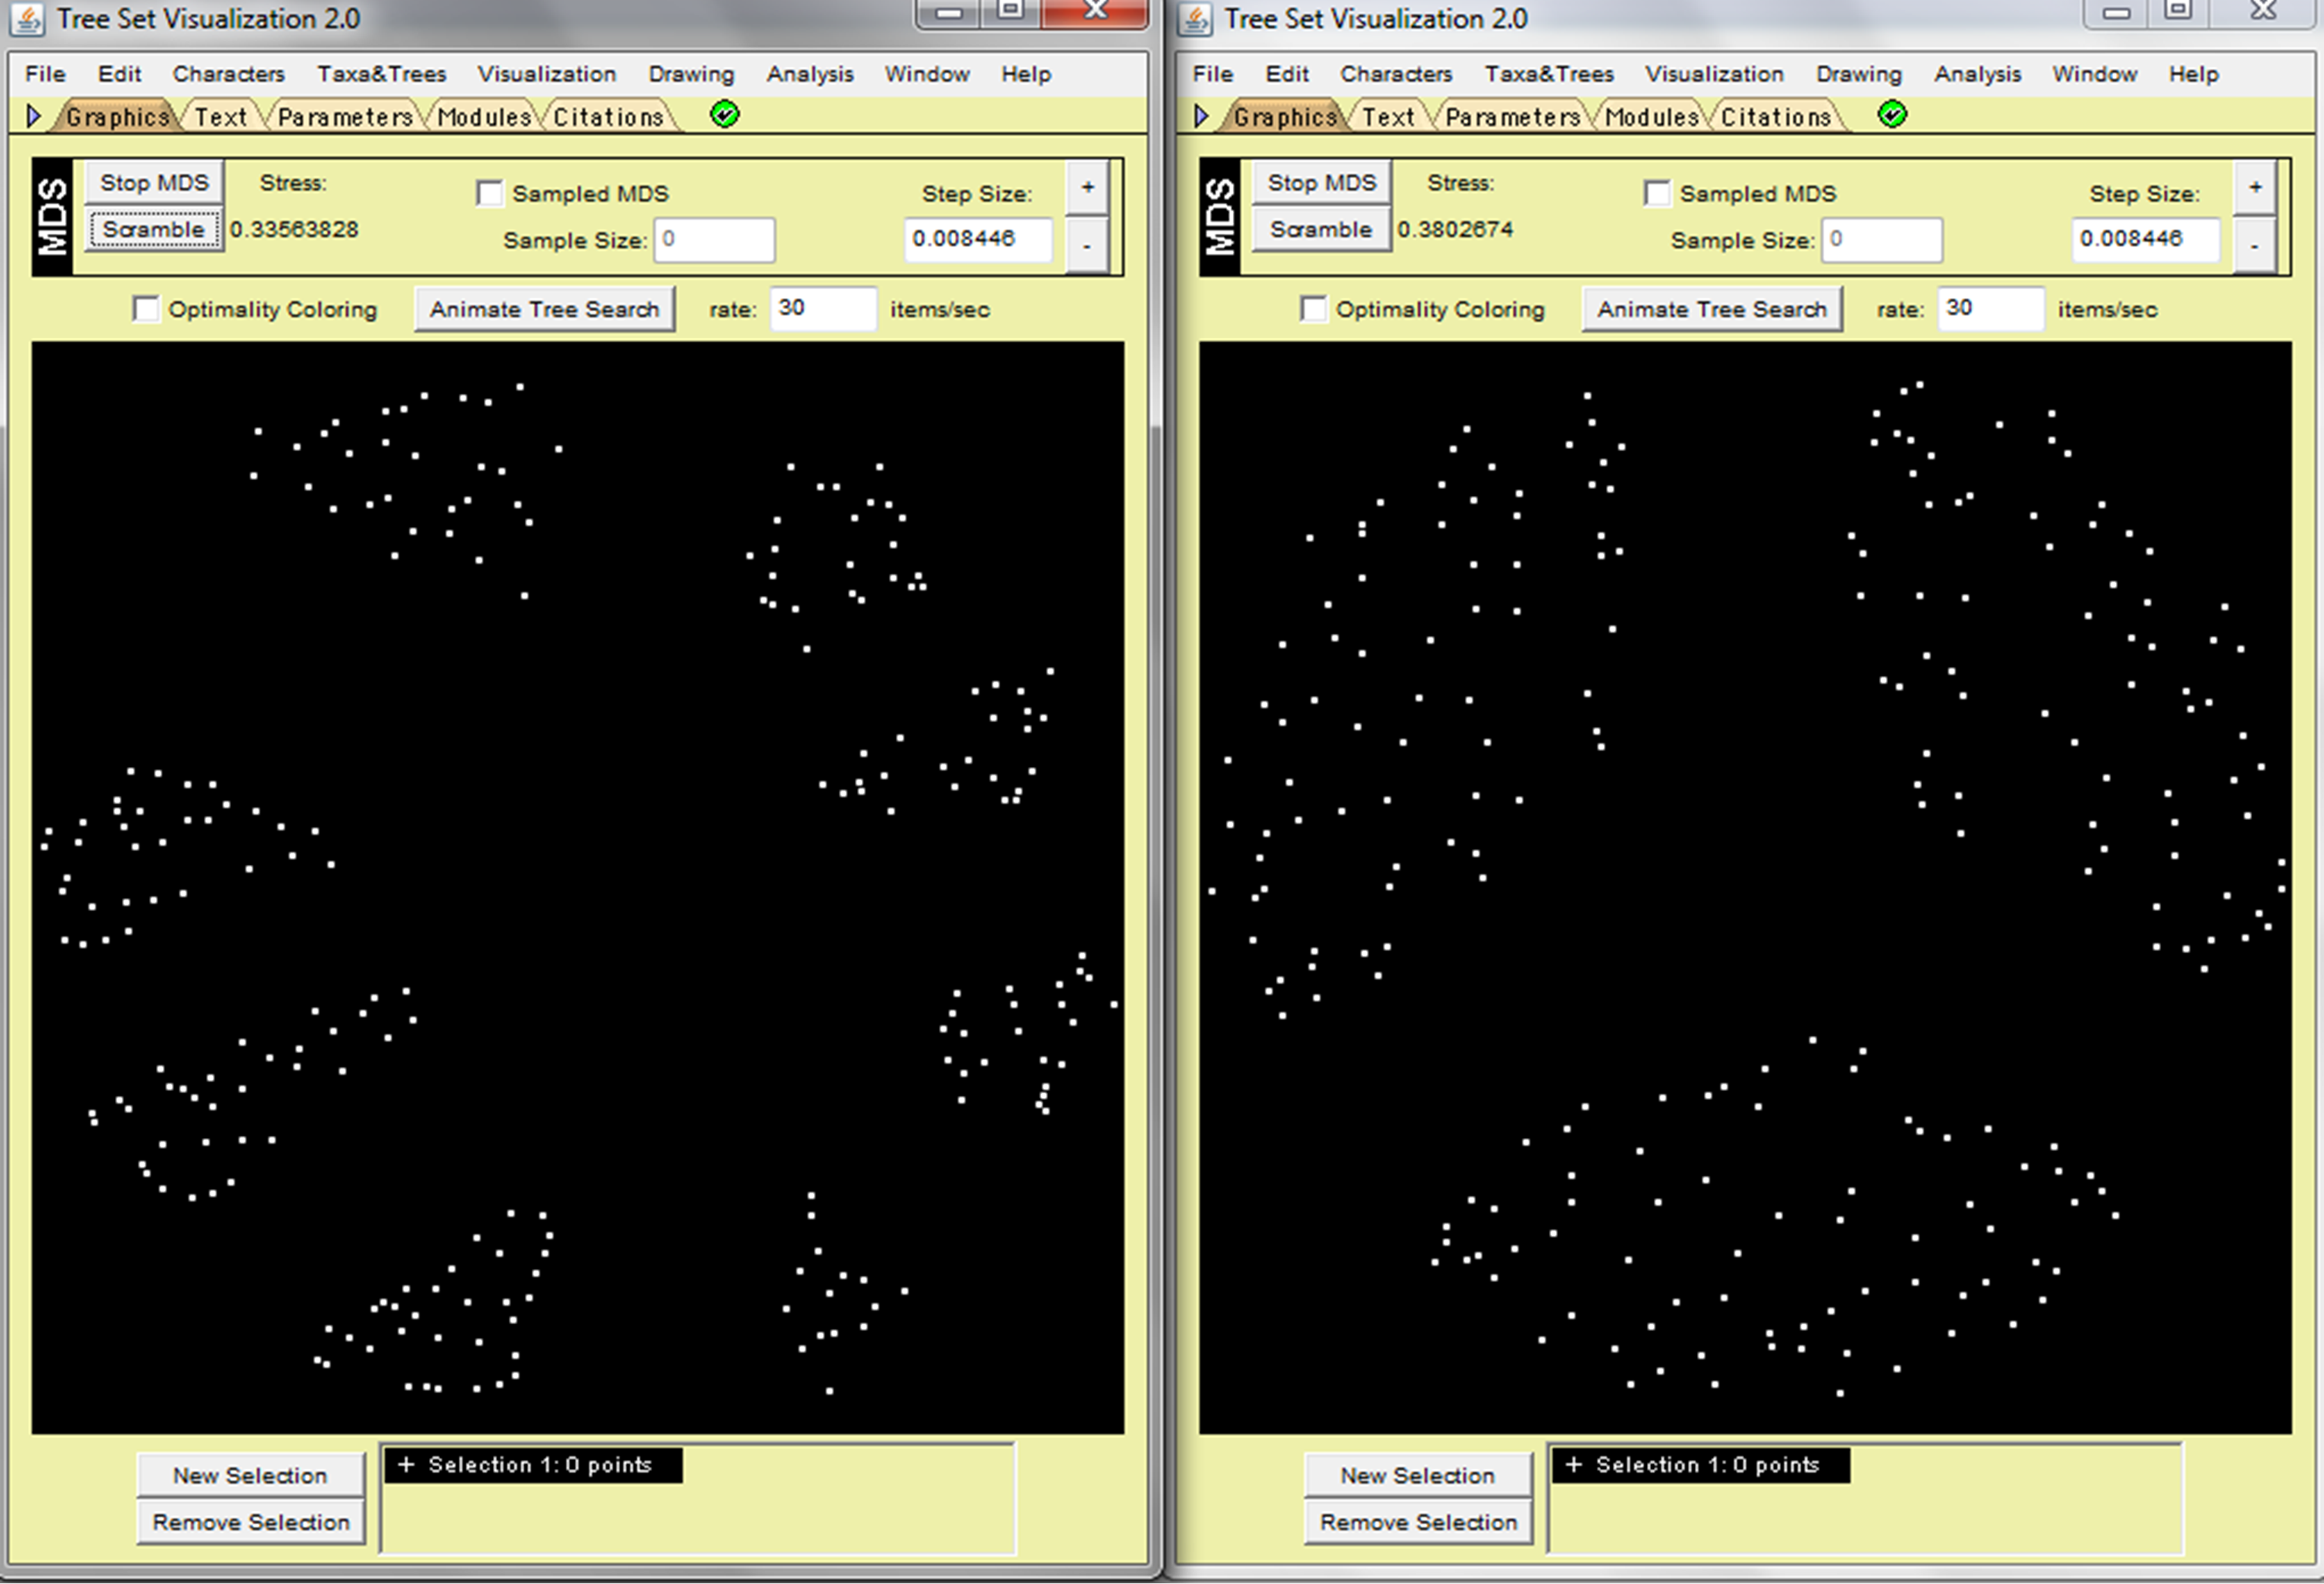
The phylogenetic trees distances (computed by MASTtreedist) were displayed as white dots in the 2D spaces using the Camps dataset. MASTtreedist (left) metric showed more discriminative (identify more clusters) than Robinson-Foulds (right). Input data (“Camp.nex”) can be found online.
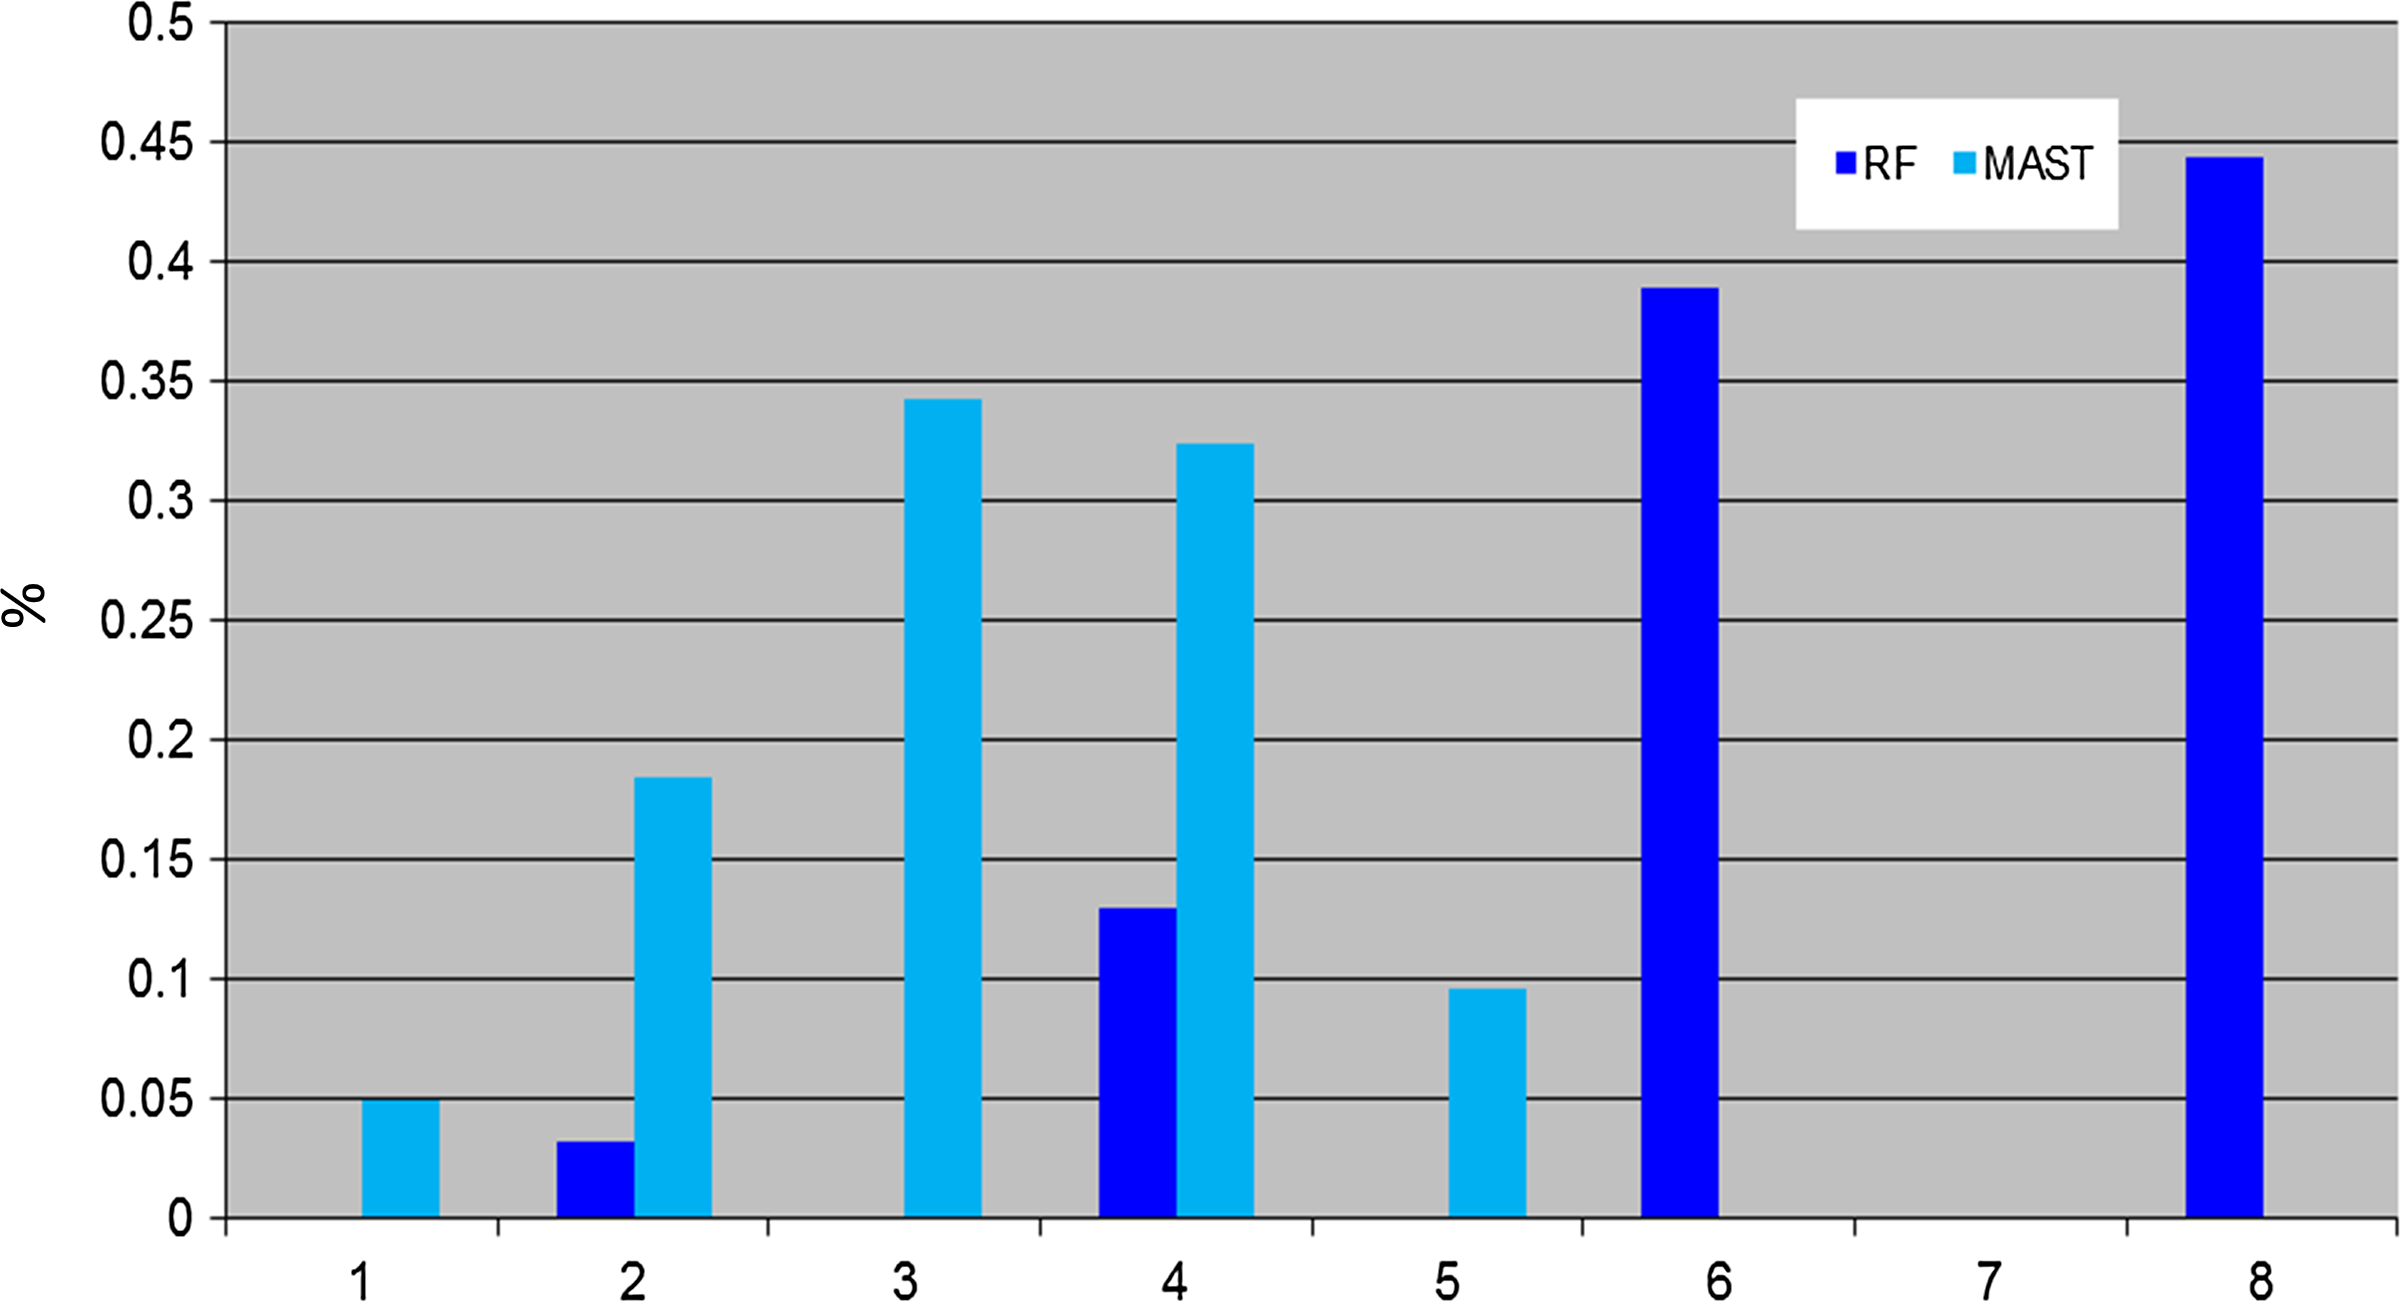
Comparison of distribution of MAST and RF. Comparison of RF dissimilarity measure with MAST, showing that the percentages for number of obtained pairs of trees (y axis) with certain distance values (x axis) using Camp dataset.
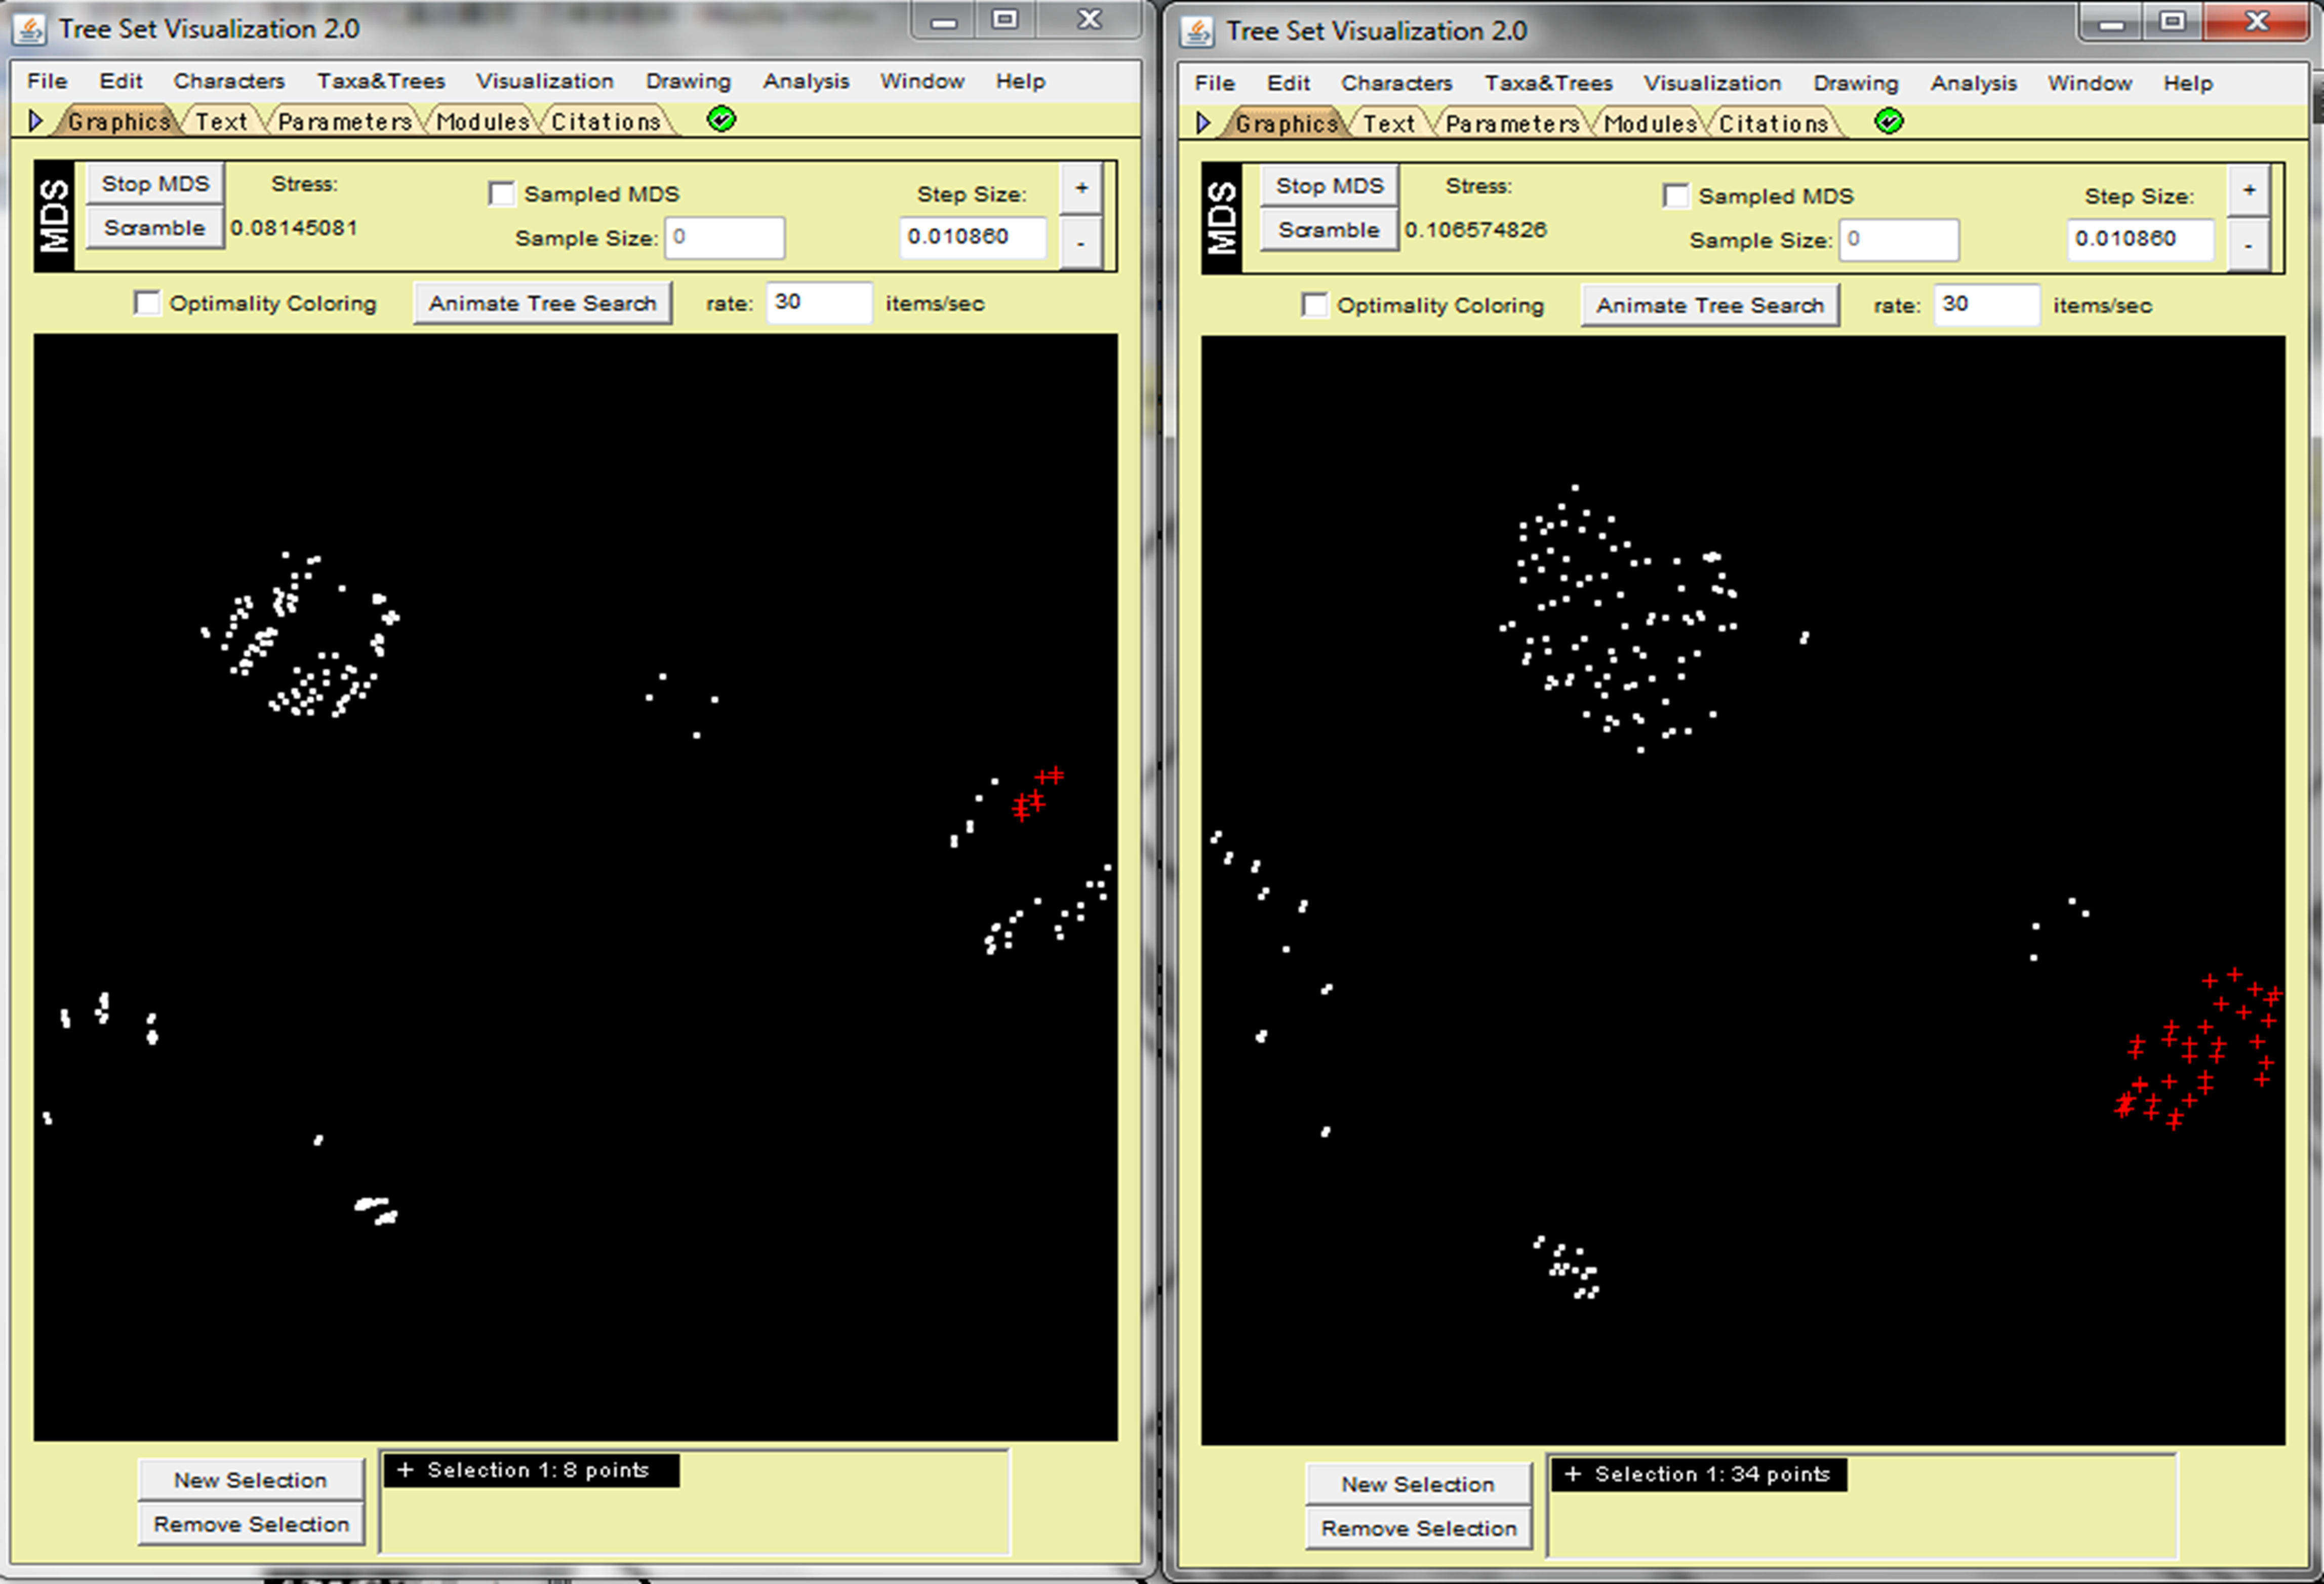
As for the PEVCCA dataset, the scatter of dots in the 2D space for MAST demonstrates a dense aggregation of tree clusters, while RF shows a sparse distribution of tree clusters (Fig. 3). Researchers can use Mesquite to construct a strict consensus tree by highlighting the selected tree groups. Figure 3 shows that the consensus tree created by RF is less informative than the MAST tree (multiple splits from a single tree node). In addition, the Figure 4 histogram indicates that RF distance-values distribution has a similar shape as MAST's; however, MAST results have more unique values (40 different values for MAST but only 29 for RF). The sparse distribution of trees in RF 2D MDS space is due to the wider range of tree–tree distance values, because the incremental interval is a value of two in RF but one in MAST. MAST can distinguish the subgroups while RF cannot detect them due to having more tree comparison values. RR distance has less discrimination than MAST distance and also lacks robustness in the face of very small changes in certain cases.

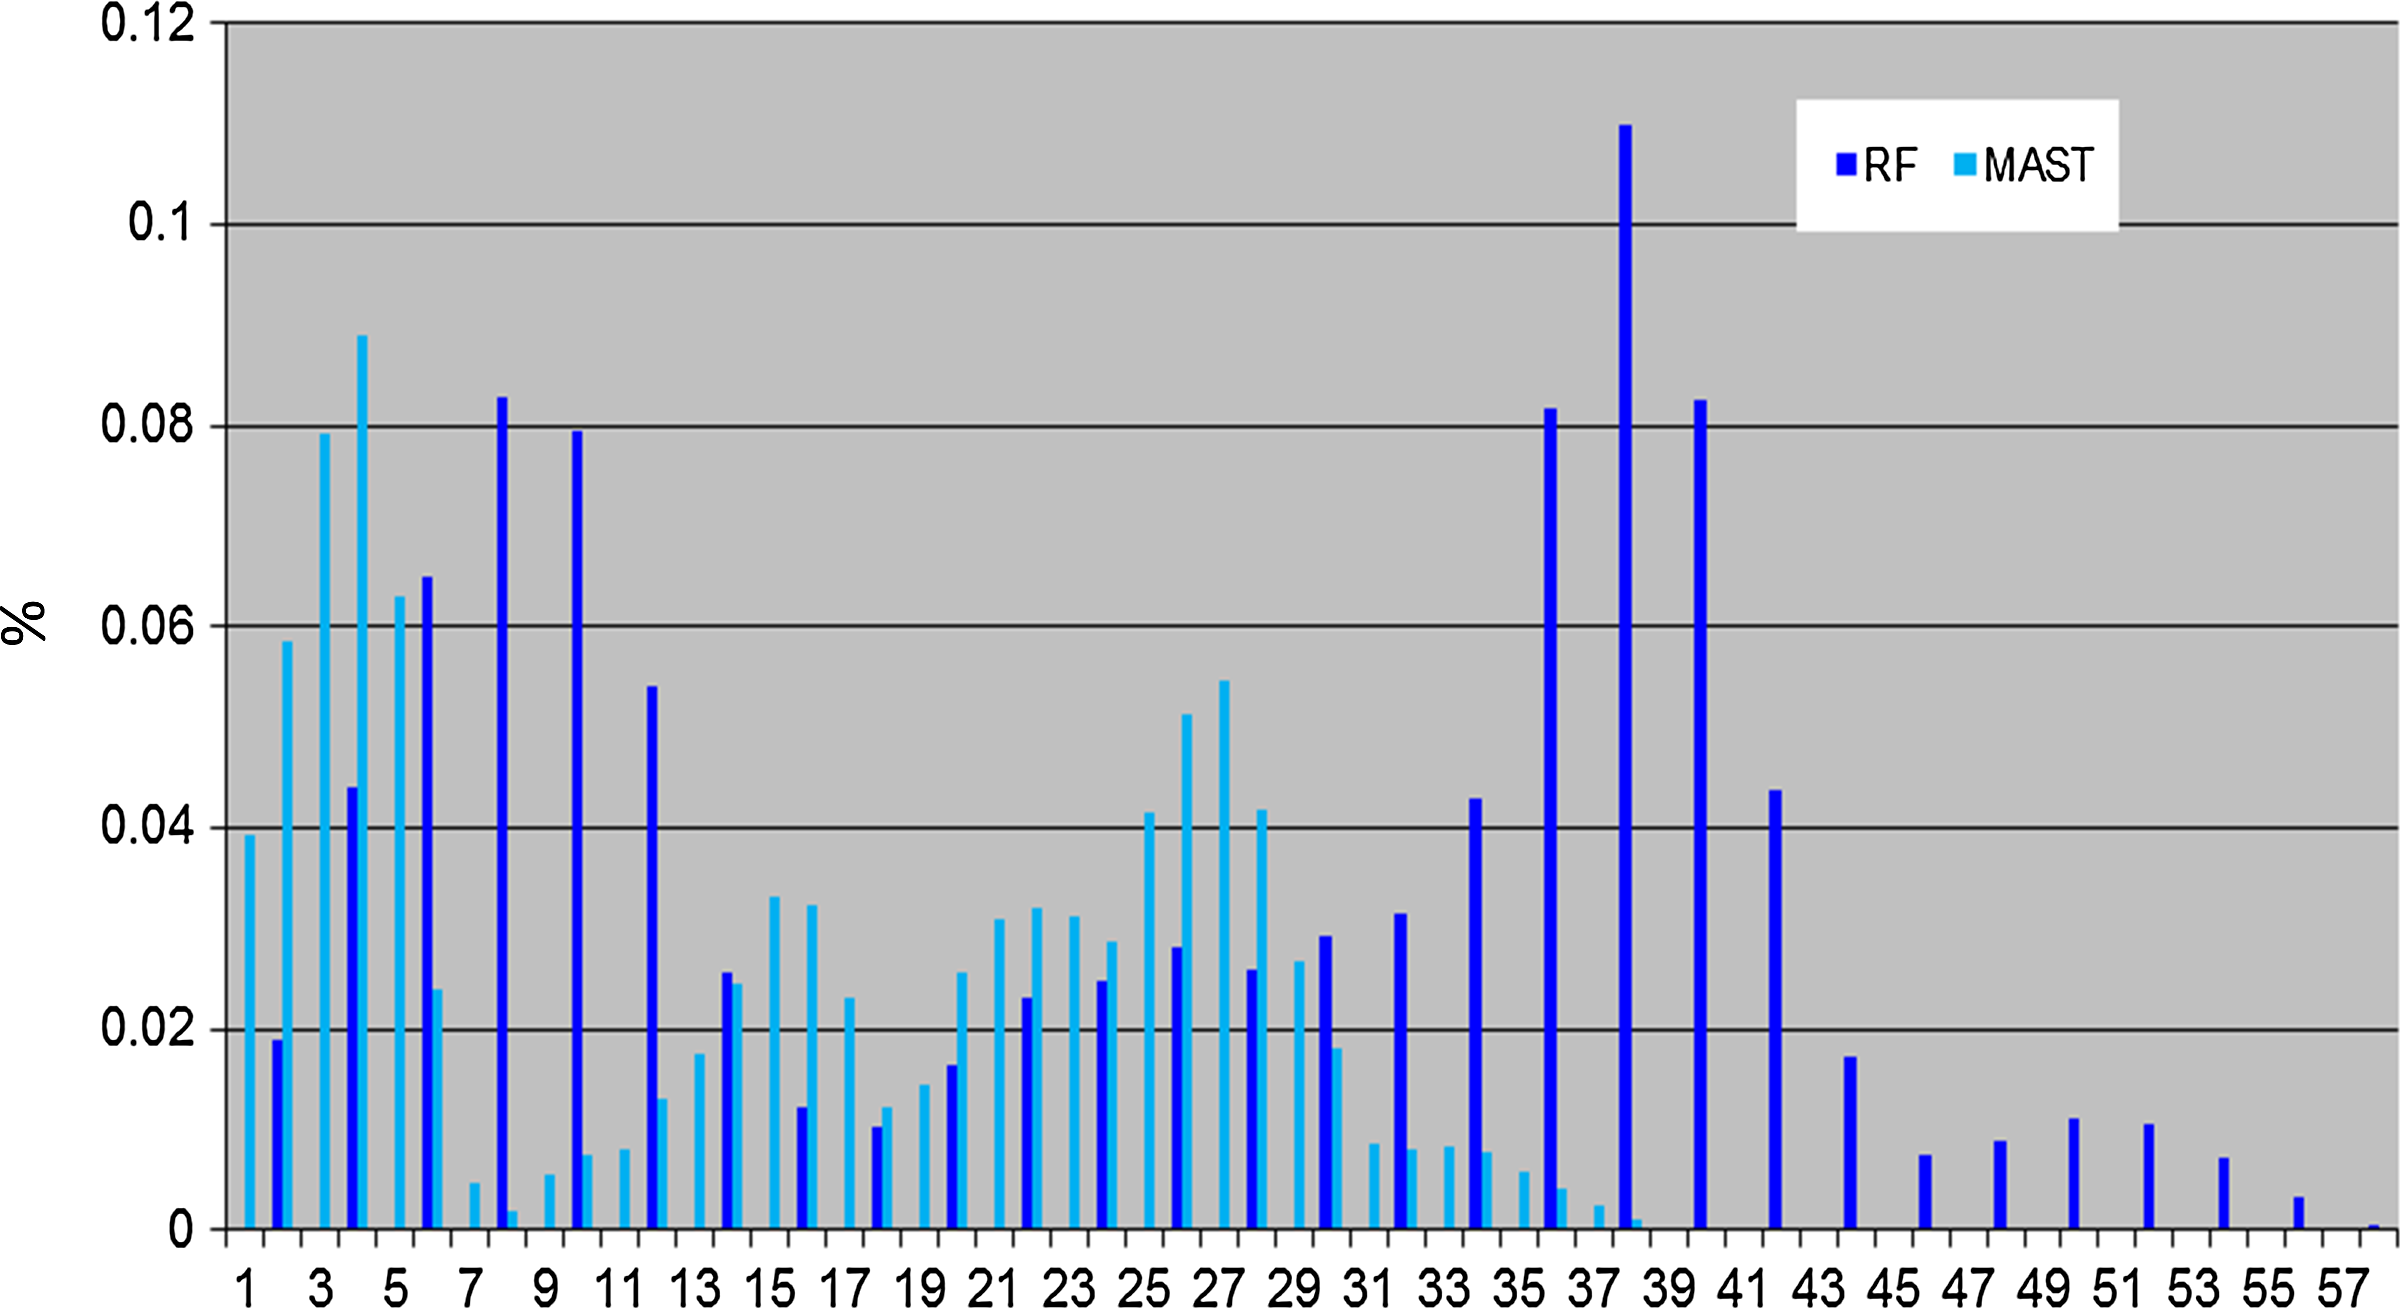
Comparison of distribution of MAST and RF. Comparison of RF dissimilarity measure with MAST, showing the percentages for the number of obtained pairs of trees (y axis) with certain distance values (x axis) using PEVCCA dataset.
Conclusion
In this article, we have proposed the MASTtreedist tree comparison metric for measuring distance between trees and provided its evaluations with other measures such as RF. The RF distance metric is based on the split decompositions of the two tree topologies and the number of edges that have no conflicts in the other tree structure (Robinson and Foulds, 1981). The new measure is the MAST distance metric complementing with RF distance method, which enriches the tree comparison analysis. MAST describes the number of leaves on the largest subtree that both tree structures have in common (Moret et al., 2001). The MAST metric scores include a maximal subset of taxa for which the subtrees are calculated by the input trees in agreement, giving more meaningful results in some cases than other tree comparison metrics. This approach is particularly useful when only a few taxa cause the topological differences among trees, thereby providing a means of identifying these small sets of conflicted taxa.
It is practical for large-tree analysis by optimizing the MAST program running time. Our testing data indicated that MASTtreedist metric, though harder to compute, has theoretical advantages to visualizing the subtle tree differences of large-scale tree comparisons (when only a few taxa are responsible for the incongruity among trees) in the “tree space” using MDS. The program allows users to navigate a set of trees based on their topological similarity and select subsets of trees for further analysis (such as constructing a consensus tree). This approach can be extended to accommodate trees that users would select for new tree reconstruction.
Footnotes
Acknowledgments
The authors would like to express their gratitude to David Swofford and James Wilgenbusch for insightful suggestions and comments on this research.
Author Disclosure Statement
The authors declare that no competing financial interests exist.