




Abstract
Abstract
Microarray profiling has recently generated the hope to gain new insights into breast cancer biology and thereby improve the performance of current prognostic tools. However, it also poses several serious challenges to classical data analysis techniques related to the characteristics of resulting data, mainly high dimensionality and low signal-to-noise ratio. Despite the tremendous research work performed to handle the first challenge in the feature selection framework, very little attention has been directed to address the second one. We propose in this article to address both issues simultaneously based on symbolic data analysis capabilities in order to derive more accurate genetic marker–based prognostic models. In particular, interval data representation is employed to model various uncertainties in microarray measurements. A recent feature selection algorithm that handles symbolic interval data is used then to derive a genetic signature. The predictive value of the derived signature is then assessed by following a rigorous experimental setup and compared with existing prognostic approaches in terms of predictive performance and estimated survival probability. It is shown that the derived signature (GenSym) performs significantly better than other prognostic models, including the 70-gene signature, St. Gallen, and National Institutes of Health criteria.
1. Introduction
It has been reported recently that the major difficulty in deciphering high-throughput gene expression experiments comes from the noisy nature of the data (Tu et al., 2002). Indeed, data issued from this technology are not only characterized by the dimensionality problem but present also another challenging aspect related to their low signal-to-noise ratio. The noise in such type of data is multisource: biological and noisy measurement, slide manufacturing errors, hybridization errors, and scanning errors of hybridized slide (Tu et al., 2002; Nykter et al., 2006). Biological errors are typically caused by internal stochastic noise of the cells and error sources related to sample preparation (Blake et al., 2003). This type of intrinsic noise is present in all measurements, regardless of the measurement technology. Measurement errors, on the other hand, include error sources that are a kind of extrinsic noise directly related to the measurement technology and its limitation (e.g., bias due to the used dyes) (Blake et al., 2003; Nykter et al., 2006). Slide manufacturing errors are related to microarray slide images. These include variation in the spot position and size. In addition, the marks done by a print tip and deformations in the spot shape can be produced. Hybridization errors include background noise, spot bleeding, scratches, and air bubbles (Nykter et al., 2006).
Another possible source of error is the digitization of hybridized slide by scanning. The hybridized slide is read by scanning each dye color separately; it might be possible that channels do not align perfectly (Nykter et al., 2006). Many studies were performed to research the different effects of experimental, physiological, and sampling variability (Lee et al., 2000; Novak et al., 2002). A study has been performed by Tu et al. (2002) to analyze the quantitative noise in gene expression microarray experiments. The authors have shown through two illustrative concrete examples the difference in gene expression caused by experimental noises. In the first example, a comparison between gene expression values measured on the same sample has been performed. Figure 1a shows the overall difference in two measured gene expressions caused by measurement error alone as provided by Tu et al. (2002). The deviation of the scattered points from the diagonal line represents the difference between the two measured transcriptomes. In the second example, two samples from different cultures are compared as shown in Figure 1b so that the measured expression value differences contain the combined effect of the genuine gene expression differences caused by measurement error.
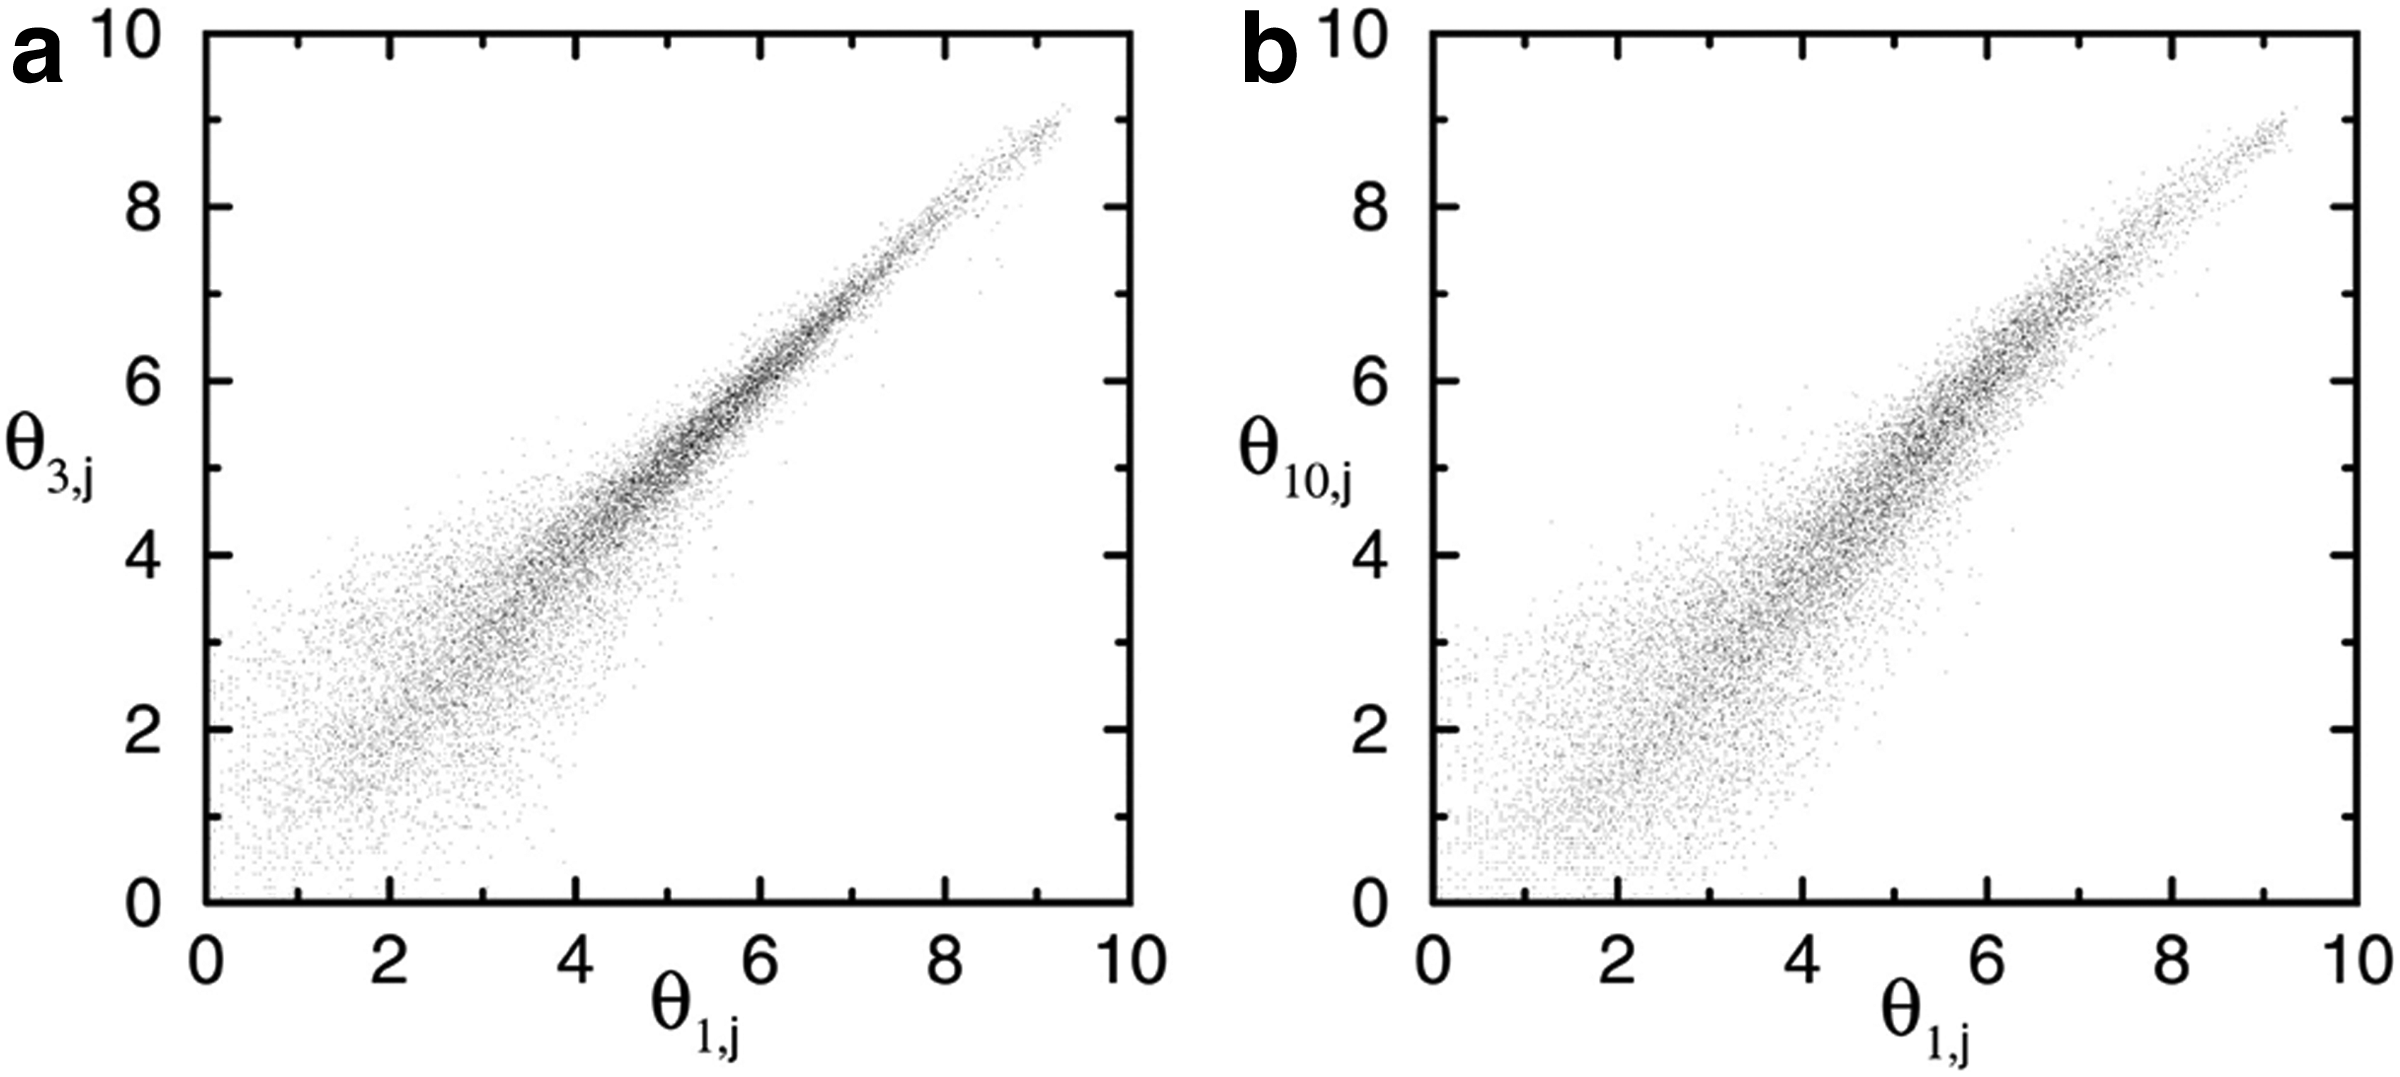
The scatter plot of gene expression pairs:
Although Figure 1a and b appear similar, the causes of deviations in the expression values from the diagonal line are completely different. The first one is caused only by the gene expression measurement error, whereas the second is caused by the combined effect of the gene expression differentiation and measurement error. Therefore, it is crucial to characterize the difference caused purely by experimental measurement from the expression differentiation due to the difference between the two cultures.
Most breast cancer studies performed using classical classification and feature selection approaches for microarray data analysis assume that data are perfect without wondering about their reliability. One common practice to deal with this problem is to transform in a nonlinear way the gene expression levels in a preprocessing phase so that the variance across experiments becomes comparable for each gene (Huber et al., 2002). A drawback with this approach is that a global transformation does not adequately account for the fact that the same gene may be measured with different precision in different experiments. Another drawback with this approach is that a complex nonlinear transformation of the data complicates measurement interpretation when compared with a global transformation.
We propose here to address this problem within machine-learning framework with the aim to design more accurate breast cancer management tools to help the physicians in their decision-making process. An interesting approach would be to use symbolic data analysis (SDA) popularized by Bock and Diday (2000). Within this framework, interval data representation can be used to take into account the uncertainty and noise inherent in measurements (Billard, 2008). Symbolic interval features are extensions of pure real data types, in the way that each feature may take an interval of values instead of a single value (Gowda and Diday, 1992). In this framework, the value of a quantity x (e.g., gene expression value) is expressed as a closed interval [x−, x+] whenever x is noised or uncertain, representing the information that. x− ≤ x ≤ x+ The uncertainty can be related to the incapability of obtaining true values because of possible variability under some changing and complex experimental conditions. However, the introduction of interval representation makes the data-processing task more complex than when only a numerical value is considered, especially when high-dimensionality problem is faced jointly. Therefore, what is really needed is an approach that enables us to process efficiently high-dimensional interval datasets. We take advantage here of our recently proposed algorithm (referred to here as InterSym) that supports such requirements to derive a gene signature for cancer prognosis from microarray datasets.
In the next section, we describe how the uncertainties can be integrated in microarray data through the use of interval representation. We give then in Section 3 a brief description of the interval feature selection algorithm used here to process the issued interval dataset in order to derive a genetic signature. In Section 4, we investigate the proposed strategy on a popular prognostic dataset. We show how the proposed strategy can be used to derive genetic signatures by following a rigorous experimental protocol. The effectiveness of the derived model has been compared with existing prognostic approaches based on either clinical or genetic markers.
2. Dataset
2.1. Raw dataset
The study is performed using the well-known van't Veer dataset (van't Veer et al., 2002). Van't Veer and colleagues used a dataset of 78 sporadic lymph-node-negative patients younger than 55 years of age with tumor size less than 5 cm to derive a prognostic signature in their gene expression profiles. Forty-four patients remained disease-free after their initial diagnosis for an interval of at least 5 years (good prognosis group), and 34 patients had developed distant metastases within 5 years (poor prognosis group). We use the same group of patients in the aim to derive a gene prognostic signature. A patient with missing data (1 poor prognosis patient) was excluded from our study. We describe hereafter how this data set is used to generate an interval microarray dataset using the interval representation to model different uncertainties.
2.2. Interval dataset generation
To take into account the uncertainty in gene expression measurements under the form of symbolic intervals, an appropriate setup should be followed. Let the m gene expression levels be initially represented in a matrix
It results in
At the end of this step, the m gene expression levels are represented in a matrix
For a better conditioning of magnitudes and processing time minimization, a simple linear re-scaling of raw interval values within the interval [0,1] will also be usually performed:
3. Interval Feature Selection
The emergence of microarray technology has made possible the simultaneous measurement of the expression of thousands of genes. This technology has carried with it the hope to gain new insights into cancer biology and may improve current tools for cancer management. However, this technology has also brought serious challenges related to intrinsic characteristics of the resulting data. Mainly two challenges are faced simultaneously: (1) high data dimensionality (thousands of gene expressions for a small number of samples), and (2) the noisy nature of measurements (or low signal-to-noise ratio). Since traditional statistical methods are ill-conditioned to deal with such problems, machine-learning approaches have been picked up as a good alternative to overcome these difficulties (Haibe-Kains, 2009). The first challenge has been already extensively addressed by using feature selection algorithms. During the past decades, feature selection has indeed played a crucial role in problems involving a huge number of features by selecting only the most relevant features for the problem under investigation. Here, we use the term “feature” to refer to a gene marker. Existing feature selection algorithms are traditionally characterized as wrappers and filters according to the criterion used to search for the relevant features (Kohavi and John, 1997; Guyon and Elisseeff, 2003). Wrapper algorithms optimize the performance of a specified machine-learning algorithm to assess the usefulness of the selected feature subset, whereas filter algorithms use an independent evaluation function based generally on a measure of information content (entropy, t-test, etc.) (Kohavi and John, 1997; Guyon and Elisseeff, 2003). Filter algorithms are computationally more efficient but perform worse than wrapper algorithms (Kohavi and John, 1997; Guyon and Elisseeff, 2003). Thereby, with filter algorithms the features are evaluated individually without taking into account the correlation information and redundancy problems. Hence, this can deteriorate drastically the classifier performance (Kohavi and John, 1997).
On the other hand, the noisy nature of microarray measurement poses a great challenge for the existing machine-learning algorithms. However, unlike the high-dimensionality problem, very little attention has been devoted to address this problem by the machine-learning community. Therefore, it is crucial to design efficient feature selection algorithms able to address both problems jointly in order to improve cancer management. One natural idea would be to take use of interval representation to model measurement uncertainty in microarray data. However, this will produce high-dimensional interval datasets, which makes the feature selection task even more challenging. Although traditional feature selection algorithms are proficient for processing high-dimensional numerical data, they remain inappropriate for interval data. In the particular case where feature interval values are regular,* a common practice to apply such algorithms is to label interval values by integers, introducing a metric that is not necessarily the same as in the original data. This can be a potential source of distortion and information loss. In most real applications a feature measurement presents generally a large variation in term of uncertainty and noises from one sample to another, and should be therefore expressed by overlapped intervals. The transformation interval-to-integer in this case is no longer possible and classical algorithms become inapplicable.
We have recently proposed a new interval feature selection algorithm, referred to as InterSym (Hedjazi et al., 2011), which alleviates the previously mentioned problems. InterSym enables processing the interval features in their original form without any restriction on their relative positions (overlapped or regular); no arbitrary mapping is therefore required. To avoid the heuristic search during the feature selection procedure, InterSym optimizes an objective function using classical optimization techniques. The feature's importance is evaluated within a similarity margin framework. Since we address a problem with only two classes (i.e., metastasis or no metastasis), we limit the description of InterSym in this article for binary class problems.
Let
The resulted class prototype for all the features is given by
where
Ui states for the domain of ith interval feature values.
We assume that the nth data sample
A similarity margin for sample xn can be defined as
where Γ
nc
and
A weighted similarity margin can be defined through a weight assignment in the previously defined similarity margin to express the importance of each interval feature as follows
Note that a sample xn is considered correctly classified if
Where ϑ
nc
is the margin of xn computed with respect to the weight vector w. The first constraint is the normalized bound for the modulus of w so that the maximization ends up with noninfinite values, whereas the second guarantees the nonnegative property of the obtained weight vector. A closed-form solution can be obtained using the classical Lagrangian optimization approach:
With r+ = [max(r1,0),… , max(rm,0)]T
InterSym is considered as one of the first feature selection algorithms that enable processing interval feature-type data. Note that the objective function optimized by InterSym approximates the leave-one-out cross validation error and thus chooses only the features if they contribute to the overall performance. Hence, both issues, correlation and redundancy, are addressed by InterSym. Moreover, InterSym avoids the heuristic combinatorial search by using classical optimization approaches to achieve an analytical solution. Furthermore, an extension of InterSym has been also proposed for multiclass problems (Hedjazi et al., 2011). The effectiveness of InterSym in (Hedjazi et al., 2011) has been shown through three real-world applications on low-dimensional interval datasets. However, it would be interesting to assess its effectiveness also on high-dimensional problems such as microarray interval datasets. Subsequently, we apply InterSym algorithm to derive a genetic signature for breast cancer prognosis, by taking into account the measurement uncertainty through the use of interval representation. As mentioned previously, InterSym will enable the selection of relevant information in high-diemensional interval datasets by avoiding any related numerical and heuristic search complexities.
4. Experiments And Results
4.1. Experimental setup
Data issued by microarray technology provides the measurement of thousands of gene expressions for usually small number of patients. This situation can likely lead to serious problem of overfitting of the computational model on training data; that is, the model performs very well on training data but achieves extremely poor results on unseen data. A special experimental protocol therefore is generally adopted to avoid this problem such as cross-validation protocols. Owing to the small sample size in our case, we performed a Leave One-Out Cross Validation (LOOCV) to estimate the optimal classification parameters as proposed by Wessels et al. (2005). In each iteration of this procedure, one sample is held out for testing and the remaining samples are used for training. The training data are used to estimate the optimal parameters of the classifier and to perform the feature selection task. The resulting model is employed then to classify the held-out sample. This experiment is carried out on all samples so that each of them has been used once for testing.
Very few classification methods are capable to deal with interval representation particularly if intervals may overlap. Therefore, we choose to use here the LAMDA classifier (Learning Algorithm for Multivariate Data Analysis) (Hedjazi et al., 2012), which is able to efficiently handle interval data as well as numerical and qualitative data, to demonstrate the predictive values of the derived prognostic signature by InterSym and comparing its performance with those of existing approaches such as clinical-based approaches (St-Gallen, all clinical markers, … ) and genetic-based approaches (70-gene signature). For this classifier, only one parameter needs to be specified in the training phase (exigency index).
In the study performed by van't Veer and colleagues, a 70-gene signature has been derived from the same dataset using a feature selection method based on correlation coefficient. The predictive value of the 70-gene has been then assessed by using a correlation based classifier (van't Veer et al., 2002).
4.2. Results
A genetic signature, referred to here as GenSym, was derived based on the InterSym algorithm corresponding to the optimal classification performance using the LAMDA classifier. We note that both of InterSym and LAMDA enable to handle appropriately interval data for classification and feature selection, respectively (see previous sections for more details). Table 1 shows the classification performance obtained with LAMDA using the GenSym signature. For comparison, classification performance using the 70-gene signature, clinical markers, St-Gallen consensus, and National Institutes of Health (NIH) criterion are also reported in Table 1. We observe that the GenSym signature significantly outperforms the 70-gene, clinical, and classical clinical criteria (St-Gellen, NIH).
MammaPrint signature.
Chemio when one criterion is satisfied: ER negative; lymph node positive; tumor size >2 cm; grade III or II; age <35 years.
Chemio when lymph node positive or tumor size >1 cm.
Acc., Accuracy; NIH, National Institutes of Health; TP, true positive; FP, false positive; FN, false negative; TN, true negative; Sens., sensitivity; Spec., specificity.
GenSym achieves indeed a high accuracy (∼90%) while significantly improving specificity and sensitivity of the 70-gene signature (by more than 6% and 10%, respectively). In the study performed by van't Veer and colleagues, the sensitivity level has been set to 90% in order to ensure a high classification rate of poor prognosis patients, which has led to a poor specificity level (72%). GenSym, however, while providing a sensitivity level close to the threshold imposed by van't Veer and colleagues, ensures a similar high level of specificity, enabling therefore to spare a big number of good prognosis patients from receiving unnecessary toxic treatment.
Classification performance is not always a sufficient criterion for comparing predictive values of different marker signatures. Performance measurement can also depend strongly on a decision threshold when only a limited number of patients are available. Varying this decision threshold enables to visualize the performance of a given classifier over all sensitivity and specificity levels through a receiver operating characteristic (ROC) curve.
For further comparisons of the different approaches, we plotted in Figure 2 the ROC curve for GenSym, 70-genes, and clinical-based approaches. The St-Gallen and NIH criteria are not shown here since the good prognosis group contains very few patients. It can be observed that the GenSym signature significantly outperforms the 70-gene signatures as well as clinical markers over almost all sensitivity and specificity ranges.
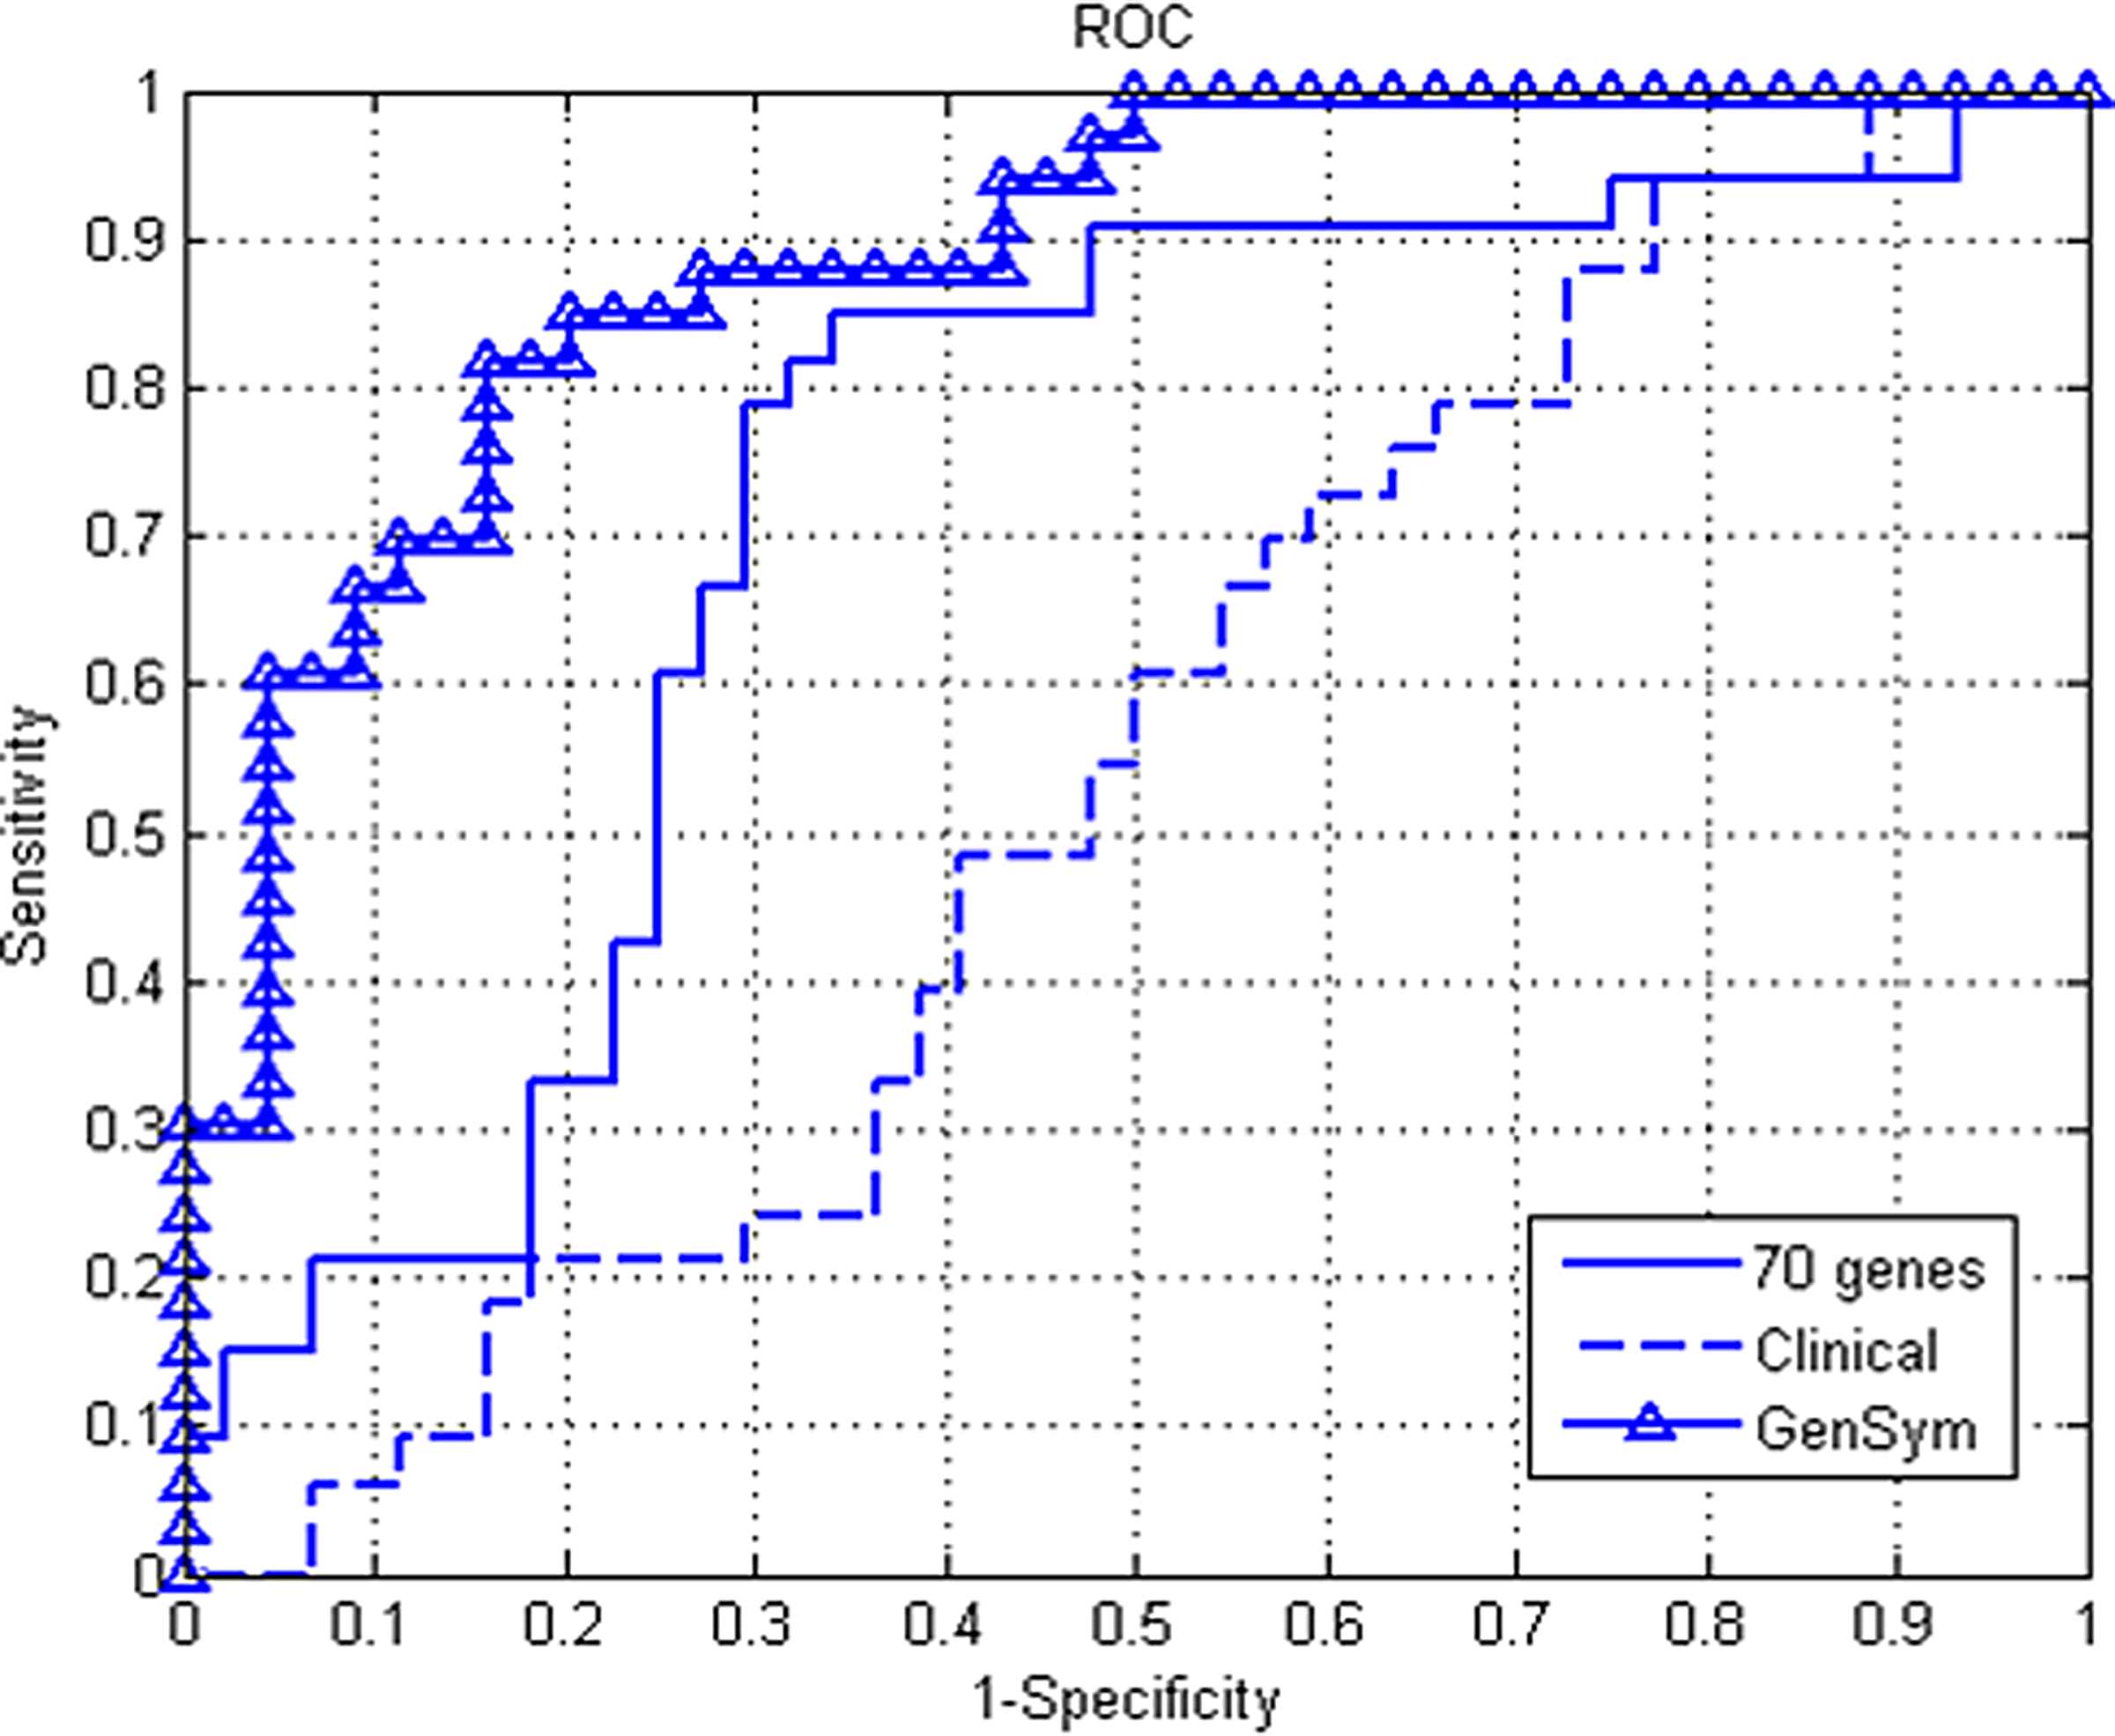
Receiver-operating characteristic curve of GenSym, 70-gene, and clinical approaches.
We performed also survival data analysis of the four approaches—GenSym signature, 70-gene signature, clinical markers, and St-Gallen criterion—to further demonstrate the prognostic value of the GenSym signature. The Kaplan–Meier curves with 95% confidence intervals of, respectively, the four approaches are shown in Figure 3. Particularly the GenSym signature induces a significant difference in the probability of remaining metastases-free in patients with a good signature and the patients with a poor prognostic signature (p < 0.001). The hazard ratio (HR) estimated by Mantel–Cox approach of distant metastases within 5 years for the GenSym signature is 8.20 (95% CI: 4.16–16.2), which is superior to the 70-gene signature, St. Gallen consensus, or clinical markers. The HRs obtained for clinical and St. Gallen consensus (respectively, 2.32 [95% CI: 1.36–3.95] and 1.17 [95% CI: 0.46–2.92]) are consistent with those reported in many similar studies (Wang et al., 2005; Sotiriou et al., 2006), suggesting that clinical markers have a bad predicting value.
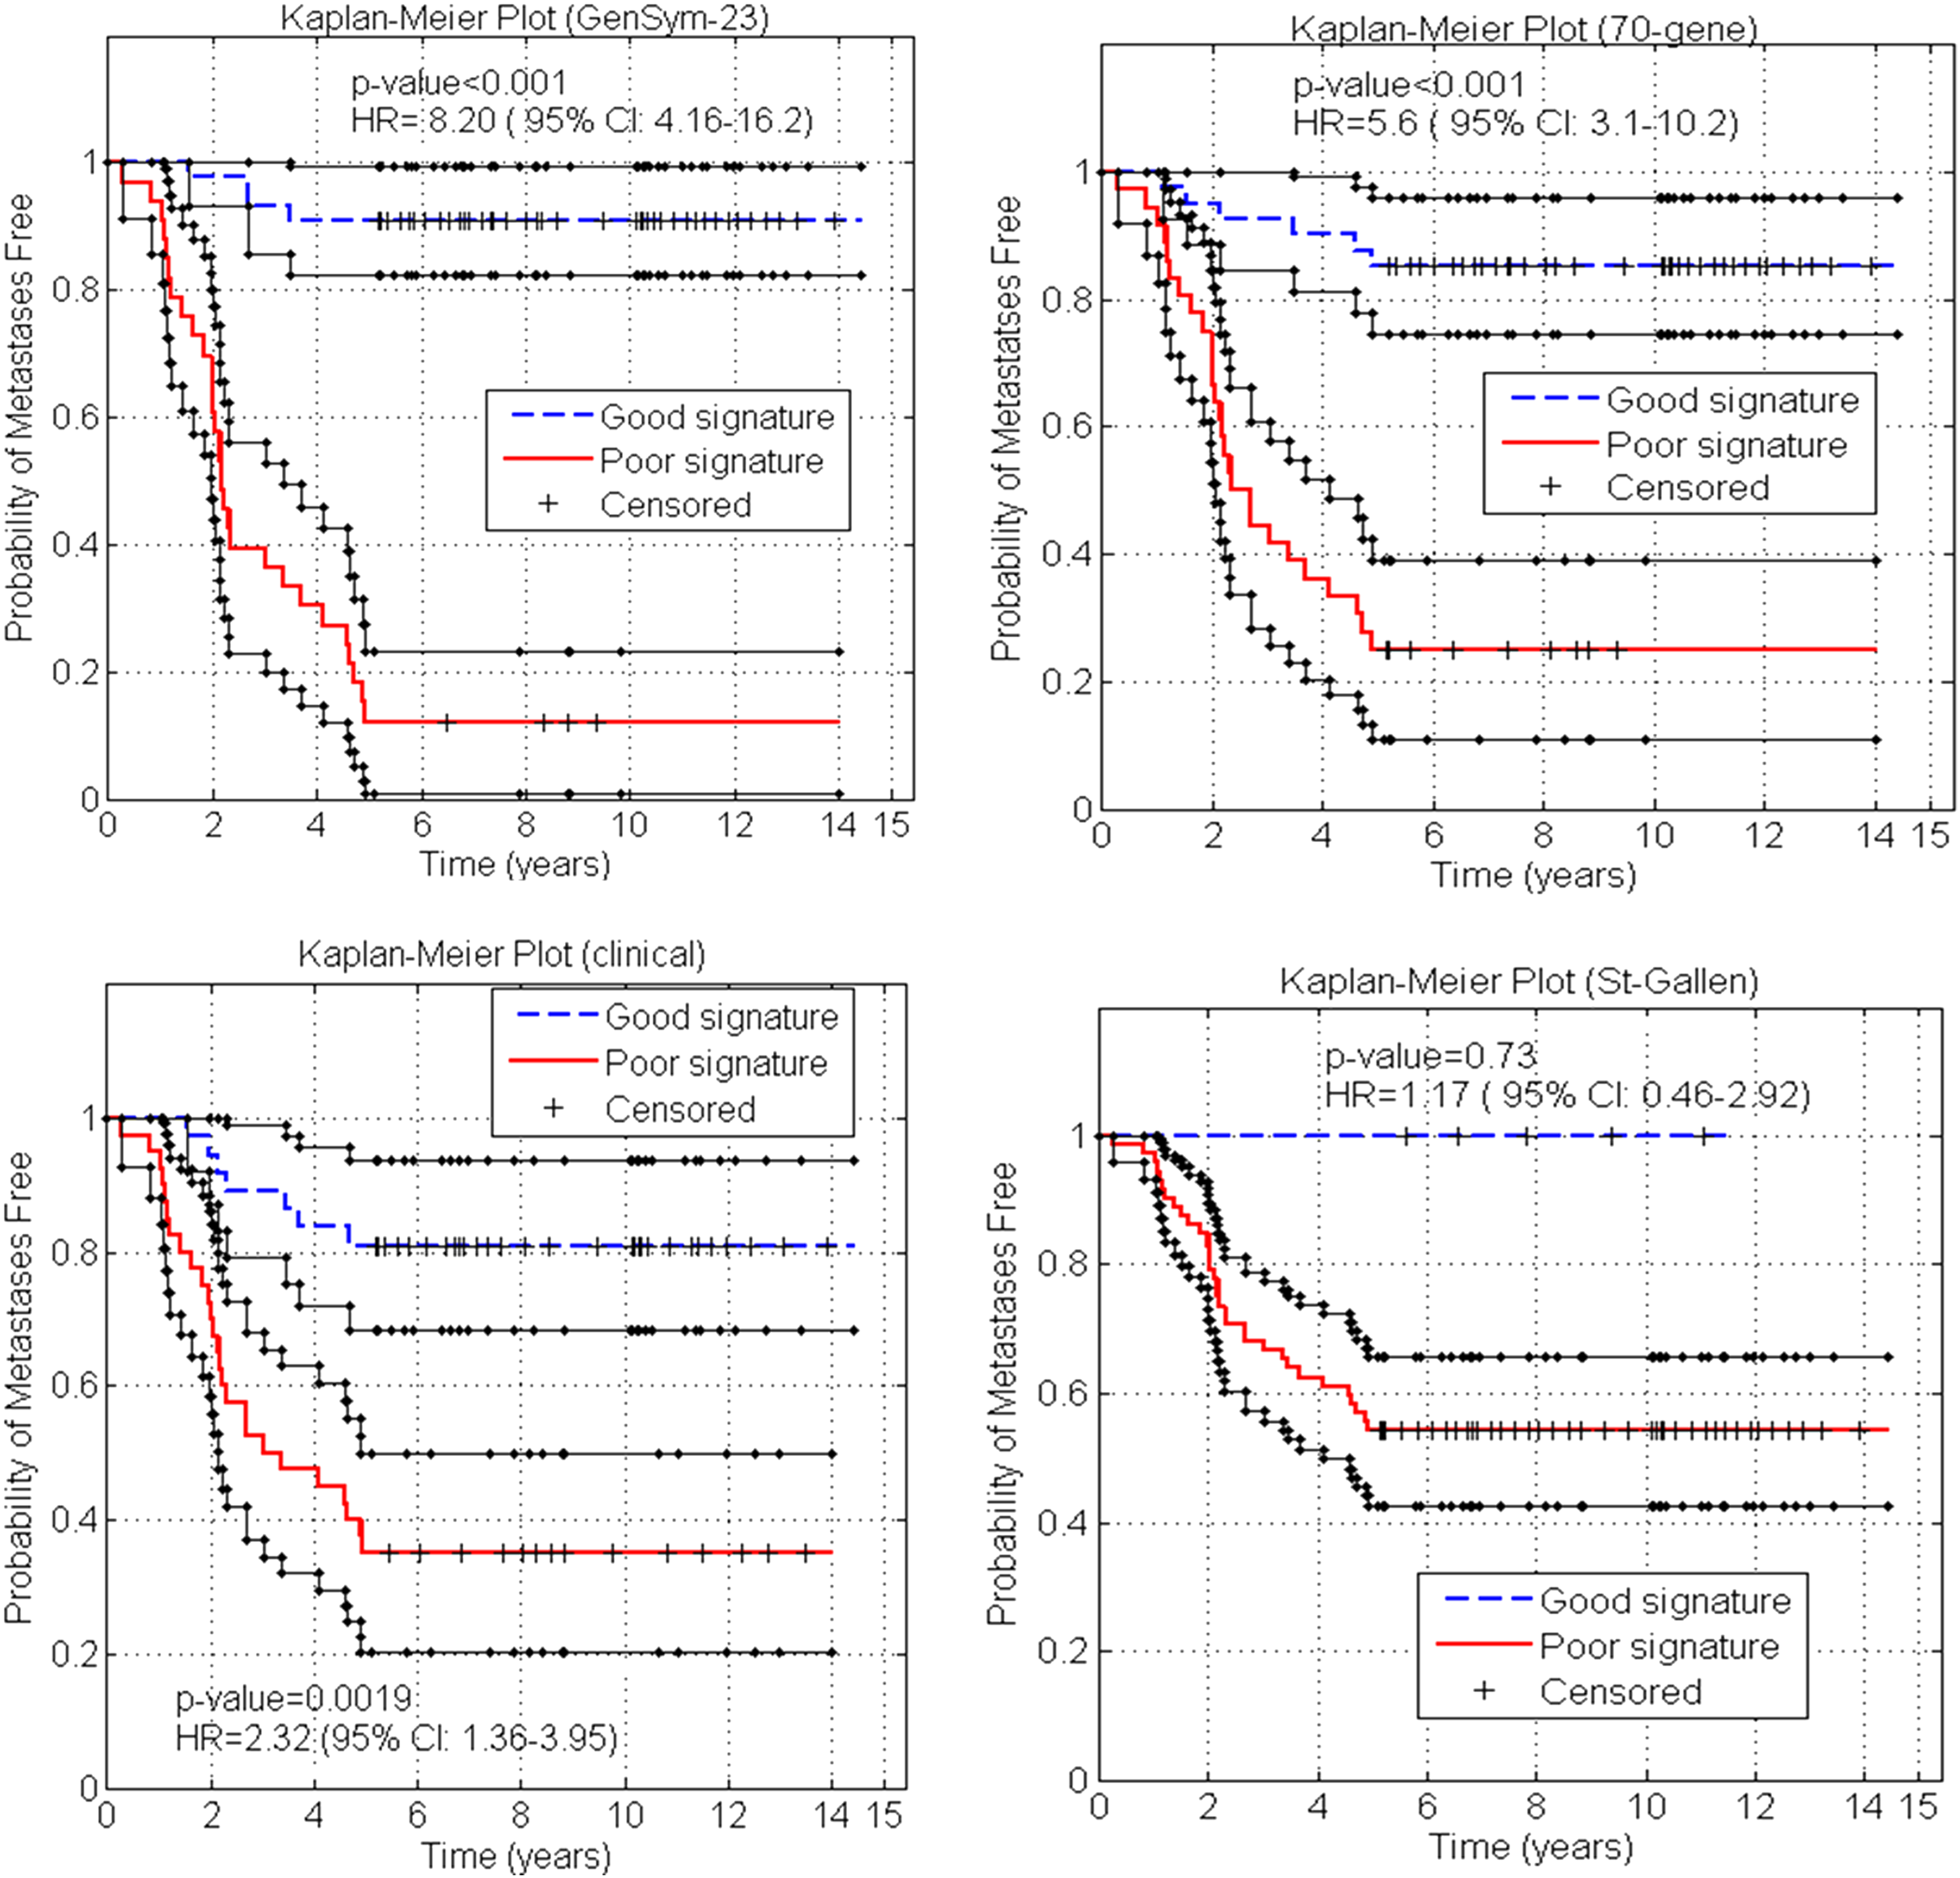
Kaplan–Meier estimation of the probabilities of remaining metastases-free for the good and poor prognosis groups. The p-value is computed using log-rank test.
4.3. GenSym signature
The GenSym signature is composed of 23 genes (given in Table 2); among them, 12 genes are listed in the 70-gene signature. Although the held-out testing sample is not involved in the identification of a gene signature in each iteration, we have found that the identified signature stays relatively stable over all iterations. The functional annotation for the genes should provide insight into the underlying biological mechanism leading to rapid metastases. According to the National Center for Biotechnology Information (NCBI) databases, among the GenSym signature, genes involved in proliferation, invasion, and metastasis are significantly unregulated in the metastasis group. For instance, we find TSPYL5, which has been revealed to play important roles in modulation of cell growth and cellular response probably via regulation of the akt signaling pathway. It is reported that TSPYL5 is a poor prognosis marker and reduces the p53 protein levels and inhibits activation of p53 target genes. This is the top-listed gene in the 70-gene signature. MMP-9 is also related to tumor invasion and metastasis by its capacity for tissue remodeling via extracellular matrix as well as basement membrane degradation and induction of angiogenesis. Evaluation of MMP-9 expression seems to add valuable information on breast cancer prognosis.
■, listed in 70-gene signature; □, not listed in 70-gene signature; N/A, not available.
The GenSym signature holds also many new meaningful genes (such as FBP1, IGFBP5, FGF18, SSX1, NUSAP1, C1GALT1, BTG2, and PEX12). The importance of both FBP1 and IGFBP5 can be highlighted by the actually suspected relation between the insulin and tumor growth (Becker et al., 2012), but neither FBP1 nor IGFBP5 has been evaluated independently in human cancers. However, FBP1 has been also found strongly associated with disease outcome among the 231 top-ranked genes by van't Veer et al. (2002). FGF18 has been revealed to be clearly involved in the carcinogenesis of ∼10% breast cancer. NUSAP1 has also been found to be related to proliferation and cell division. SSX1 is involved in certain sarcomas; it controls the cell cycle and is considered as an important transcription factor. C1GALT1 is a protein that plays an important role in cell adhesion, whereas BTG2 is considered as a tumor suppressor.
5. Conclusions
In this article, we addressed the problem of low signal-to-noise ratio in microarray data faced jointly with the high-data-dimensionality problem. The basic idea is to take advantage of SDA capabilities to alleviate this issue, suggesting the use of interval representation to model uncertainty in microarray measurements. We derived them based on our recently proposed interval feature selection algorithm—a genetic signature. The GenSym signature holds some common genes with existing genetic signatures as well as new genes showing a meaningful biological interpretation and high relevance to the biology of breast cancer disease. We have shown through a preliminary computational study that the use of such strategy can improve and simplify significantly the cancer prognosis task by selecting a small number of relevant genetic markers as compared with other existing signatures (only 23 markers). Its predictive value has been assessed also through this study and compared with existing genetic signatures and clinical criteria. We believe that the proposed strategy will open the door wide for the introduction of a new generation of symbolic algorithms in bioinformatics applications.
To further demonstrate the effectiveness of the proposed strategy, a larger-scale experimental study is now underway in the framework of a research project using data of a large number of patients issued from publicly available datasets.
Footnotes
Acknowledgments
This work was supported in part by the ANR project INNODIAG involving the companies Dendris, Innopsys, and laboratories LAAS, ICR, ITAV, and PFBT.
Author Disclosure Statement
No competing financial interests exist.
*
Interval features take their values from an accountable set of interval values.