
Abstract
Abstract
Pancreatic cancer is an aggressive malignancy with a five-year mortality of 97–98% due to widespread metastatic disease. A better understanding of the molecular mechanism of pancreatic cancer is beneficial for the development of novel approaches for early detection and monitoring of pancreatic cancer. We aim to comprehensively identify the gene expression profile in pancreatic cancer and explore the molecular pathway of pancreatic cancer disorder. Using GSE15471 datasets downloaded from Gene Expression Omnibus data, we first screened the differentially expressed genes in pancreatic cancer using packages in R language. The key pathways of differentially expressed genes were investigated with the Kyoto Encyclopedia of Genes and Genomes (KEGG) pathway enrichment analysis and synergetic network construction based on weighted Jaccard index. A total of 13,211 differentially expressed genes were identified, and they were enriched in several pathways, such as mitogen-activated protein kinase (MAPK) signaling pathway, transforming growth factor (TGF)-beta signaling pathway, Janus kinase–signal transducers and activators of transcription (JAK-STAT) signaling pathway, and calcium signaling pathway, as well as cell cycle, focal adhesion, complement and coagulation cascades, and leukocyte transendothelial migration. Synergetic pathway network analysis revealed that cytokine–cytokine receptor interaction pathway, calcium signaling pathway, and focal adhesion pathway were three important pathways in the development of pancreatic cancer. The method introduced here is helpful to screen the key pathways for controlling pancreatic cancer progression and provide potential therapeutic targets in the treatment of pancreatic cancer.
1. Introduction
Recently, a large number of studies have explored the molecular markers for early prediction of pancreatic tumor, such as CA50 (Pasquali et al., 1994), CA494 (Friess et al., 2006), CA242 (Ni et al., 2005; Zhou et al., 2012a), and CA19-9 (Humphris et al., 2012), all of which are the current commonly used markers for clinical diagnosis of pancreatic carcinoma. In addition, some cell factors such as transformation growth factor (TGF) (Gaspar et al., 2007); macrophages inhibitory factor (MIC) (Denz et al., 2010); soluble intercellular adhesion molecule-1 (sICAM-1) (Roland et al., 2010); soluble vascular cell adhesion molecule-1 (sVCAM-1) (Kuehn et al., 1999); and selectin (Iwai et al., 2006; Panoussopoulos et al., 2010; Yoshimoto et al., 2012) are believed to be critical in the diagnosis, treatment, and prognosis assessment of pancreatic cancer. However, any sensitive enough and highly specific tumor markers for early pancreatic cancer screening have not been identified (Sharma et al., 2011).
It is suggested that a better understanding of the molecular mechanism of pancreatic cancer is beneficial for the development of novel approaches for early diagnosis of pancreatic cancer. DNA microarray analysis as a global approach has been widely used to investigate physiological mechanisms in cancer, including pancreatic cancer (Han et al., 2002; Holtrup et al., 2011; McCormack et al., 2012). In this study, we used the same strategy to identify differentially expressed genes between pancreatic cancer and normal samples and further investigated their crucial pathways involved in the pancreatic cancer development, which may clarify the mechanism of pancreatic cancer disorders.
2. Material and Methods
2.1. Gene expression profile of pancreas cancer mRNA
For research on the molecular pathogenesis of pancreatic cancer, we downloaded pancreatic cancer gene expression profiles (access number: GSE15471) from the Gene Expression Omnibus (GEO) database (Badea et al., 2008), which is based on the Affymetrix GPL570 platform data (Affymetrix Human Genome U133 Plus 2.0 Array). This dataset contains 78 samples (39 cancer samples and the corresponding pairs of normal samples).
2.2. Pathway data
For identification of the disordered pathways in pancreatic disease, we downloaded pathway data from Kyoto Encyclopedia of Genes and Genomes (KEGG) database (Kanehisa, 2002). KEGG is organized in a hierarchical structure that first records information of six main pathways concerning metabolism, genetic information processing, environmental information processing, cellular processes, organismal systems, and human diseases (Class I), and further classifies them into 37 subcategories (Class II), which contain 244 pathways (Class III).
2.3. Gene ontology data
Gene ontology (GO) terms were utilized to investigate the functional properties of selected genes. GO data were obtained from the Gene Ontology database (Harris et al., 2004). The data contain two sets of information that are used, the parent–child relationships for each node and the definitions of each node or term. Gene IDs were converted to corresponding Entrez Gene IDs using gene2accession, and the relationship between the GO ID and gene ID was then extracted from the National Center for Biotechnology Information's (NCBI) annotation (gene2go). We chose to analyze all GO categories containing 15–350 genes.
2.4. Affymetrix data preprocessing
Raw expression datasets were preprocessed using the robust multichip average (RMA) algorithm available in the R affy package (Gautier et al., 2004) with steps including background correction, quantile normalization, and probe-set summarization (Irizarry et al., 2003). Mean expression levels from multiple probe sets corresponding to the same gene (entrez gene ID) were calculated to represent the gene expression level. Finally, a gene expression matrix (19803*78) with normalized and standardized expression values was thus generated.
2.5. Differentially expressed gene screening
Significance of gene expression differences between normal and cancer samples was tested by classical paired t-test, and the p-values were adjusted for multiple comparisons using the false discovery rate (FDR) of Benjamini and Hochberg (1995). The genes with FDR-corrected p-values <0.01 were considered as differentially expressed genes.
2.6. KEGG pathway enrichment analysis
To explore the biological function of differentially expressed genes, KEGG pathway enrichment analysis was performed by hypergeometric distribution (Storey and Tibshirani, 2003). Assuming that KEGG pathway has N genes, the number of differentially expressed genes is n, and m genes are involved in one specific pathway, the probability of generating k overlapping genes at least is calculated as follows:
2.7. Synergetic network of pathways construction
For identification of the synergetic relationships between pathways, the pathway–pathway function similarity network was constructed. Weighted Jaccard index was used to measure the crosstalk between pathways (Evgeny et al., 2011; Shmelkov et al., 2011). We defined the intersection of KEGG pathway, for example, path A and the GO node, e.g., term B, as intersection (A, B), and the union set of them as union (A, B). The formulation follows:
The number of gene annotation is limited in KEGG pathway but relatively meticulous in GO annotation, which has no information of intergene regulation. Therefore, crosstalk between significantly changed pathways was established via the 52 GO nodes, which was significantly enriched at p < 0.05. The relationship between KEGG pathway and GO node was first measured based on the Jaccard index, and the edge between KEGG pathways was obtained by weighting the Jaccard index of pathway and GO. Each pathway was scored and ordered according to the weight and number of the pathways to confirm the key pathway (Fig. 1).
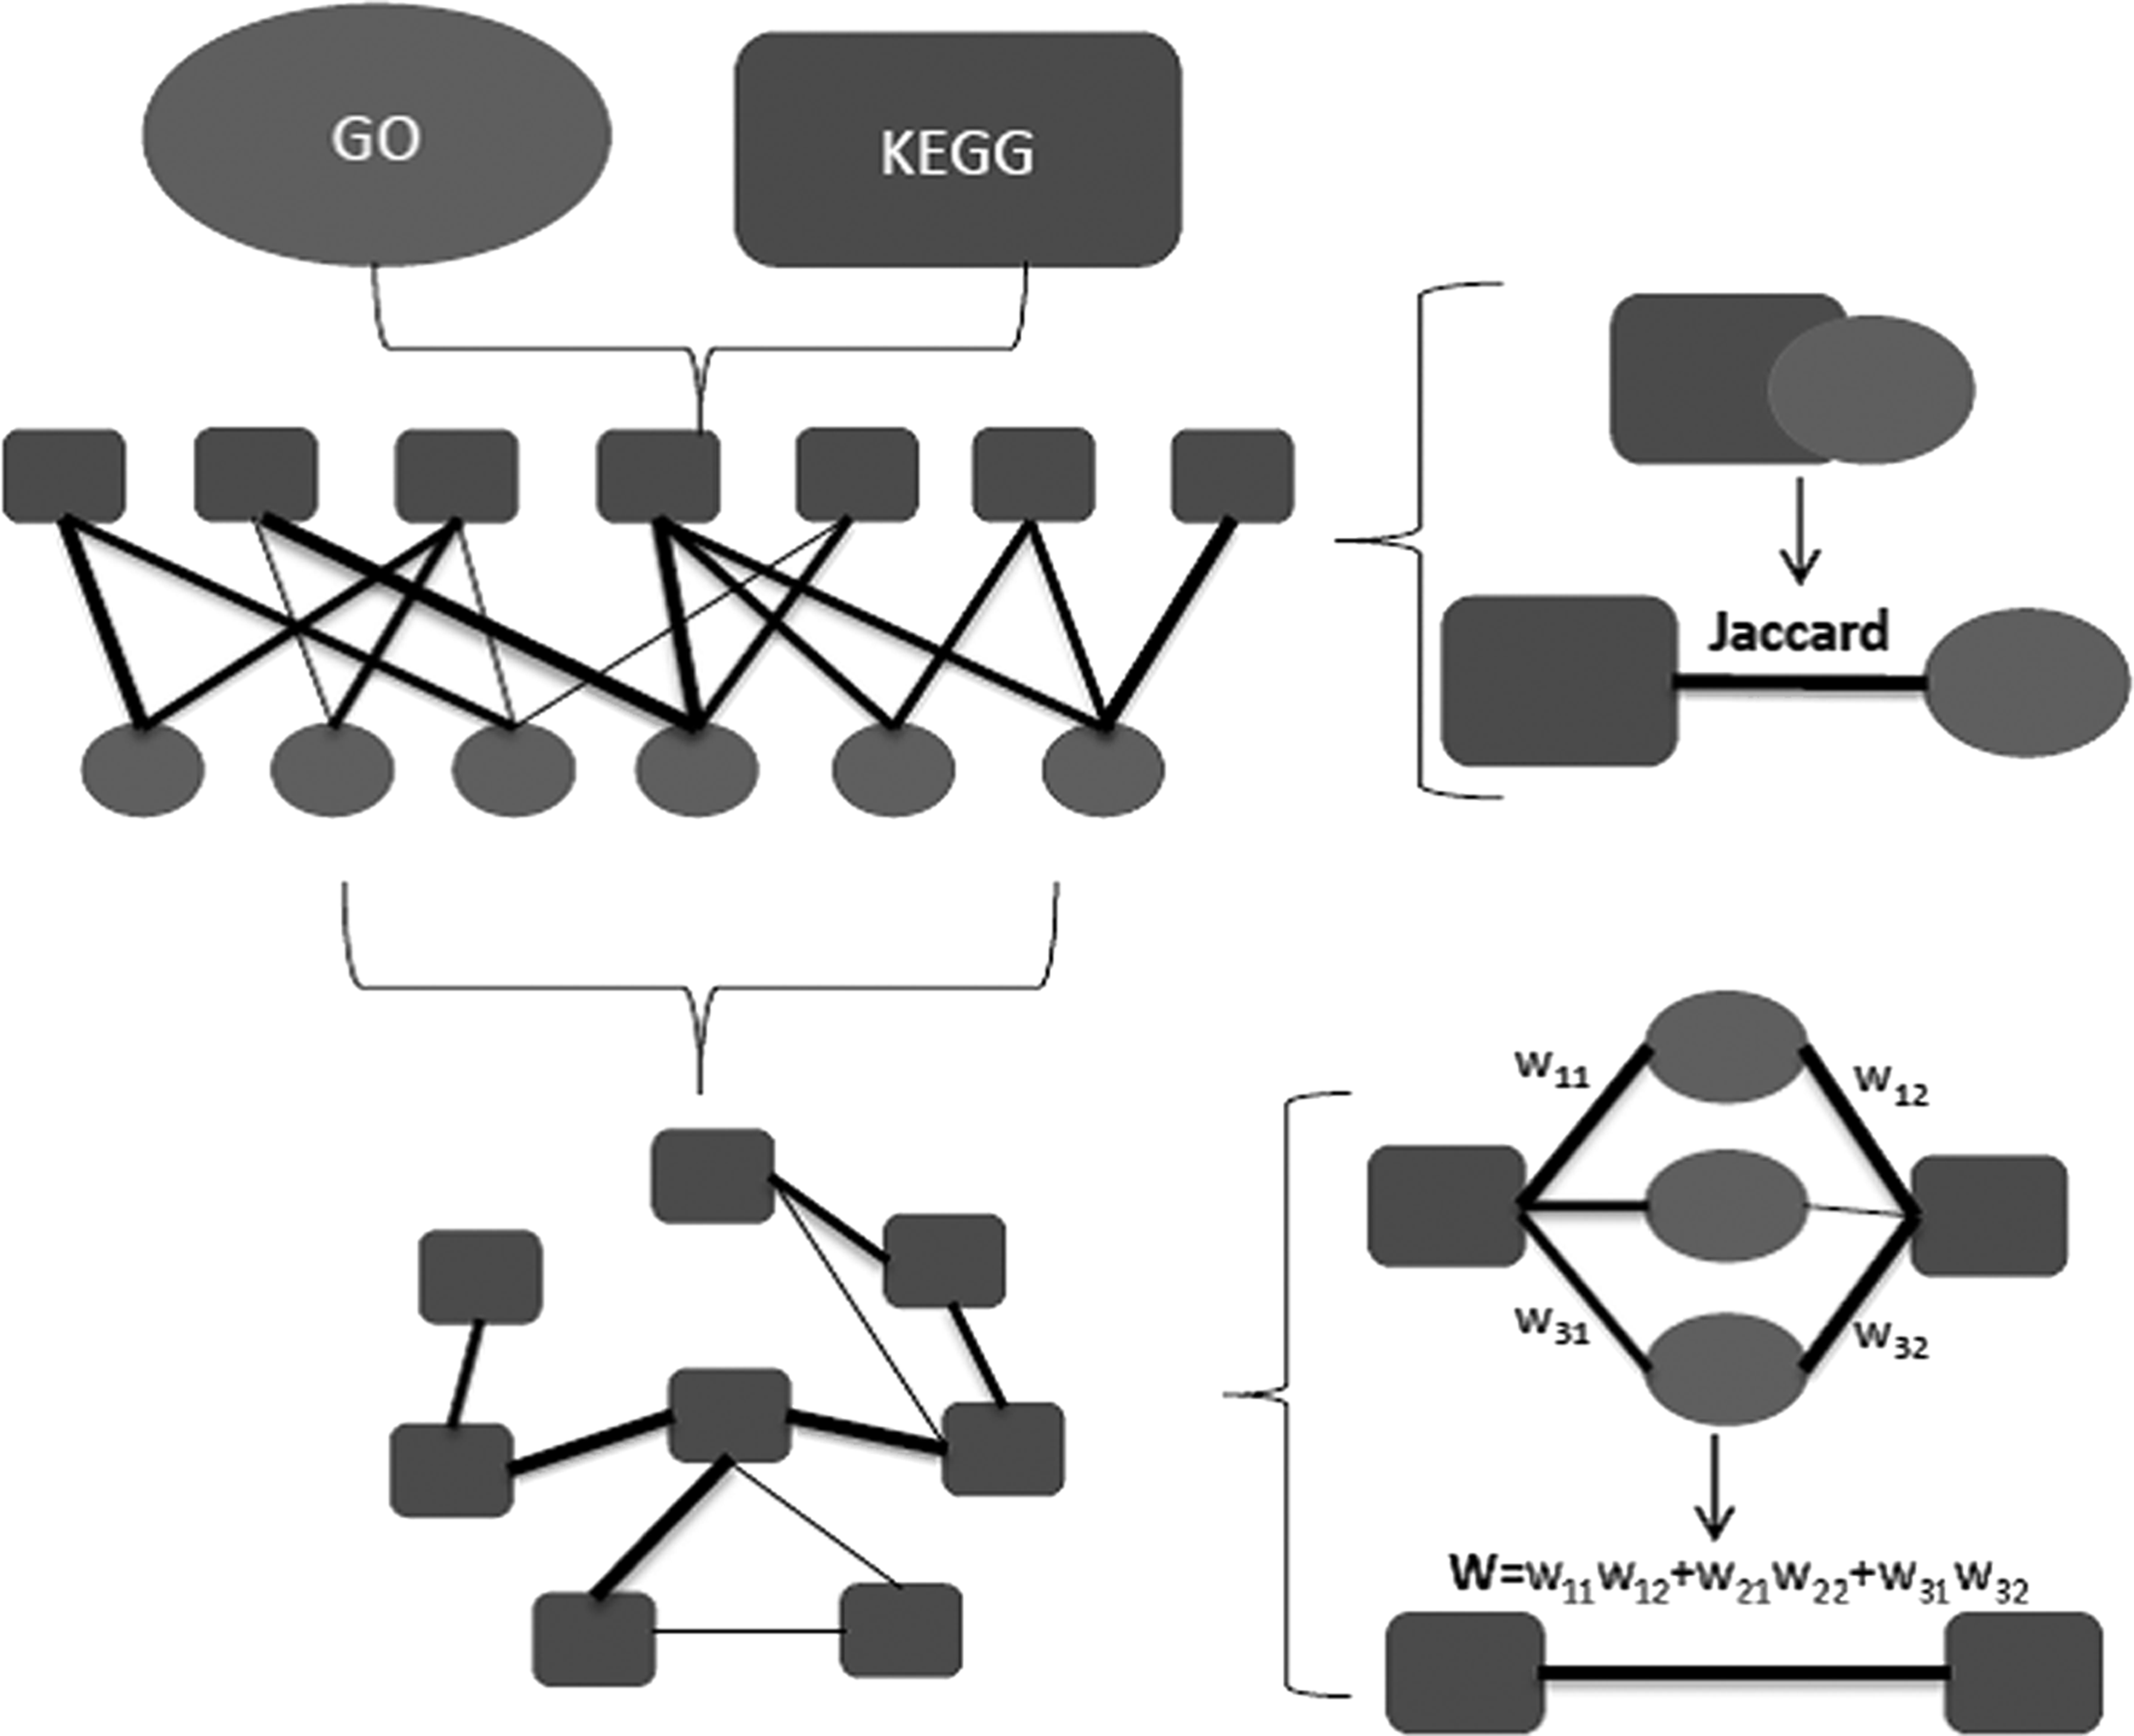
The flowchart: The angular squares are the KEGG pathway, the circles are the GO nodes, and the width of lines represent different weights.
3. Results
3.1. Function analysis of differentially expressed genes of pancreatic cancer
A total of 13,211 differentially expressed genes were obtained under the control of FDR <0.01. Hypergeometric enrichment analysis was first performed to enrich the differentially expressed genes into the 37 subpathways of KEGG at Class II level. Among them, 11 subpathways were shown significantly disordered according to the cutoff of FDR <0.05, including signal transduction, immune system, signaling molecules and interaction, cell growth and death, transport and catabolism, development, cell communication, cell motility, and other cancer hallmark–related function classes (Table 1). To analyze relatively disordered pathways in detail, hypergeometric enrichment analysis was further performed to enrich the differentially expressed genes into the 244 pathways of KEGG at Class III level (Table 2). A total of 21 pathways were found significantly disordered with FDR <0.05, mainly including those normally disordered signal pathways in cancers (such as MAPK signaling pathway, TGF-beta signaling pathway, JAK-STAT signaling pathway, and calcium signaling pathway), cellular proliferation–related pathways (such as cell cycle), cell migration–associated pathways (such as focal adhesion), and immunity pathways (such as complement and coagulation cascades and leukocyte transendothelial migration).
Class II represents KEGG pathway names; # pathway represents the number of pathways included; # gene represents the number of genes in the pathway; # anno-DEGs represents the number of the differentially expressed genes; p-value is calculated using the hypergeometric distribution.
FDR, false discovery rate; KEGG, Kyoto Encyclopedia of Genes and Genomes.
Class III represents KEGG pathway numbers; Pathway name represents pathway name; # gene represents the number of genes in the pathway; # DEGs represents the number of differentially expressed genes; p-value is calculated using the hypergeometric distribution.
GABA, gamma-aminobutyric acid; MAPK, mitogen-activated protein kinase; TGF, transforming growth factor; HTLV-I, human T-lymphotropic virus type I.
3.2. Synergistically disordered pathways of pancreatic cancer
To identify the interaction among pathway modules, the weighted Jaccard index was used for measurement of the crosstalk among pathways and then the synergistic network was constructed. As shown in Figure 2, several pathways were linked.

The Crosstalk Network of Notable Pathways: Network nodes are KEGG pathways, and the sides are weights of pathway–pathway crosstalk.
3.3. Analysis of key pathway in pancreatic cancer disorder
Each pathway was scored and ordered, according to the weight and number of the pathways, to define the key pathway. It was obvious that the top three nondisease pathways were cytokine–cytokine receptor interaction pathway, calcium signaling pathway, and focal adhesion pathway (Fig. 2). All of them might exert important effects in pancreatic cancer.
4. Discussion
The methods we applied here offer a way to screen the key pathways in pancreatic cancer development and reconstruct the links between pathways. We recognized that cytokine–cytokine receptor interaction pathway, calcium signaling pathway, and focal adhesion were highly associated with pancreatic cancer disorder, which seem to be in accordance with previous results.
Cytokine–cytokine receptor interaction pathway may be highly linked to the genesis and progression of pancreatic cancer because the most differentially expressed genes (211; Table 2) were enriched in this pathway. IL-1α has been demonstrated to induce selective upregulation of α6β1-integrin and uPA/uPAR in pancreatic cancer cells, and these changes may modulate the aggressive functions of pancreatic cancer (Sawai et al., 2006). IL-6 affects the androgen-receptor signaling pathway, which is important for cell migration activities (Okitsu et al., 2010). IL-8 protein is overexpressed in pancreatic adenocarcinoma samples, compared with the matched para-cancer tissues, and considered as a fine serum marker for predicting the prognosis pancreatic cancer (Chen et al., 2012). Importantly, cytokines exert important roles by interacting with their receptors. For example, IL-8 and IL-8 receptors (CXCR1 and CXCR2) are overexpressed in pancreatic cancer, and their expression enhances the invasiveness of pancreatic cancer cells (Kuwada et al., 2003). IL-13 can cause transforming growth factor-β activation only in IL-13Rα2–positive pancreatic tumor cells (Shimamura et al., 2010). IL-13Rα2 also serve as a prognostic biomarker of invasion and metastasis in pancreatic cancer (Fujisawa et al., 2009).
Another significant disordered pathway is calcium signaling pathway. As we all know, calcium ion is an important mediator of various intracellular processes, including cell proliferation, apoptosis, and migration (Capiod et al., 2007). Blockade of Ca2+ influx into the cells by Ca (2+)-channel blockers, such as phenytoin and verapamil, can affect the Ca (2+)-calmodulin pathway, leading to suppression of pancreatic cancer cell growth (Sato et al., 1994). Hsp70 overexpression in pancreatic cancer cells inhibits apoptosis by attenuating intracellular calcium (Dudeja et al., 2006). M1978 activation of calcium-sensing receptor suppresses proliferation and motility in human pancreatic cancer cells (Shim et al., 2010).
There is evidence that focal adhesion is related to pancreatic cancer invasion and metastasis. For example, an irregular and discontinuous deposition of type IV collagen and laminin in the basement membrane is found in pancreatic cancer tissue. The abundant expression of the “antiadhesive” extracellular matrix proteins tenascin and vitronectin close to the cancer cells, and the expression of cell-surface receptors such as alpha v (vitronectin-binding) suggest an increased capacity for pancreatic cancer cell motility (Linder et al., 2001). Collagen I promotes metastasis in pancreatic cancer by activating c-Jun NH2-terminal kinase 1 and upregulating N-cadherin expression (Shintani et al., 2006). Expression of the integrin-β1 is significantly higher in pancreatic cancer patients than healthy individuals, and this expression is significantly associated with clinical stage and liver metastasis (Zhou et al., 2012b). Knockdown of the β1 integrin subunit reduces primary tumor growth by 50% and completely inhibits spontaneously occurring metastasis (Grzesiak et al., 2011).
In addition, invasion and metastasis of the tumor are complex multistage processes that can be summarized as: primary tumor proliferation, angiogenesis, tumor cell invasion through basement membrane, invasion to blood or the lymphatic vessels, survival in the circulation system, formulation of tumor bolt, and metastases. Visibly, angiogenesis plays an important role during each step, from invasion to metastases (Skobe et al., 1997; Ikeda et al., 1999; Korc, 2003; Khorana et al., 2007; van der Zee et al., 2011). Therefore, inhibiting angiogenesis may inhibit the invasion and metastasis of pancreatic cancer or metastatic tumors. A reasonable deduction is that cytokine–cytokine receptor interaction pathway (Kim et al., 2010), calcium signaling pathway (Chen et al., 2011), and focal adhesion (Baek et al., 2011; Stewart et al., 2011) may affect the development and progression of pancreatic cancer through the known angiogenesis mechanism because they are all reported to be related to angiogenesis.
In conclusion, it is promising to identify the differentially expressed genes and key pathways using introduced methods, which may provide some molecular markers for the pancreatic carcinoma therapies. However, there are some limitations in this study. For example, pathway enrichment analysis was performed only viewing genes as a gene set, not taking relationships between genes into consideration. The differential degree between differentially expressed genes and the up- or down-regulation relationship were not considered when constructing the crosstalk among pathways. Therefore, further studies are still needed to confirm our conclusions.
Footnotes
Acknowledgments
This project is supported by grants from the National Natural Science Foundation of China (Nos. 30872510, 81272534, 81260349); the Natural Science Foundation of Hubei Province (No.2008CDB127); and the Natural Science Foundation of Shanghai (No.064119620 10411968400). This work is funded by the Health System Key Discipline Group of Pudong New District (PWZXKQ2010-5).
Author Disclosure Statement
The authors declare that no competing interests exist.