
Abstract
Abstract
Mapping reads to a reference genome is a routine yet computationally intensive task in research based on high-throughput sequencing. In recent years, the sequencing reads of the Illumina platform have become longer and their quality scores higher. According to our calculation, this allows perfect k-mer seed match for almost all reads when a close reference genome is available subject to reasonable specificity. Our other observation is that the majority reads contain at most one short INDEL polymorphism. Based on these observations, we propose a fast-mapping approach, referred to as “SEME,” which has two core steps: First it scans a read sequentially in a specific order for a k-mer exact match seed; next it extends the alignment on both sides allowing, at most, one short INDEL each using a novel method called “auto-match function.” We decompose the evaluation of the sensitivity and specificity into two parts corresponding to the seed and extension step, and the composite result provides an approximate overall reliability estimate of each mapping. We compare SEME with some existing mapping methods on several datasets, and SEME shows better performance in terms of both running time and mapping rates.
1. Introduction
Many short-read mapping methods have been developed along the evolution of the sequencing technologies (Li and Homer, 2010). The specific read length, error rates, and patterns of each technology at the time are the primary constraints in the design of mapping algorithms. In the early days of NGS, the short reads were only 35bp long and error rates were fairly high for the Illumina/Solexa platform. Furthermore, 5–6 years ago the 32-bit architecture was the main model for PCs or cluster nodes, and their memory size is limited to less than 4Gb. Bowtie (Langmead et al., 2009) applied the Burrows-Wheeler transform and its associated FM index, a compressed fult-text substring index, to the representation of the reference and could reduce the memory footprint to as low as 1.3Gb for the human genome. This advantage makes Bowtie very popular among high-throughput sequencing users. Although the Burrows-Wheeler transform is effective in searching perfect matches of a k-mer in a reference, we have to allow mismatches to maintain sensitivity. For instance, MAQ (Li et al., 2008a) and SeqMap (Jiang and Wong, 2008) use spaced seeds that allow up to k mismatches. Bowtie conducts a backtracking search to allow mismatches and mitigates excessive backtracking through “double indexing,” which doubles the memory footprint. No matter what method is used for handling mismatches, complexity is substantially increased.
As chemistry and instruments of NGS are under constant improvement, the reads are getting longer with higher quality. Now the Illumina platform can generate reads longer than 100 bp with fairly high quality. MiSeq (MiSeq Personal Sequencer - Illumina) can even sequence reads up to 250 bp. Some short read mapping programs, like Bowtie2, have been developed for these longer reads. Bowtie2 maps multiple evenly distributed seeds of a read and uses dynamic programming to extend seed alignments into a full alignment that allows INDELs (insertions and deletions). We observed that INDEL errors are extremely rare compared to substitution errors for Illumina systems. Thus, if an INDEL occurs in an alignment or mapping, most likely it results from a polymorphism between the read and the reference.
Most high-throughput sequencing applications are for conserved genomes such as those of humans, which are the focus of this article. Gu and Li (1994) found that the size of INDELs obeys a power law distribution in human and rodent pseudo genes: 78 human pseudo genes were analyzed and showed that the average length of small INDELs is less than three; furthermore, among those INDELs with length no larger than 20 bp, 95% of them are no larger than 11 bp. Mills et al. (2006) found that INDELs locate throughout the genome at a frequency of one per 7.2 kb on average. If we approximate the occurrences of short INDELs by a Poisson point process that matches the frequency (Waterman, 1995), the probability of finding at most one INDEL in a 100 bp window is greater than 0.9999. Most existing methods apply dynamic programming to allow general INDELs. This is usually unnecessary for mapping short reads when a close reference genome is available.
Partially motivated by the above considerations, we propose a new short-read mapping method, referred to as SEME (sequential exact seed-match and extend) hereafter, which focuses on mapping Illumina short reads generated from conserved genomes. Different from most existing seed-and-extend methods that map multiple seeds simultaneously, SEME scans the read according to a specific strategy and maps the seeds sequentially. Once a seed is perfectly matched to the reference, we extend it on both sides to obtain the full alignment result or reject it. This approach avoids mapping a fixed number of seeds for each short read. The higher the sequencing quality, the fewer number of seeds are needed in SEME on average. This feature is particularly favorable as sequencing technology improves. In the extension step, we introduce the AMF (auto-match-function) method to detect up to two INDELs. Compared with alignment algorithms based on dynamic programming, the average complexity of the AMF method is linear. For the remaining complicated occasions, which are rare, we can incorporate the Smith–Waterman (Smith and Waterman, 1981) algorithm for full alignments.
As important as is the computational complexity of an algorithm, its mapping rate and accuracy, which is usually measured by sensitivity and specificity, needs to be statistically evaluated fairly. For example, BLAST (Altschul et al., 1990) is now widely used in the search of sequence databases. Its success comes from both its efficient algorithmic implementation and the associated statistical evaluation of the alignment significance (Karlin and Altschul, 1990; Waterman, 1984, 1995). In the situation of mapping short reads, the read length, say 100 bp, is so small compared to the genome size that the classical asymptotics of alignment cannot be applied directly. In this report, we make some efforts to evaluate the accuracy of the SEME procedure. In concert with the algorithm, we start off by comparing two sequences of the same read length. If one sequence is different from the other by only substitution and small INDEL polymorphisms plus sequencing errors, then the chance of such an event is defined to be the sensitivity. On the other hand, if one sequence is sampled randomly, say, according to an independent and identically distributed (i.i.d.) model for the sake of simplicity, then accepting a match leads to a false positive error and its chance needs to be calculated. To evaluate the overall specificity, we decompose the entire genome into many reads of the same read lengths, either overlapping or nonoverlapping, and apply the above result to provide bounds to the probability of accepting at least one match by chance across the genome. We could complement the analysis based upon the simple model by simulation as well. With a probabilistic framework that takes into account read length, read error pattern, and polymorphism rate, we can optimize the seed length by trading off sensitivity and specificity.
To enhance sensitivity, we propose a soft counting criterion for accepting or rejecting a mapping result if appropriate sequencing quality scores are available. That is, we impute “possible polymorphism” fractions from mismatches based upon polymorphism rates and quality values and use the sum of these fractions for decisions.
This article is organized as follows. In Section 2, we describe the data structure, the seed, and the extension algorithm, along with complexity evaluation. In Section 3, we present our statistical analysis of the sensitivity and specificity. In Section 4, we show some simulation results that complement the theoretical analysis and report mapping results on several Illumina datasets and compare them with Bowtie2 and SOAP2. In Section 5, we discuss various issues such as pair-end data, methylation, software implementation, and the features of SEME.
2. Method
SEME follows a “seed-and-extend” paradigm. In the first stage, it extracts k-mers sequentially from a short read, and for each k-mer, SEME searches through the reference for perfect-match locations where the read can anchor. We will discuss the selection of k later. In the second stage, SEME extends the seed on both sides separately. If the read is indeed from a reference location, then their true alignment falls into three categories: no INDEL, one INDEL, and other more complicated INDEL patterns. As we explained earlier, most short reads from a conserved genome contain no more than one INDEL and possibly some mismatches. Thus, the principal task of extension can be simplified as follows: on each side of the seed, detect the possible “one INDEL” including its type, position, and length (no larger than a given upper bound). We introduce the auto-match vector and auto-match function to efficiently solve this problem.
The search for k-mer exact-match across a reference genome is a common theme in most mapping tools. Several options are available for implementation. If memory size is limited, then the Burrows-Wheeler transform is a good choice for compressing the genome and index information. If memory is sufficiently large, then hashing can help speed up the search (Zaharia, 2011).
2.1. Data structure and binary search
In our scheme, we may use more than one kind of seed sizes, depending on the data. Therefore, we propose to use the index table of 32-mers for the human genome. That is, we encode each 32-mer subsequence of the reference genome by an integer

Illustration of the index table. The blue bar is the reference sequence. The short bars on top of the reference represent 32-mers s(i) extracted from the reference. The sorted 32-mers {s(i)} and their corresponding indices u[i] are listed in the table below. Only the reference genome and {u[i]} are kept in random access memory (RAM).
We make a note here. Regardless of the value of k, we can carry out a search of the 32-mer starting at the same position as the k-mer. Along the binary search, the lower bound either stays or moves upward while the upper bound either stays or moves downward. We could have two outcomes: At some point, the 32-mer hits a match with either the lower or the upper bound; otherwise, the 32-mer matches neither of the two bounds when they meet. In the former case, the 32-mer finds a perfect match. In the latter, we check the maximum number of matching nucleotides between the target and the lower bound starting from the beginning position. Similarly, we check the number for the upper bound. If this number is no smaller than k, then the k-mer has its perfect match on the genome. In comparison, a search based on hashing does not have this flexibility.
Each item in the index table is a 32-bit integer that needs 4 bytes, and the reference genome takes no more than 1Gb. They add up to no more than 13Gb. As the 64-bit architecture is taking over in the computer business, this memory requirement is not a serious problem. However, if we select every other 32-mer in the genome, say, those at the odd addresses, then the resulting index table would be around 6Gb, and the total memory requirement is less than 7Gb. Of course, to be consistent with this configuration, we need to search two consecutive k-mers on a short read before we jump to the next seed. According to our simulation, this reduction of memory sacrifices very little in terms of performance.
To reduce the steps of binary search, we could introduce “block address” or “zip code” for each 32-mer, which is encoded into an integer in the range [0, 432 − 1]. For a number r < 30, we pick up the 2
r
integers
2.2. Seed stage
In this stage, we use the strategy GSM (grouped scan and map) to scan the short read sequentially to find a perfectly matched seed, in other words, to anchor the short read to a candidate position in the reference genome. Since we only index a single strand of the reference to save memory, we scan both short reads and their reverse complements. For the sake of simplicity, we describe the scan scheme on one strand.
The scan function GSM puts all seeds of a short read into several groups. It scans the first seed of each group in the first round and the second seed in the next round. This process continues till a seed is mapped or the number of trial seeds exceeds a certain threshold. Figure 2 is an illustration of the method. It is shown that five seeds must be scanned before the perfect match seed is detected by the step-by-step scan method. In contrast, we only need to map two seeds before the detection of a perfect match seed using a proper grouping strategy.
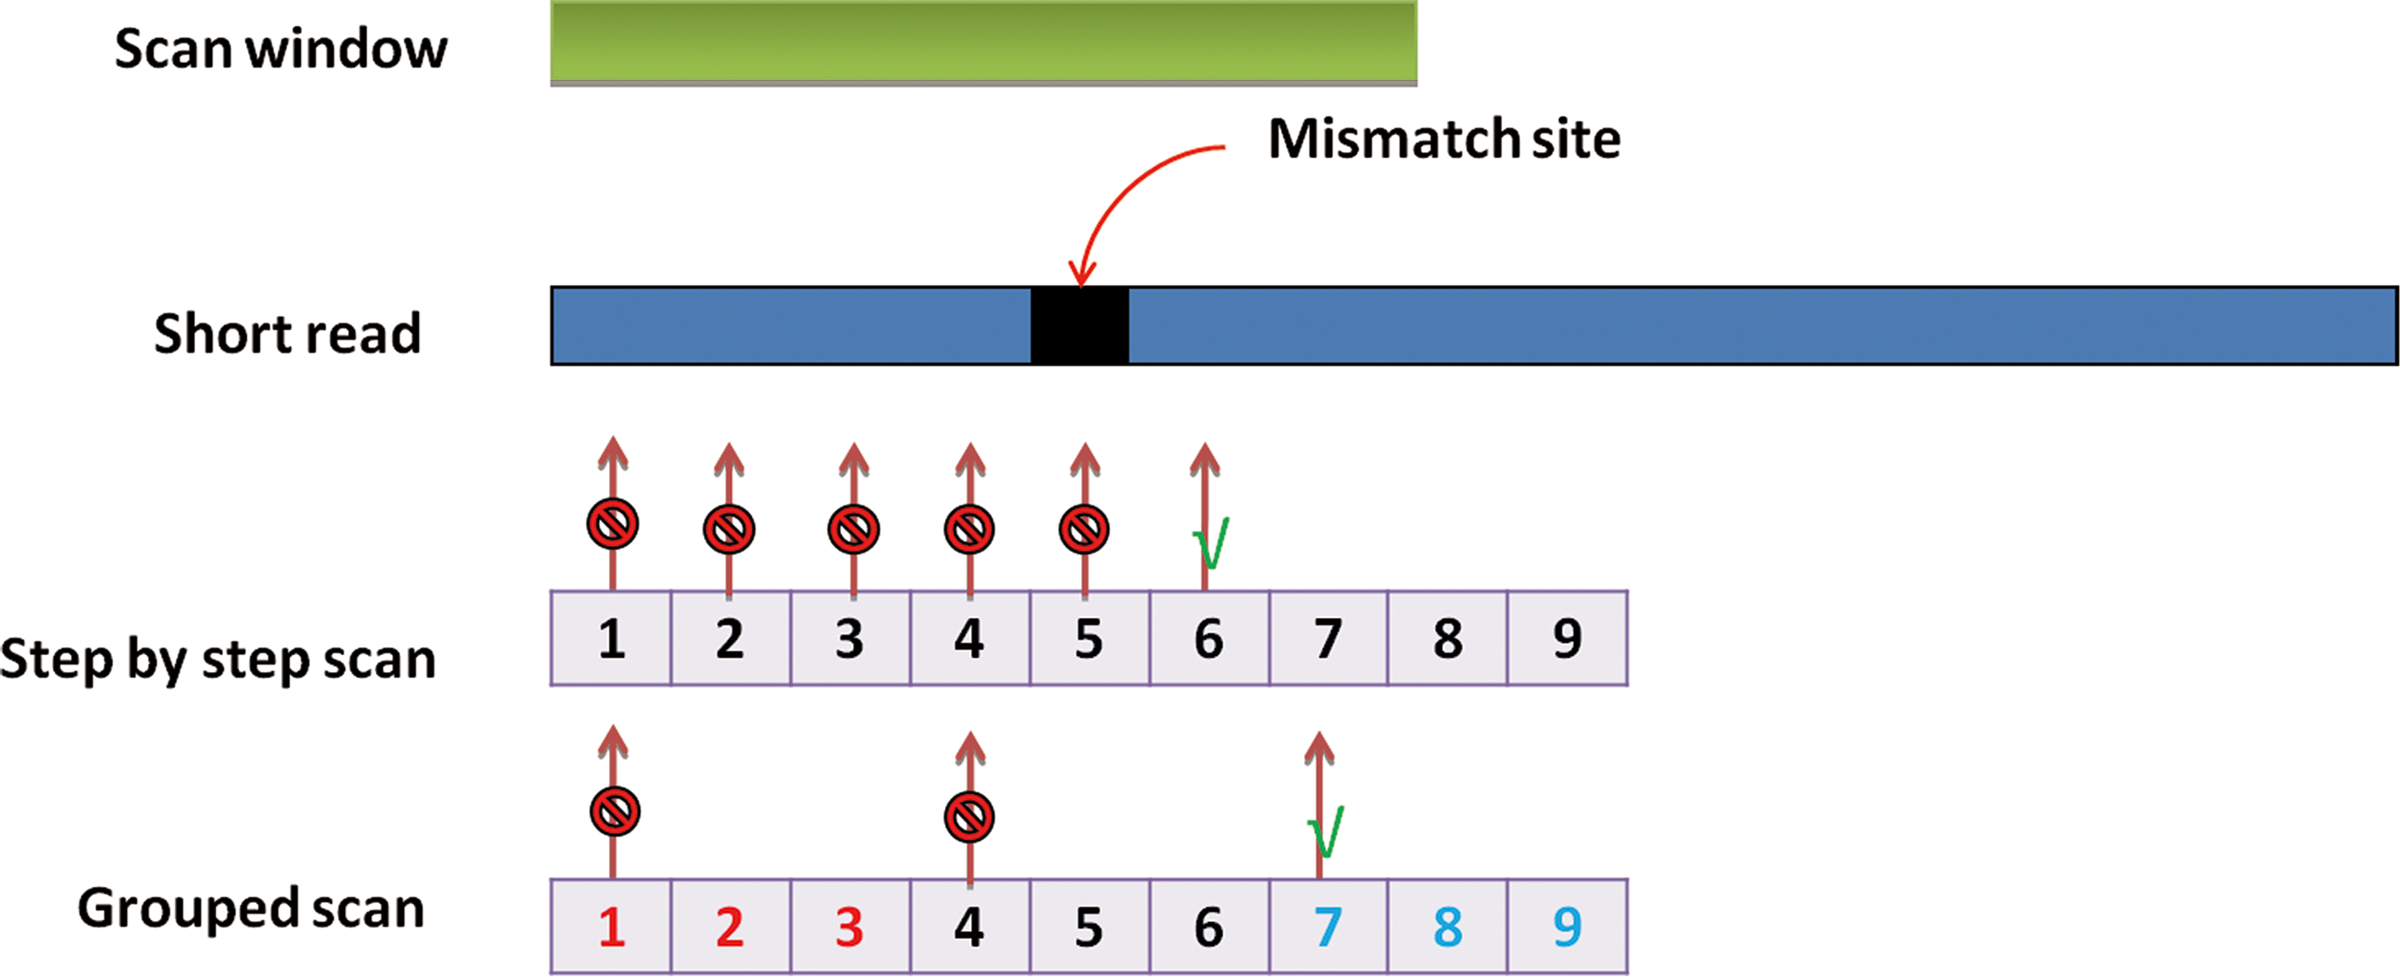
Illustration of the grouped scan method. The green bar shows the scope of a scan window from which a seed is extracted. The blue bar represents a short read, on which a mismatch is marked by a black square. If we scan the read nucleotide by nucleotide, we would go through five failed mappings marked in red before the successful mapping marked in green occurs. If we scan the read with jump 3, only two failed mappings occur before success.
The grouped scan strategy reduces the number of trial seeds in most occasions. In our experience, if a short read is mappable (can be mapped back if all seeds are scanned) then the number of trial seeds does not exceed a certain threshold in most cases. We could experiment with a small portion of the read data to set this threshold. The principle will be discussed in Section 2.4.
In addition to the scan order, seed length is another important factor we should consider. Later we will estimate the length interval, which meets both sensitivity and specificity requirements on the basis of a probabilistic model. Seed lengths near the upper bound of the interval give the best specificity while seed lengths near the lower bound give the best sensitivity. If we put specificity prior to sensitivity, at each scan position we can first map a seed at the upper bound and then map a seed at the lower bound.
2.3. Extension stage
In this stage, we detect the pattern, length, and position of a possible INDEL. The core of the method are the notions of auto-match vector and auto-match function, which we will define as follows.
Given two DNA segments denoted by S1 and S2, not necessarily of the same length, we define V(S1, S2) to be a vector whose i-th element is 0 if the i-th elements of S1 and S2 are the same and is 1 otherwise. The length of V(S1, S2) is the shorter one of S1 and S2. For any string S, denote the substring of S with the first i elements removed as S{i}.
We define match vectors as: M(0) = V(S1,S2); M(i) = V(S1{i},S2), for i > 0; M(-i) = V(S1,S2{i}), for i > 0 (Fig. 3). The auto-match vector w(i) of S1 and S2 is defined as: the i-th element of w(i) is the minimum of the i-th element of M(0) and M(i). Figure 4 illustrates how w(1) is obtained from M(0) and M(1). Finally, we define the auto-match function AMF(i) to be the number of 1's in the auto-match vector w(i). AMF(0) is simply the number of 1's in the match vector M(0).
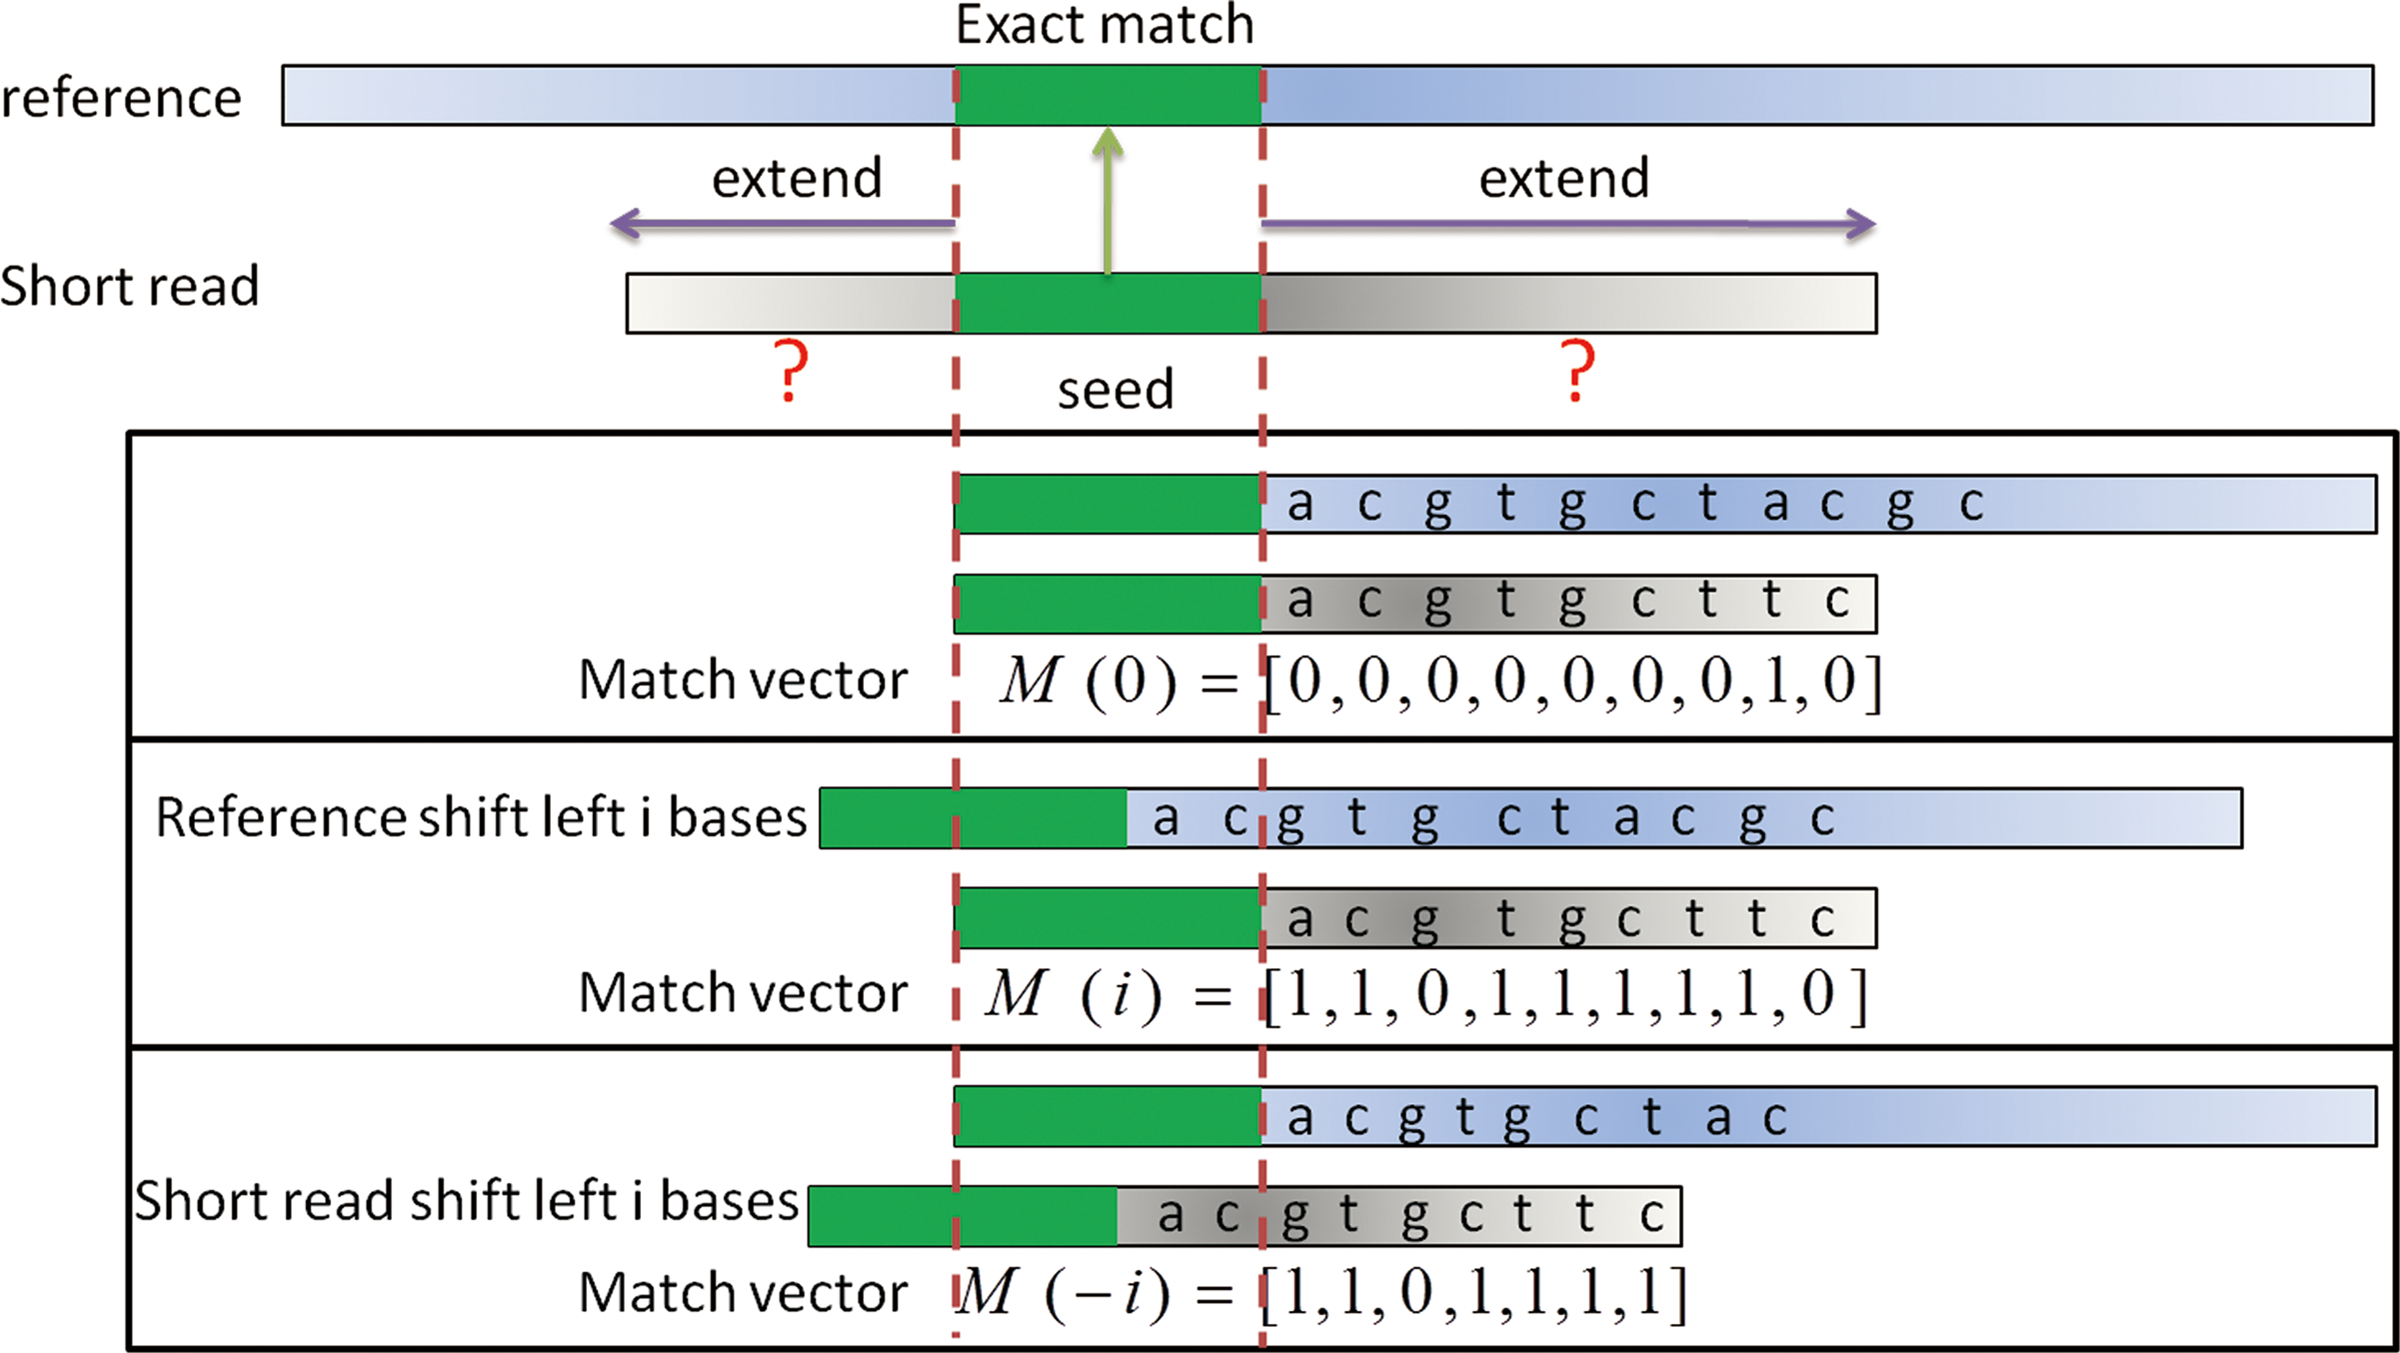
Illustration of the auto-match vectors during extension.

Detection of the position of a DELETION. A nucleotide “T” in green on the reference genome is deleted. In M(0), almost all elements before this nucleotide are 0 while almost all elements after it are 1. In M(1), the pattern is just the opposite.
With the help of auto-match function, we can detect the pattern and length of an INDEL. Figure 5 shows the case of a two-nucleotide deletion, in which AMF(i) is zero only for i = 2 while all other values are larger than five. We use this property to detect the pattern and length of an INDEL. Once the type and length of an INDEL is determined, we further use auto-match vectors to detect its position. The idea is illustrated in Figure 4, where we only consider M(1) because the AMF calculation indicates that a 1-nucleotide-deletion exists somewhere, and the purple boundary indicates the position of the deletion.
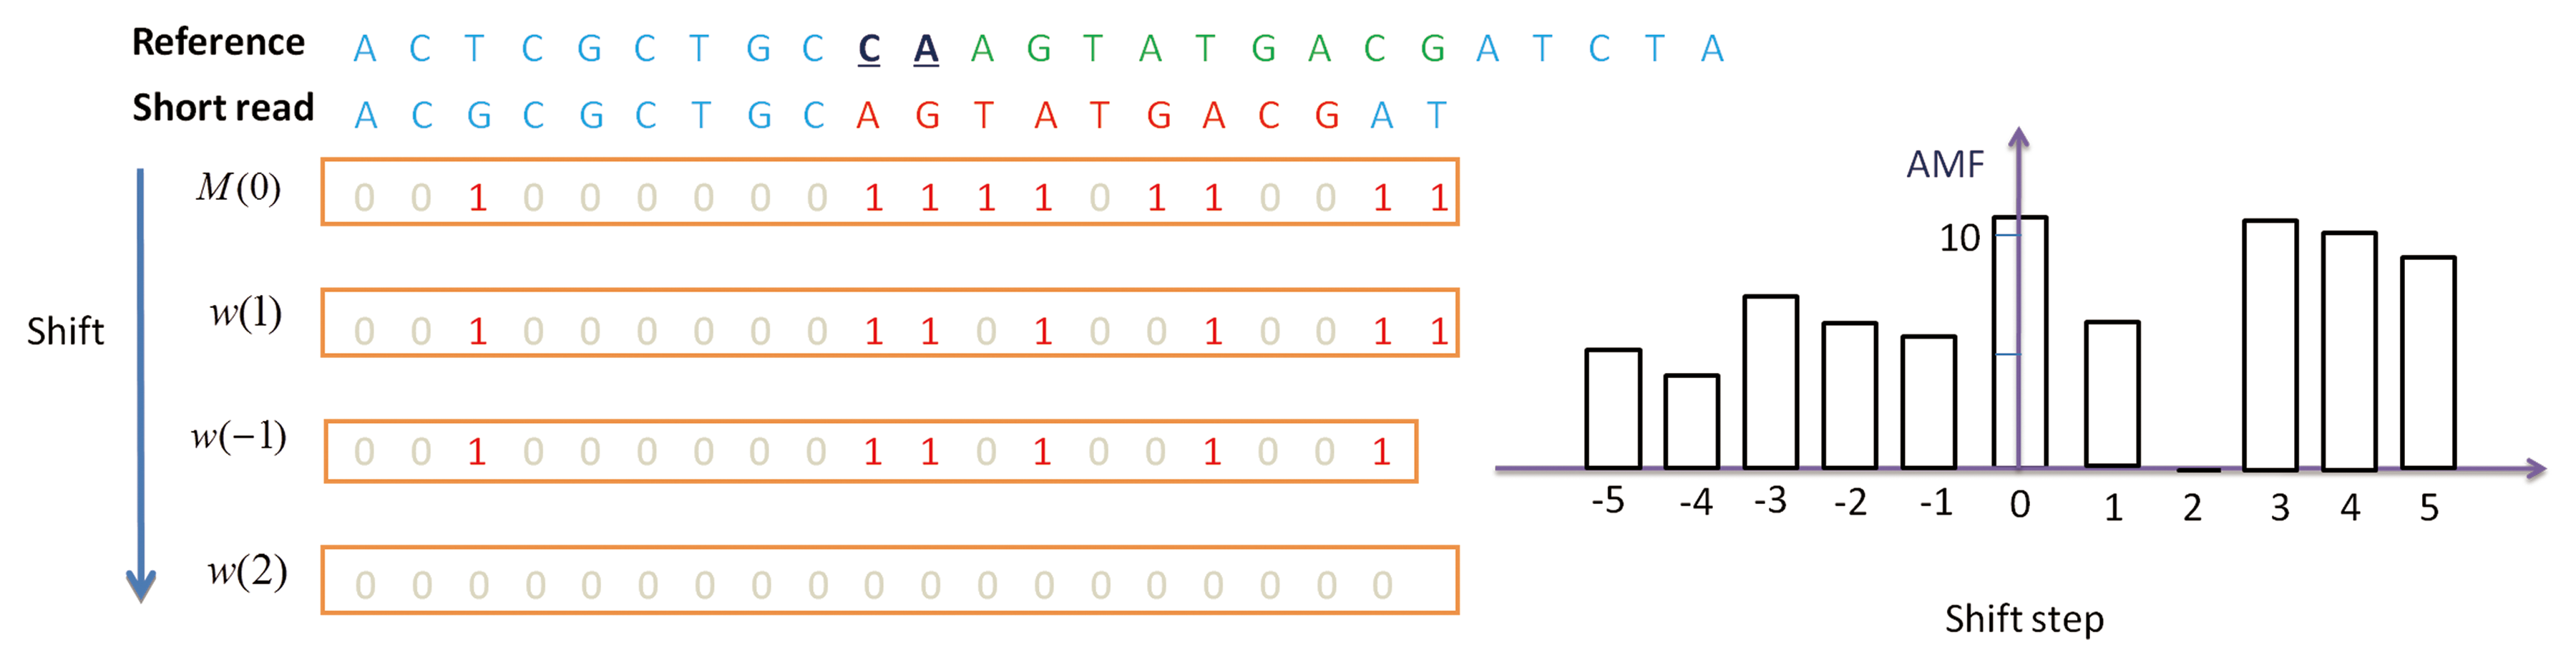
The pattern of AMF corresponding to a deletion of size 2.
Now we summarize the general AMF method as below.
For 100 bp resequencing reads of the human genome, only a tiny fraction can be anchored by a fairly large seed, say 32 bp, but could not be extended by the AMF method, and they are examined using the Smith–Waterman algorithm.
2.4. Computational complexity
Some notations and definitions that are necessary for the complexity evaluation are listed in Table 1.
We first consider those reads that can be mapped to the reference. Mapping such a short read is accomplished through: (i) finding a perfect match seed, (ii) detecting the INDEL length, and (iii) detecting the start position of the INDEL if its length is nonzero. Next we decompose the time spent on each part in details according to the algorithm.
The time spent on exact match is nsTmp_seed, where Tmp_seed varies depending on the algorithmic implementation and hardware. If we take the searching scheme described in Section 2.1, mapping a single seed has three steps: (i) obtaining a starting lower and upper bound in the index table for the seed using its block address; (ii) binary searching for the two adjacent 32-mers between which the seed can insert; and (iii) finding the maximum length of perfect match up to 32 nucleotide bases. In the first step, the integer corresponding to a 32-mer seed needs to be divided by 264−r, where r is the number of binary searches we would like to reduce. This can be achieved by 64 − r shift operations on the integer. In addition, two data access operations are required to get the two starting index bounds. The second step contains about (30 − r) data access operations and 30 − r integer comparisons. The third step can easily be implemented by shifting and comparing integers.
After finding a perfect match seed, we need to compute the values of AMF function to detect the possible “1-INDEL” length μ. First, the calculation of M(i) takes l, l, and l−|i| comparisons of nucleotide pairs between the read and reference respectively for i = 0, i > 0, and i < 0. Second, calculation of w(i) takes l and l − i comparisons of Boolean elements in M(0) and M(i) respectively for i > 0 and i < 0. Third, the calculation of AMF(i) takes roughly l integer additions. To detect an INDEL's start position, we can implement the third step of Algorithm 1 with the following time respectively for deletion and insertion:
Putting together and assuming we calculate AMF(i) in the order of
The first term is the complexity of mapping seeds; the second term is the complexity of the unsuccessful extension of those anchored seeds. The third termis the complexity of the successful extension of the final seed. Possibly ns includes the number of seeds that cannot be mapped anywhere, thus ns ≥ nw. Later we will show that the specificity goes up as the seed length goes up. When the specificity is sufficiently large, the chance of nw > 0 is small. For those reads that cannot be mapped to the reference, the third term is zero. So the time is
In our experience, for most of the mappable reads, the number of trial seeds is much smaller than the total number of seeds. If we set a threshold for the number of trial seeds then we avoid fruitlessly scanning. To set this threshold, we need to know the distribution of ns for the mappable reads. Let A(i) = #{ns(among mappable reads) = i}, namely, the number of reads that need i trial seeds till a successful mapping, 1 ≤ i ≤ (n − k + 1). Figure 6 shows the frequencies of A(i) for a 100K-short-read dataset. It is obvious that most of the mappable short reads are scanned only a few times. In fact, the 99% quantile of A(i) in this example is 11, and the average number of trial seeds, for all the short reads (including the unmapped reads) is only 2.9 for this dataset. This gives an estimate of E(ns) and it explains, at least from one angle, why the sequential seeding strategy is efficient compared with that of fixed-number seeding. The higher the quality of a read dataset is, the less the average number of trial seeds are needed.

Frequencies of ns for mappable reads. The y-axis shows log 10(A(i)). The results are obtained from 100K 76 bp short reads downloaded from the National Center for Biotechnology Information database, archive SRR003196. Among them 83K reads are mappable.
We also calculate the average length of INDELs in the example explained in the Introduction. It turns out that the average of μ is around 2.9. This means that on average, we only need to shift a short read rightward and leftward with respect to the reference three times.
3. Statistical Evaluation
In this section we evaluate the mapping accuracy of SEME based on probabilistic models. Several important statistical approaches have been developed for specific sequence alignment problems. For example, the statistic D2 (Lippert et al., 2002) concentrates on the number of k-mer perfect matches between two sequences of lengths m and n and evaluates its asymptotics when m and n go to infinity. The concept of excursion in random walks and some other advanced techniques in probability were used to evaluate the significance of BLAST (Ewens and Grant, 2001) results. In the current mapping problem, the read, say 100 bp, is much shorter than the reference genome. The asymptotics that require both m and n are sufficiently large do not apply. In order to evaluate the sensitivity and specificity of the SEME mapping result, we propose another approach, which essentially compares the n-length read with every n-length subsequence of the reference.
Suppose that the read length is n, and we define sensitivity as the probability that a read is mapped to where it is from, and specificity as the probability that the read does not map to any other positions—excluding repeats and possibly highly conserved homologs—on the reference. We approximate this event by any positions on a random reference of the same size. Let ν be the chance that the read is mapped to a random n-mer subsequence. According to subadditivity of probability
Corresponding to the two stages of SEME, we make the following decomposition:
where τ and r are respectively the probabilities of finding a k-mer perfect match between two n-length sequences under a correct location and a random location. θ and θ* are respectively the conditional probabilities of accepting extension under a correct location and a random situation. Assuming that the n positions are independent and the match rate is constant, we calculate τ and η precisely, and the result is accurate no matter what the read length is. θ is obtained by a soft counting method, which calculates the probability of the extension based on the distribution of the imputed “possible polymorphism” numbers that aim to adjust the effect of base-calling errors.
In fact, τ(k, p) increases with p and decreases with k.
We first apply this lemma to the calculation of τ = τ(k; p), where p is the matching rate between a read and the region where it is from, and it depends on the polymorphism rate and sequencing error rate. Let X, Y, S represent the reference, individual genome, and short read respectively. It can be shown that the mismatch rate at the site (Xi, Yi, Si) is (1 − β i )γ + (1 − γ)β i + γβ i w i , where γ = Pr(Xi ≠ Yi) is the polymorphism rate or simply the SNP rate if we skip the INDEL for the moment; and βi = Pr(Yi ≠ Si) the miscall rate; wi = Pr(Si ≠ Xi|Yi ≠ Si, Yi ≠ Xi). We note that in this context we use the jargon “polymorphism rate” γ as a measure of genomic discrepancies between the target individual and the reference, but not as a measure of population genetics. Since γβi is small, we have the approximation to the match probability: pi ≈ 1 − γ − βi. For the moment, we replace βi by their average. We show the curves of τ under different settings in Figure 7a. For example, the green solid line corresponds to the case of 100 bp reads with a 0.99 match rate. In this case, the sensitivity is satisfactory even when k = 30.
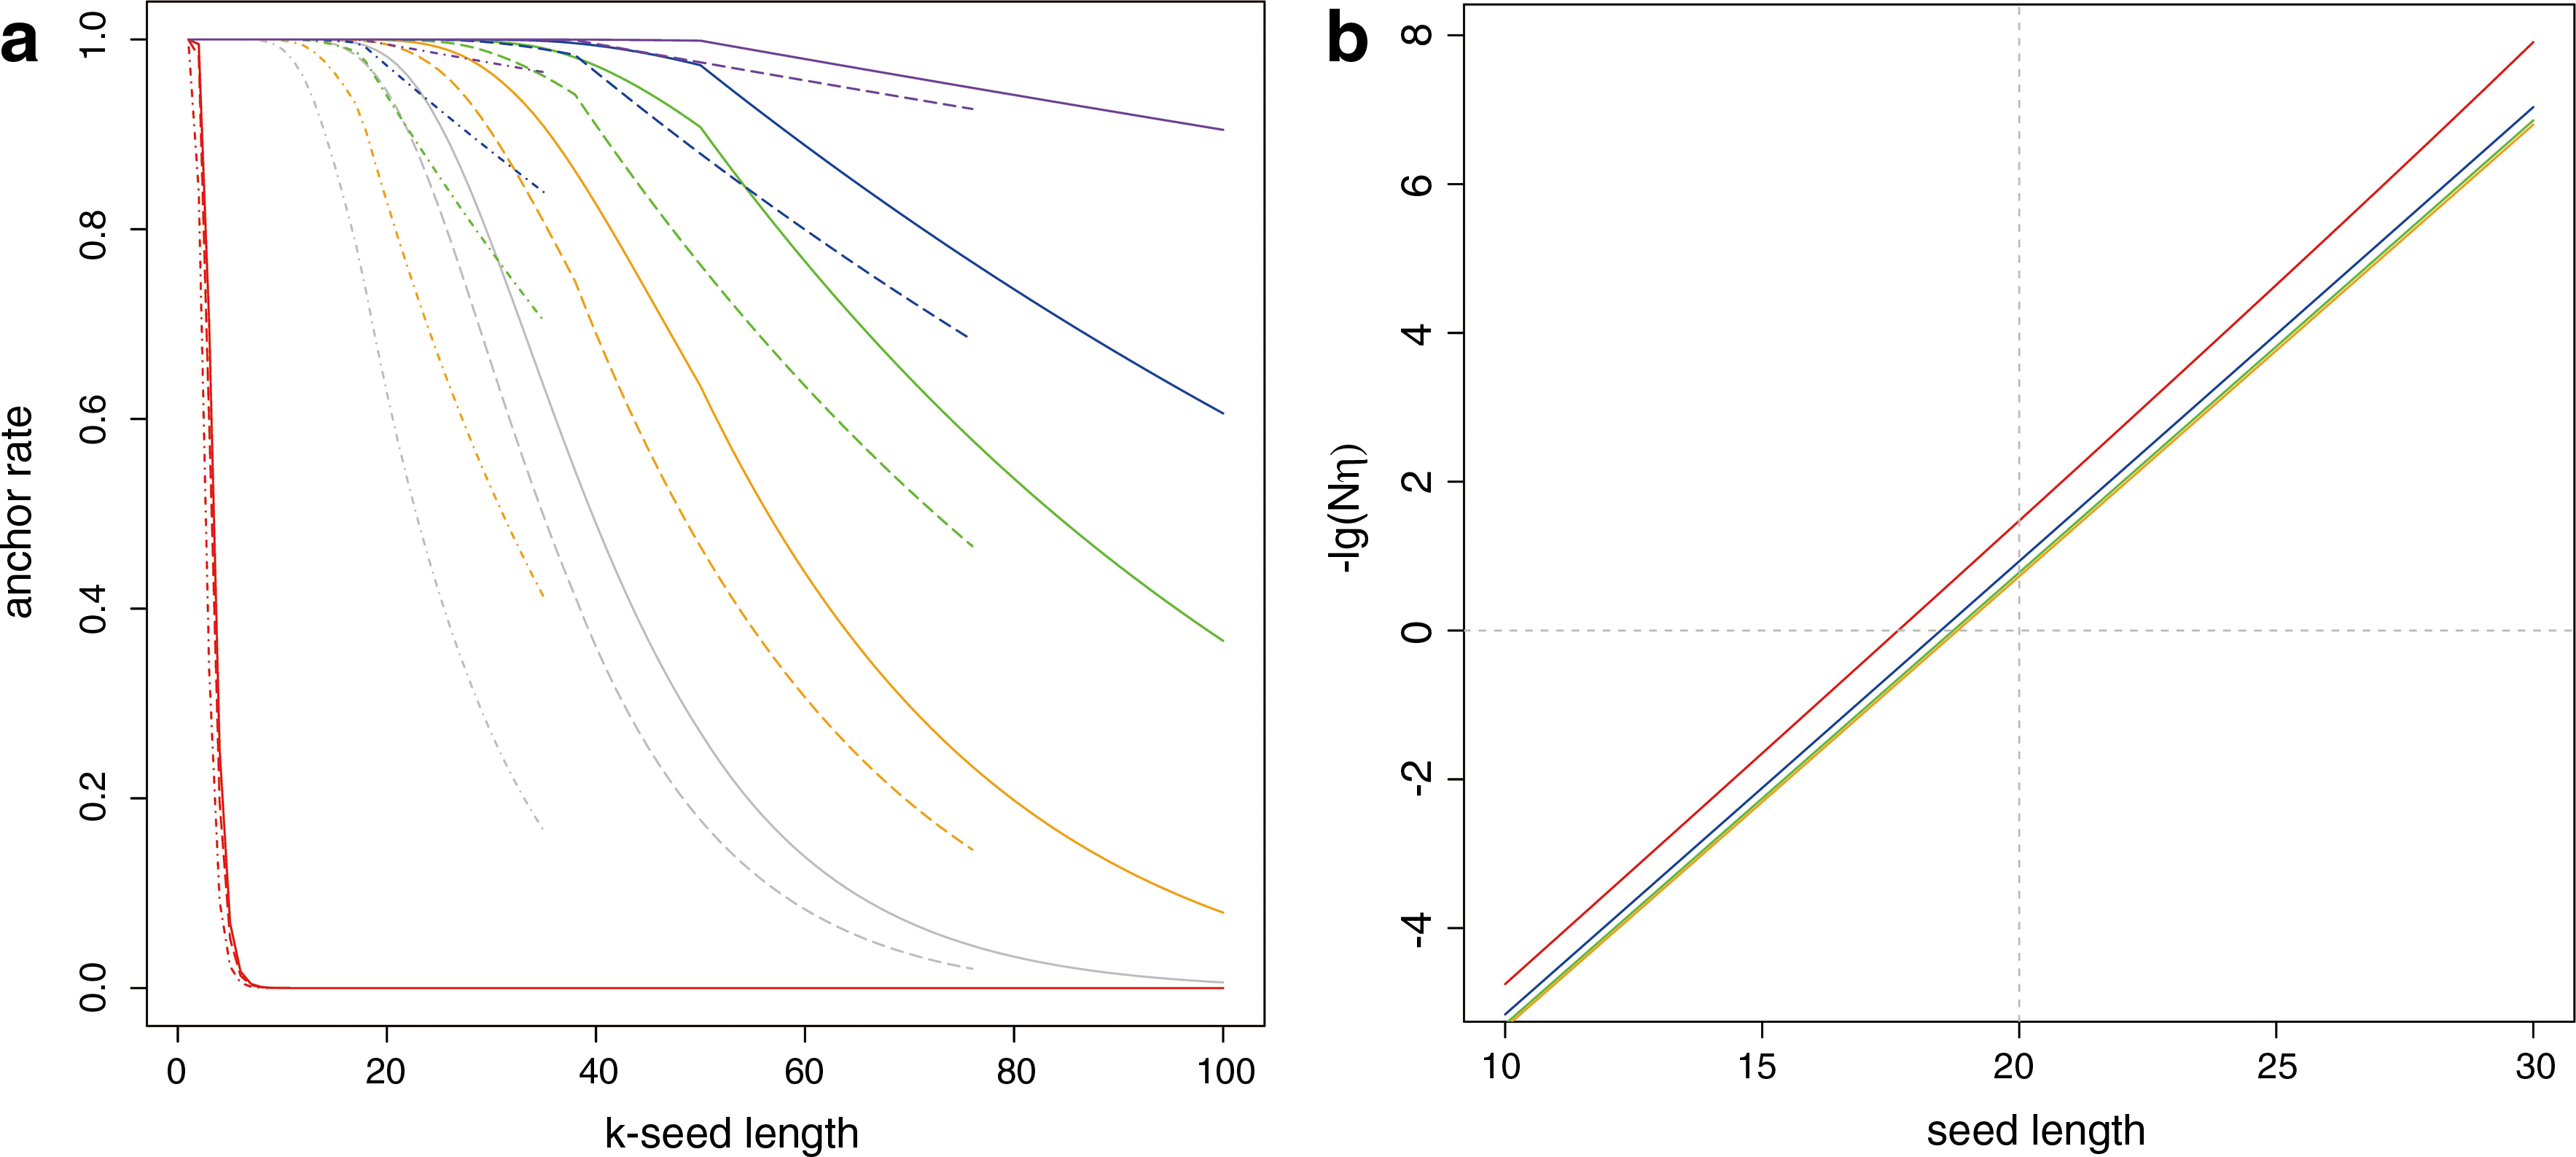
Next we apply the lemma to the random situation. In η = τ(k; pη), we set the match rate pη as the sum of the squares of the base composition rates (usually around 0.25). In Figure 7a, the red line, representing the trend of η, drops to zero quickly even when the seed is short, and to some extent it displays the specificity of SEME.
3.1. Soft counting criterion
The extension stage validates the anchor position by checking the number of inconsistencies between the reference and the read. For now, we simply exclude INDEL positions. MAQ (Li et al., 2008a) evaluates a mapping result by calculating the posterior probability that the read comes from the region, and it regards the hit with the highest posterior as the correct result. The posterior can be maximized effectively by minimizing the sum of quality values of mismatched bases. We note that mismatches could be caused by miscalls as well as polymorphisms, and base-calling errors are not strong evidence of incorrect mapping. Instead of hard counting of mismatches, we propose a soft-counting method that imputes the “possible polymorphism” fractions from all mismatch sites using quality values and an appropriate polymorphism rate, aiming at reducing the effect of miscalls on mismatch sites. Consequently, we evaluate the mapping result based on the sum of the imputed “possible polymorphism” fractions. Specifically, according to the setup above, the mismatch rate is 1 − pi = (1 − βi)γ + βi[(1 − γ) + γwi]. We impute the “possible polymorphism” fractions at mismatch sites as
which can well be approximated by
Under the assumption of independence, its distribution is binomial (n − k,γ). Consequently, we can convert the statistic score of an alignment into a p-value. In this case, the larger the p-value, the stronger evidence of accepting the mapping.
Since the seed and extension part do not overlap, we can regard them as approximately independent. θ is the type one error probability of the associated test of the hypothesis: the anchor is correct. We can set the significance level α of this test to ensure a reasonable sensitivity. In fact, τ(1 − α) is an upper bound for the sensitivity of SEME. The curves in Figure 7a show the sensitivity excluding the factor (1 − α) under different settings and can serve as a guidance for seed length selection.
We can similarly calculate the sum of inconsistencies of an extension alignment under the random sequence assumption, and its asymptotic distribution is normal. The chance that we accept an incorrect anchor should be small as validated by our simulations. Essentially 1 − θ* is the power of the associated test. For the moment, we use Nη as a conservative bound of specificity when choosing seed length. As a matter of fact, Nη is also the average number of anchor places across the whole genome by chance. The curves of −lg(Nη) with respect to seed length are shown in Figure 7b.
3.2. Seed length determination
The seed length selection is a trade-off between sensitivity and specificity. Shorter seeds increase sensitivity but may lead to many incorrect anchor places; longer seeds increase specificity, but the seed may be mapped nowhere. To ensure both of them, the seed length should be in a proper range.
According to Figure 7b, the curves corresponding to different read lengths are close to each other, especially as the size is larger than 76 bp. Only when the seed length is chosen to be at least 19 or 20, the average number of anchor positions by chance would be smaller than 1. If we would ensure specificity larger than 0.999, the lower bound should be up to 24 or 25. Of course, this estimate might be conservative because Nη is a conservative bound of specificity. On the other hand, slightly larger lower bound can help avoid false positive anchors, which are expected to be rejected in the extension stage. The upper bound is chosen according to the sensitivity curve and our tolerance. For 100 bp reads with an average 0.99 match rate, [20, 32] is a proper range of seed length. In practice, the binary search algorithm simply finds the maximum exact match length up to 32 nucleotides for each seed. If it is above 20, we then evaluate the significance based on this exact match length.
Figure 8 shows the detailed relationship between sensitivity and match rate for different read lengths, where the anchor rate is represented as τ in Equation (5). The sensitivity of the seed step is represented by the bar heights. For example, a value of 2 corresponds to the 99% sensitivity. The read lengths of 35 bp, 76 bp, and 100 bp are shown along the x-axes. The match rates of 0.95, 0.975, 0.99, 0.995, and 0.999 are marked in colors shown on the right. The sensitivity values in the the 32-mer-seed case are lower than those in the 20-mer-seed case. Let us first look at the 20-mer-seed case. For 35 bp reads to achieve sensitivity larger than 99%, the mismatch rate has to be around 0.1%; while for 76 bp reads, a mismatch rate around 2.5% is sufficient for achieving the 99% sensitivity. This is the reason why in the early days of NGS, the strategy of using a single perfect match seed did not work while it is feasible nowadays as the read length and sequencing quality improves.

The sensitivity of the seed step − lg(1 − anchor rate) versus read length and match rate for the 20-mer seed
4. Simulations And Results
In addition to the theoretical analysis, we did a simulation study of SEME's accuracy, which is the composite effect of several factors such as polymorphism rates and patterns, miscall rates, seed lengths, number of mismatches allowed, and number of places allowed to be mapped. We only show results for a few combinations of these parameters. We take the human genome hg18 as the template and randomly generate SNPs and INDELs according to the rate 0.1% and 0.01% respectively. From the simulated genome, we generate one million 100 bp reads using different miscall rates. The simulated reads are then mapped to the reference genome hg18. The reads with low entropy are filtered out before mapping. To be simple, we use hard count criterion to evaluate mapping results. The mapping tool SEME must specify the two factors: mismatch threshold and seed length. We consider two levels for mismatch threshold: 5 and 2; and three levels for seed length: 20, 22, and 25, which are shown in the second and third column. Each read is allowed to be mapped to at most five places. The mapping results are considered to be correct if the read is exactly from one of the mapping places. We break the mappable reads into two categories: single and multiple locations. The error rate is the percentage of incorrectly mapped reads among all the mappable reads. In the last column, we show the mapping speed of each scheme.
Table 2 shows the mapping results for all the 18 combinations of parameters: miscall rate, seed length, and mismatch number threshold. For fixed miscall rates and mismatch thresholds, as the seed length gets longer in the range of [20,25], both the map rate and the error rate decrease, but only slightly. When the miscall rate is 1%, both the map and error rate drop substantially when we switch the criterion from 5 to 2 mismatches. As the miscall rate reduces, the map rate and error rate still decrease when we switch the criterion from 5 to 2 mismatches, but the degree of decrement becomes less and less. We note that when the less stringent criterion, 5 mismatches, is used, the single map rate increases as the miscall rate goes from 0.1% to 1%. This phenomenon is caused by the increasing false positive error rates in the single mapping cases. In the case of the 0.1% miscall rate, the mapping speed almost doubles when we switch the criterion from 5 to 2 mismatches.
We report comparisons of SEME with Bowtie2 (Version 2.0.0-beta7) and SOAP2 (Li et al., 2008b; Li et al., 2009) on three datasets from the National Center for Biotechnology Information (NCBI) database, each of which includes 2 million reads. To make fair comparisons, we implement SEME by mimicing the parameters in the “–sensitivity” mode for Bowtie2 and ‘-v4’ mode for SOAP2 respectively. In our examples, the reference genome is the human genome hg18.
Mapping rates and time are two key measures for evaluating read mappers. We show the comparison of Bowtie2 and SEME on the left in Table 3. For dataset 1, the running time of SEME reduces to about 1–5, whereas the mapping rate of SEME is 13.4 (86.8–73.4)% higher than that of Bowtie2. Comparing with dataset 1, the running time of Bowtie2 for dataset 2 is a little more while that of SEME reduces further by 40%. This phenomenon is due to the fact that the number of Bowtie2's trial seeds is fixed for each short read while that of SEME mainly depends on the quality of each short read, that is, better quality, less trial seeds. Notice that the read lengths of dataset 1 and 2 are about the same, and the quality of the latter is better. From dataset 2 to 3, the read length extends to 100, whereas the quality are similar. We can see that the mapping time of Bowtie2 increases, but SEME remains about the same, which verifies our analysis. In the third example, SEME is more than 10 times as fast as Bowtie2.
n is the read length of each dataset. The three datasets are from NCBI database, namely, short read archives SRR003196, SRR033622, and SRR054721. They are all generated by the Illumina Platform. Each dataset contains two million short reads. Left: comparison with Bowtie2; right: comparison with SOAP2.
We show the comparisons of SOAP2 and SEME on the right in Table 3. Since the “-v4” mode allows only 4 mismatches, mapping rates of both SOAP2 and SEME for all three datasets are lower than those in the comparison with Bowtie2. Not only does the running time of SEME reduce to about one third, it also has a 4–8% gain in mapping rates.
We test SEME's performance on a larger dataset, SRR345300, which is also generated by the Illumina Platform and contains around 81 million reads. We map them using SEME by mimicing the parameters in the “–sensitivity” mode of Bowtie2 and in the “-v4” mode of SOAP2 respectively. The seed length of perfect match is set to be no smaller than 20 in SEME. The upper bound of seed trials in SEME is set as 26 and 5 respectively when it is compared with Bowtie2 and SOAP2. We show the comparisons of SEME with Bowtie2 and SOAP2 in Table 4 respectively. The mapping time is about 10 hours for Bowtie2 while it is only 51 minutes for SEME, meaning SEME is nearly 12 times as fast as Bowtie2. Moreover, the mapping rate of SEME is also significantly higher than that of Bowtie2. In comparison with SOAP2, SEME runs about 2.5 times as fast with 6.4% gain in mapping rate.
In the comparison with SOAP2, we use hard count criterion to evaluate each map result in SEME, and the upper bound of mismatch number is set as 4, which is similar to “-v4” mode in SOAP2.
In summary compared with Bowtie2, SEME runs 5–13 times faster depending on the quality of datasets; Compared with SOAP2, SEME runs 2–3 times faster while the mapping rate of SEME is substantially higher.
5. Discussion
SEME has two key features. The first one is its novel mapping algorithm, which obeys the “seed-and-extend” paradigm. A common approach of the seed stage is to map multiple seeds at the same time and then make them into full alignments. The number of these multiple seeds is usually fixed from read to read. Different from this approach, SEME maps seeds sequentially. The number of seeds that needs to be mapped depends on the distribution of mismatch sites on the short read. The scan function of SEME efficiently minimizes the average number of trial seeds. In the extension stage, SEME can detect the pattern, position, and length of small INDELs by means of auto-match function and auto-match vectors without enumerating all possible combinations or carrying out local alignment algorithms. Time complexity of the extension stage is linear with respect to the read length. In the extension stage, we can even find two INDELs if they locate at two sides of the perfect match seed.
The second feature is that SEME has its own statistical evaluation of mapping reliability, which is critical for NGS, especially its applications to medicine. Compared to the vast amount of algorithmic development, not much associated statistics was found in the literature so far. A statistical evaluation of a mapping result is justifiable only if the model on which the analysis is based captures the data characteristics and follows the mapping algorithm closely. Our statistical analysis of the “seed-and-extend” scheme essentially boils down the evaluation of specificity and sensitivity to the matching chance of two n-length sequences, where n is the short read length. We decompose the probabilities into two parts: one corresponds to the seed stage and the other corresponds to the extension stage. Since we stick to the perfect match in the seed stage, the calculation of the exact probability is relatively easy (see Lemma). In the extension stage, the sum of “possible polymorphism” fractions can approximately be described by either a binomial or a normal distribution.
The random sequence assumption is definitely far from a perfect description of any common natural genome because it ignores more complicated issues such as duplications and homologs. Appropriate simulations may complement the model-based analysis to some extent. We carried out limited simulations, and the results are quite comparable with the analytical results in terms of the values of τ and r in Equation (5).
SEME is very flexible due to its data structure and sequential scan strategy. Depending on the mapping context, the condition of the short reads and the requirement of the mapping result, we can adjust the seed length, the scan scheme, and the upper bound of trial seeds. The optimization of the scan scheme depends on several factors, such as the sequencing quality patterns, and we are conducting more investigations.
When optimizing the parameter values in SEME, we take both statistical accuracy and computational efficiency into account, although the former is our primary target. For reads with lower quality, we can take a shorter seed to ensure sensitivity first, and this may lead to more mapping places. Correspondingly, in the extension step, we impose a more stringent criterion to ensure specificity. For reads with higher quality, we can take a longer seed to improve specificity and accordingly take a less stringent acceptance criterion for higher sensitivity. Currently, we find that the seed stage is computationally more intensive than the extension stage.
We implement the method in C++ and developed a single thread version, which was used in the examples and simulation. We would like to send it to academic users upon request. Currently, we are attempting to develop a parallel version.
Other than the straightforward mapping problem, we did not elaborate on SEME's variants on which we are working. For example, by encoding and decoding “C” and “T” with a common letter, we can use SEME to map short reads and allow methylation sites. However, with this setup—the values of sensitivity and specificity—the seed length must be re-evaluated. For pair-end data, we can first map the two reads of a pair by SEME independently. If multiple mapping locations occur, we pick up the pair of genomic coordinates that best match a priori on their relative genomic coordinates. If inconsistency occurs, we make corrections based on the false positive and false negative probabilities of the two reads. How to integrate information from both ends to speed up mapping is an interesting problem to consider. The detection of alternative splicing sites inside a single seed is a more challenging task. As the Illumina read length goes beyond 160 bp, the ideas of SEME described in this report may help solve the problem. Particularly, we emphasize that the statistical evaluation is important for justifying the significance of any new genomic discovery.
Footnotes
Acknowledgments
We thank Drs. Yong Zhang and Zhixiang Yan from BGI-Shenzhen for their help. We thank Bo Wang and Lixian Yang for their assistance in programming. This work was supported by the National Center for Mathematics and Interdisciplinary Sciences, Chinese Academy of Sciences (CAS); the Program of “One hundred talented people,” CAS; and grant 91130008 from the Chinese National Science Foundation.
Author Disclosure Statement
No competing financial interests exist.