




Abstract
Abstract
Next-generation sequencing techniques are now commonly used to characterize structural variations (SVs) in population genomics and elucidate their associations with phenotypes. Many of the computational tools developed for detecting structural variations work by mapping paired-end reads to a reference genome and identifying the discordant read-pairs whose mapped loci in the reference genome deviate from the expected insert size and orientation. However, repetitive regions in the reference genome represent a major challenge in SV detection, because the paired-end reads from these regions may be mapped to multiple loci in the reference genome, resulting in spuriously discordant read-pairs. To address this issue, we have developed an algorithmic approach for read mapping and SV detection based on the framework of A-Bruijn graphs. Instead of mapping reads to a linear sequence of the reference genome, we propose to map reads onto the A-Bruijn graph constructed from the reference genome in which all instances of the same repeat are collapsed into a single edge. As a result, any given read, either from repetitive regions or not, will be mapped to a unique location in the A-Bruijn graph, and each discordant read-pair in the A-Bruijn graph indicates a potentially true SV event. We also developed a simple clustering algorithm to derive valid clusters of these discordant read-pairs, each supporting a different SV event. Finally, we demonstrate the performance of this approach, compared to existing approaches, by identifying transposition events of insertion sequence (IS) elements, a class of simple mobile genetic elements (MGEs), in E. coli by using simulated and real paired-end sequence data acquired from E. coli mutation accumulation lines.
1. Introduction
D
The rapid progress of next-generation sequencing techniques with massive throughput and exceedingly low cost has enabled the large-scale sequencing of many individuals in a population, and relevant computational approaches (Medvedev et al., 2009; Alkan et al., 2011) have fueled the characterization of SVs from such data. Although it is not entirely necessary, current SV detection tools—such as BreakDancer (Chen et al., 2009), MoDIL (Lee et al., 2009), GASV (Sindi et al., 2009), PEMer (Korbel et al., 2009), Hydra-SV (Quinlan et al., 2010), and VariationHunter (Hormozdiari et al., 2009, 2010)—predominantly rely on paired-end reads. When mapped to a reference genome, the read-pairs whose insert size or orientation deviates from the expected insert size or orientation (often referred to as discordant read-pairs) indicate potential SV events (Raphael et al., 2003; Tuzun et al., 2005), serving as decisive clues to identifying SVs in the donor genomes from which the read-pairs were acquired.
Complications rise when repetitive regions are present in the reference genome, such as mobile genetic elements (MGEs), because reads from repetitive regions can be mapped to multiple locations that are indistinguishable from their alignment similarity; as a result, a single read-pair with such multiply mapped reads will map to multiple alignment loci, making the mapped read-pairs challenging or even impossible to interpret. Instead of resolving such tangled mapping results, many SV detection tools (e.g., PEMer and BreakDancer, classified as the standard methods in Medvedev et al., 2009) simply ignore multiply mapped reads, potentially missing the movement of MGEs or complex SVs involving such elements—which are often important SV events. VariationHunter (Hormozdiari et al., 2009, 2010) and MoDIL (Lee et al., 2009) represent a class of tools that considers multiply mapped reads (referred to as the soft methods in Medvedev et al., 2009) and all their mapped loci, and uses optimization algorithms to cluster all read-pairs such that each discordant read-pair is assigned to a cluster that consists of just the reads that likely resulted from a particular SV event. But because some read-pairs may map to many loci (e.g., for reads from MGEs, the number of mapped loci is dependent on the copy number of MGEs), the clustering problem is often reduced to a hard computational problem with a large scale of input and thus can only be solved by approximation algorithms (e.g., the algorithm used in VariationHunter that solves the minimum set cover problem).
We argue that it is not necessary to consider all mapped loci of a read-pair in SV detection, because multiply mapped loci are largely an artifact arising from the presence of repeats in the reference genome. In fact, if we know the repeat structure of the reference genome a priori, all mapped loci of a read r in the reference genome S can be predicted based on any single mapped locus of r. Below we illustrate this concept by using the framework of A-Bruijn graphs (Pevzner et al., 2004), in which the repeat structure of the genome is represented in a graph and all copies of each repeat are collapsed into a contiguous edge. Let r be a repeat that is found in c distinct locations in a reference genomic sequence S and let Map(r) be a function that outputs a set of all locations where r is found in S. Then the size of the set returned by Map(r) is precisely c. Now let Map′(r) be a function that outputs a set of all locations of r found on the A-Bruijn graph of S. Because all the repeats of the same kind have been represented as a single edge, Map′(r) outputs a singleton set. In other words, given the A-Bruijn graph constructed from a string (i.e., the reference genome) and a set of substrings (i.e., the reads) of the given string, each substring will have exactly one mapping location on the A-Bruijn graph. In practice, however, a read may contain sequencing errors so that it is not identical to the substring of S; thus, we need to modify the definition of repeats accordingly when classifying them in the reference genome. Nevertheless, as we show in this article, after incorporating the modifications, we can still ensure that each read sampled from repetitive regions should be uniquely mapped to the A-Bruijn graph of S. The advantage of using the concept of A-Bruijn graphs in detecting SVs involving repetitive regions is two-fold. First, read mapping to multiple copies of repetitive regions can be avoided. And more importantly, because each read has only a unique mapped location on the graph, the set of discordant read-pairs can be easily defined, and its size is much smaller than that defined using all the loci of the multiply mapped reads in the reference genome (Fig. 1). As a result, the clustering of discordant read-pairs becomes much easier.

A donor genome (i) with an extra insertion of a repetitive element R in the region E—when compared to the reference genome (ii)—is depicted. A set of reads are sampled from the donor genome, and those reads that span the boundary of repetitive element R present in the reference genome are shown on the top of the donor genome. The read-pairs are numbered from 1 to 8. Although there is a single, structural variation (SV) event, that is, an insertion of the repeat element in the donor genome, read mapping results in numerous discordant read-pairs—denoted by red and blue dotted arcs, where red indicates spurious discordant mappings and blue indicates true discordant mappings. The reference genome is represented as the A-bruijn graph (iii). Upon mapping the reads onto the graph, it is clear that reads 1 through 6 map concordantly on the graph, and only the two read-pairs that are involved with the insertion (i.e., 7 and 8) map discordantly to the graph.
The rest of the article is organized as follows. We first show that when reads are error-free, each read has a unique mapping location on the A-Bruijn graph constructed from the reference genome, regardless of whether or not it is drawn from unique or repetitive regions. Then we show that this result holds true when reads contain a few errors, with a slight modification in the construction procedure for the A-Bruijn graph. Next, we present a clustering algorithm of discordant read-pairs detected in the A-Bruijn graph, which is simplified from the commonly used algorithm for clustering multiply mapped loci in the original genome. Finally, we demonstrate the performance of our approach for detecting SVs by using a case study that identifies transposition events of insertion sequence (IS) elements (Mahillon and Chandler, 1998), a class of simple mobile genetic elements, in E. coli, from (i) simulated data, to compare the performance with that of other approaches; and (ii) the paired-end sequencing of the genomes of E. coli strains grown using a mutation accumulation (MA) strategy (Lee et al., 2012a). The abstract of this work was presented at the eighth International Society for Computational Biology Student Council Symposium 2012 and published (Lee et al., 2012b).
2. A-Bruijn Graphs and Structural Variation Detection
2.1. Al-Bruijn graphs
In this section, we first define the Al-Bruijn graph within the framework of the A-Bruijn graph (Pevzner et al., 2004). The A-Bruijn graph is initially constructed based on a binary n × n similarity matrix A = {aij} representing the set
Because an edge can be visited multiple times during the traversal, an edge can correspond to a set of segments in S,
2.2. Mapping reads onto Al-Bruijn graphs
Given the Al-Bruijn graph G(S,l) built from a genome S, we call a read (string) r as mapped to a position gp = (ei,p) in G(S,l) if r is a substring of S at position j, and gp = GraphPos(j) [or equivalently,
2.3. Identifying discordant read-pairs in G(S,l)
A pair of mapped loci (sl, sr) of a read-pair (rl, rr), where sl and sr are mapped loci on linear reference of the reads rl and rr, respectively, is called concordant (Tuzun et al., 2005) if the distance between the loci (i.e., sr−sl + 1) falls within the expected range of the insert size of the read-pair, and the reads are mapped in opposite orientations as expected. 2 A read-pair without a concordant mapping is referred to as discordant (Tuzun et al., 2005). Because of the presence of multiply mapped reads, in order to determine if a read-pair is discordant or not, using a naive approach, one has to search through all pairs of mapped loci to check if there is at least one concordant pair. On the Al-Bruijn graph, to the contrary, each read (if mappable to the genome) has a unique mapping position—effectively collapsed to a single position, it is only necessary to check a single pair of mapped positions to determine whether a read-pair is discordant or not.
In practice, we identify discordant read-pairs by traversing the Al-Bruijn graph G following the thread T of the genome S. In order to keep track of how many times each edge has been visited while traversing the thread, we add a counter eci (eci ≤ mi) with its initial value set to 0 to each edge
We start from a list D of all mapped read-pairs and then remove all read-pairs that are determined as concordant while traversing the graph (Algorithm 1). To enable fast checking of read-pair concordance, we keep track of all forward-mapping instances of a single read. During the traversal, upon encountering a read r, we retrieve the list L from a lookup table of sorted lists, where L stores the positions of recently visited mapping instances of r that is within MAXD—the maximum distance of the insert size. If there is no such list in the lookup table, we create an empty list L. If the current mapping instance of r is in the same direction as the thread, we simply remove any mapping instances that are farther than MAXD from the current position and then insert the current positional value pos = Poseci(gp) to L (Algorithm 2) while keeping L as a sorted list. Note that when a pos is added, it will always have a greater value than the previously added entries, because we traverse the graph in the same direction of the thread T. If the current mapping instance is in the opposite direction of the thread, we simply check whether there is a pairing instance in the list that makes them a concordant pair (Algorithm 3). If a concordant pairing is found, we remove the read-pair from D and G. When the traversal is complete, the list D is left with only discordant read-pairs. We note that the two loops in Algorithm 1 traverse the Al-Bruijn graph G following the thread T, and thus during the process, each position in the genome S is visited once and only once. In the meantime, it takes O(log|L|) time to update a sorted list L of |L| read positions. Therefore, the computation complexity of the whole algorithm is O(|S|logM), where |S| is the genome size and M is the maximum multiplicity of repeats in the genome.
Although the presence of discordant mappings indicates potential SV events, it is important to note that discordant mappings can result from non-SV events. Repeats in a reference genome can induce discordant mappings that can potentially lead to false SV events reported by SV detection tools. We emphasize that these repeat-induced discordant mappings are collapsed as a concordant mapping when reads are mapped onto the Al-Bruijn graph (Fig. 1).
2.4. Clustering discordant read-pairs to infer structural variants
After we detect discordant read-pairs on the Al-Bruijn graph, we can utilize them to infer structural variations in a donor genome in comparison to a reference genome. Among paired-end mapping methods, a common strategy for detecting SVs in a donor genome relies on clustering of discordant read-pairs to detect well characterized breakpoint signatures associated with SV events (Medvedev et al., 2009). The clustering method is mostly based on rules driven by the expected insert size and a parameter controlling the acceptable range of the insert size, commonly in terms of standard deviations. In the conventional setting, clustering of discordant read-pairs to infer SV events can be viewed as an optimization problem to find a minimal set of putative structural variants in a donor genome in comparison to a reference genome, denoted by their types, sizes, and positions, so that every read-pair acquired from the donor genome can be explained (Raphael et al., 2003; Tuzun et al., 2005). For simplicity, we assume that the genome S is a single linear string and that all reads are error-free and of at least length l (e.g., for the widely used Illumina sequencers, l≈100). Furthermore, we assume that paired-end reads are sequenced in opposite directions of each other and the insert size spans both reads.
One of the methods using an optimization approach is VariationHunter (Hormozdiari et al., 2009, 2010). Following VariationHunter notations, a discordant read-pair is denoted as pei and each pair of mapped loci of the read-pair is defined as Align(pei) = apei 3 . The goal of this approach is to identify the valid clusters of discordantly mapped read-pairs (i.e., ape), each supporting a particular SV event, and the maximal valid clusters—each of which is not a subset of another valid cluster. Our goal is to redefine the valid clusters of discordant read-pairs in the context of Al-Bruijn graphs and to identify a minimal set of maximal valid clusters of all discordant read-pairs so that all read-pairs from the donor genome are explained. We show that because each read mappable to the reference genome can be mapped to a unique position in the Al-Bruijn graph, we can use a simple clustering algorithm to achieve this goal.
Valid clusters of discordant read-pairs are defined based on a set of distances between pairs of reads and several empirical rules related to the SV events. Below, we redefine them in the context of Al-Bruijn graphs. We first need to define a distance measure between two positions on the Al-Bruijn graph. In a linear genome of sequence S, given two positions posa and posb, the distance can be simply calculated by |posa−posb|. In order to calculate the distance between two positions gp1 and gp2 on the Al-Bruijn graph (required for clustering discordant read-pairs as explained below), instead of computing all possible pairs of locations on S for gp1 and gp2, we define a function MinDist(gpx,gpy) that computes a minimum distance between these gp1 and gp2:
which can easily be computed by traversing the graph following the thread T, using an algorithm similar to Algorithm 1, which filters concordant read-pairs on the Al-Bruijn graph. Using this measure, we can easily calculate the distance between two clusters of reads or between a read and a cluster.
Based on the distance measure of any two positions in the Al-Bruijn graph, we propose a greedy algorithm for clustering discordant read-pairs following the thread of the genome S on the Al-Bruijn graph. We note that because every discordant read-pair has a unique pair of mapped positions in the Al-Bruijn graph (i.e., there is a one-to-one correspondence between each ape and pe), each pair of discordant mapped positions (ape) should be covered by one cluster. Therefore, we can simply cluster discordant read-pairs according to their positions on the graph, and do not need to find a minimal set cover on these pairs. We call a cluster of discordant read-pairs valid if the read-pairs in the cluster satisfy the following conditions:
• There is at least one path p in thread T that covers all read-pairs with consistent orientations. • Given a cluster, for any pair of end reads (x, y) located in the same end of the cluster, MinDist(x, y) can be at most dm away, where dm is a user-supplied parameter indicating the variation of the expected insert size.
Since a cluster contains a collection of pairs of mapped loci, where each pair must be from a single pe, each valid cluster has two ends, where each end can be considered as a densely packed aggregate of mapped reads with identical orientation. In a linear reference, this is depicted as an interval. Since we are going to cluster read-pairs greedily as we traverse through the graph following the thread, we always encounter one end read in a read-pair first as the other end read will be located farther down the thread. We refer to the end of the cluster we first encounter in the thread as the leading end and the other end as the remote end.
To identify the valid clusters among a given set of discordant read-pairs (Algorithm 4), we start traversing the graph with a list (C) that records the clustering result and a temporary list CluList that records clusters within dm distance from current traversal position. CluList of size n is a list (
2.5. Incorporating error-prone reads in SV detection
We presented the algorithmic framework for SV detection based on the reads mapping onto the Al-Bruijn graph with the assumption that all mappable reads are perfect substrings of the genome S. In practice, however, the reads may contain sequencing errors (substitutions or insertions/deletions), and thus the reads are slightly different from the corresponding substrings in the genome S. For example, the average error rate in the reads acquired by using Illumina sequencers is below 0.01. Consider the reads of length l that may contain at most δ errors: 4 We construct the G(S,l,δ) of the genome sequence S based on the similarity matrix A derived from all local pairwise alignments between S and itself longer than l and with identity greater than 2δ. It is easy to see that under this condition, each mappable read is mapped to a unique position on G(S,l,δ). As a result, the SV detection algorithm described above can be used in a similar manner.
3. Results
3.1. Implementation
We implemented our method as a JAVA program, which takes as input a reference genome sequence and a large set of paired-end sequence data, along with best-hit alignments using a conventaional short read aligner, and reports a list of discordant read-pair clusters. For both simulated data and MA line data, we used BWA (Li and Durbin, 2009) to map the reads onto the reference genome and projected all the best-hits onto the Al-Bruijn graph. We constructed the Al-Bruijn graph with δ errors G(S,l,δ) with l = 90 and δ = 4 using E. coli K12 MG1655 (RefSeq ID: NC_000913) as the reference genome. Read-pairs with one or more concordant mappings were removed and discordant read-pairs (dm = maximum insertion size - l) were clustered.
3.2. IS transposition detection
In order to confirm an IS insertion, two clusters of discordant read-pairs (one for each flanking region of the insertion site, directed toward each other, and the other ends of the clusters must originate from the ends of the element that has transposed) are required (Fig. 2). A simple script was written to find novel IS insertions by searching for two valid clusters of discordant read-pairs meeting the following criteria: (i) an end of the first valid cluster and an end of the other valid cluster must be in opposite directions of each other; 5 (ii) the cluster end with forward reads must come before the cluster end with reverse reads; and (iii) they are close to each other (i.e., within +/− 50 bps). Furthermore, the IS element that is being transposed can also be determined within the region bounded by the leftmost and rightmost reads of these two valid clusters.
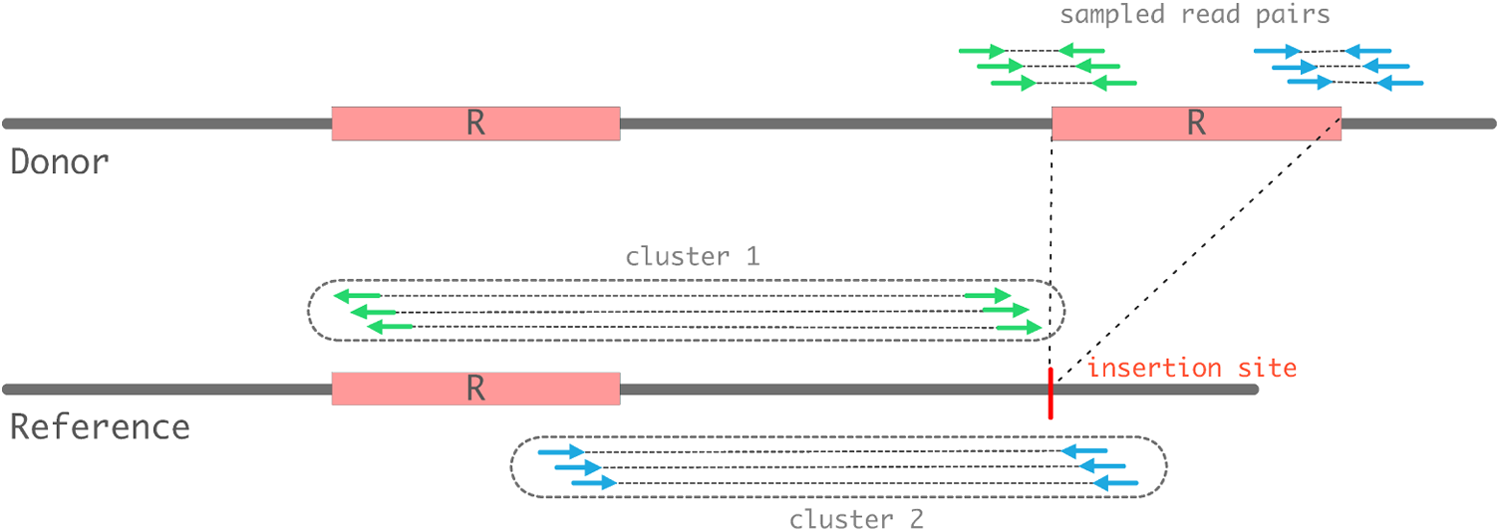
A donor genome with an extra insertion of a repetitive element R is shown, and read-pairs sampled from the donor genome are shown on top as green (left flank) and blue (right flank) pairs. When these read-pairs are mapped to the reference genome, two clusters covering each flank of the insertion site are necessary to detect a duplicative transposition event. The direction of the reads mapped to either flanking region must be directed toward the insertion site. The other ends of read-pairs must map to the ends of the element, directed away from the element. The clusters are enclosed in dotted lines. Cluster 1 containing green pairs covers the left flank, and Cluster 2 containing blue pairs covers the right flank.
3.3. Validation based on simulation data
In order to compare the performance of our approach with that of other SV detection tools, we simulated novel SV events—insertions of the insertion sequence (IS) elements (a family of bacterial repeats) into the E. coli genome. Note that there are six families of IS elements in the E. coli genome, each with multiple copies (e.g., the IS1 family has seven copies with only slight or no sequence differences among copies). Thus, each of these novel SV events involve reads from repetitive regions in the reference genome and will be missed by SV detection tools based on uniquely mapped reads (e.g., BreakDancer reported no SV events in our simulated data). We compared the performance of our method to that of Hydra-SV (Quinlan et al., 2010), an SV detection algorithm that utilizes multiply mapped reads. We considered including VariationHunter (Hormozdiari et al., 2009, 2010) in the comparison as well; however, its current implementation works only on human genomes but not on bacterial genomes, although their problem formulation does not have this limitation.
A simple customized script was written to simulate random insertions of active IS elements (IS1, IS5, and IS186) to the reference genome. Target-site duplication 6 was also simulated whenever an insertion was made to the reference genome. Using the genome sequence with the random insertions, paired-end Illumina data (2 × 90 bp) was generated using the Illumina read simulator pIRS (Hu et al., 2012) with an average insert size of 470 bp and a standard deviation of 11 bp. During the simulation, both the number of insertions per element and the sequencing coverage were varied. The number of insertions per element was set to 5, 10, 20, and 30. For each setting, 10 replicates were generated, resulting in 40 simulated genomes. For each simulated genome, sequencing coverage was set to 5× , 10× , 20× , 30× , 40× , and 50× . Then each set of sequencing data (a total of 240 sets) was individually input into our program and Hydra-SV to characterize the simulated SVs. Hydra-SV was run based on the example pipeline recommended on the Hydra-SV website. We used the recovery ratios, i.e., the number of simulated IS insertions identified, to measure the performance of each method. Because Hydra-SV is designed to detect breakpoints rather than actually classify SVs, we calculated two sets of recovery ratios to measure the performance of Hydra-SV. For the first set of recovery ratios (referred to as the singular recovery ratio), an IS element insertion event was determined as a valid recovery if Hydra-SV detected at least one pair of clusters covering both sides of the insertion site, regardless of whether both clusters extended from the same IS element copy or not. For the second set of recovery ratios (dual recovery ratio), we required at least one pair of clusters covering both sides of the insertion site and also required that both clusters in the pair extended from the same IS element copy (Fig. 3).
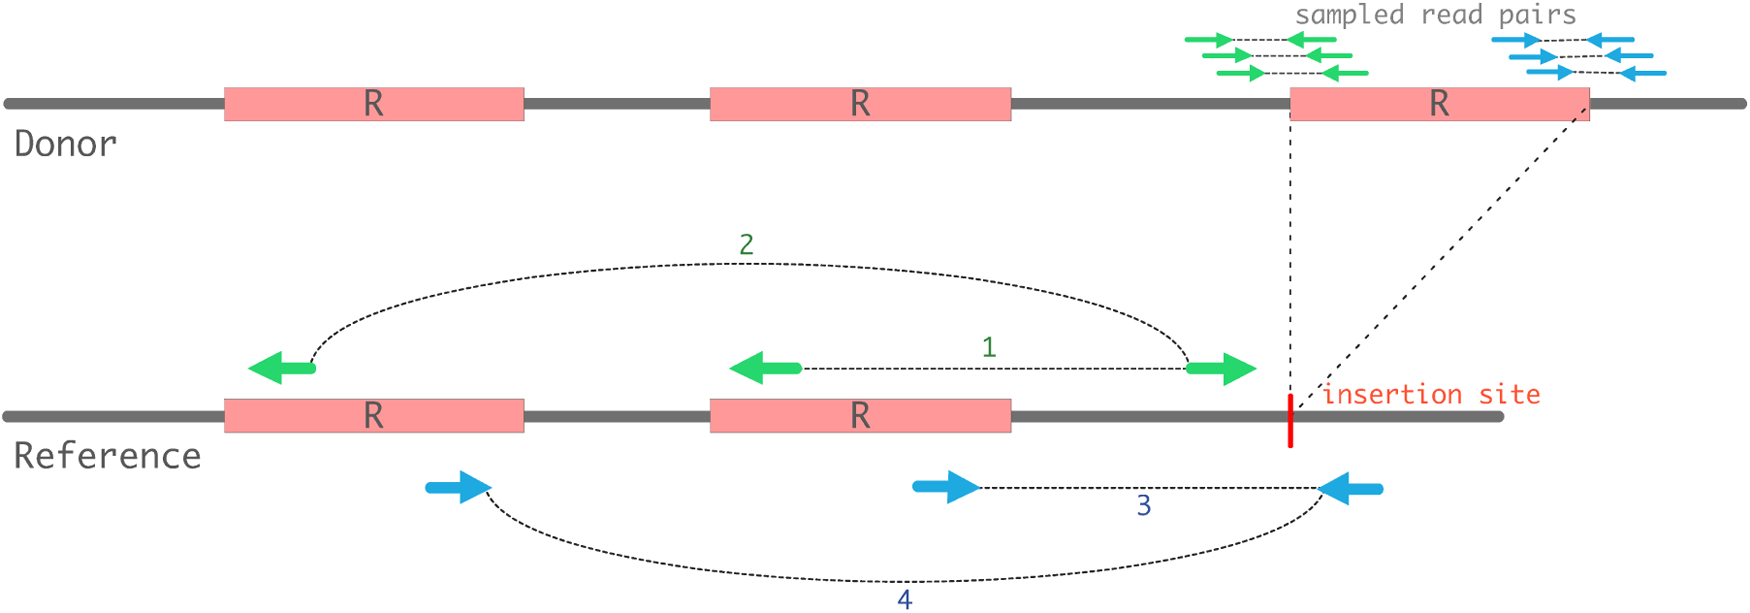
A donor genome with an exra insertion of insertion sequence (IS) element R compared to the reference genome is shown. End reads sampled from the extra insertion can map to all copies of the same repeats, resulting in many potential Hydra-SV clusters. End reads are drawn as small arrows and aggregates of reads (cluster ends) are drawn as large arrows. In this example, the cluster-pairs 1-3 and 2-4 are the only pairs that can correctly identify the transposition segment (dual recovery) because the cluster ends of these pairs extend from the same copy. The other potential cluster-pairs 1-4 and 2-3 extend from two different copies. Any of these four pairs are considered singular recovery, whereas only the read-pairs 1-3 and 2-4 are examples of dual recovery. If the reference has n copies of R, then there can be exactly n cluster-pairs that can be considered as dual recovery, whereas there are n2 cluster-pairs for singular recovery.
The average recovery ratios across 10 replicates for each parameter setting are summarized in Figure 4. As shown on the plots, our approach performed similarly to Hydra-SV for singular recovery ratios (both achieve above 0.95), while our method outperforms Hydra-SV significantly for dual recovery ratios, where Hydra-SV achieved between 0.35 and 0.54. This implies that Hydra-SV can detect at least one side of insertions in most cases, but in many cases, it misses the other side. As a result, Hydra-SV performs well only when a detailed annotation of the repeat instances in the reference genome is available, whereas our method can classify the SV events automatically based solely on the reference genome sequence.

Comparison of the Al-Bruijn graph approach with Hydra-SV for detecting simulated IS element insertions in the E. coli genome. The performance of Hydra-SV is measured by both the singular and dual recovery ratios.
3.4. IS element insertions in mutation accumulation (MA) lines
We also applied our method to detect novel transposition of IS elements in mutation accumulation (MA) lines of E. coli PFM2 and its mismatch repair (MMR)–deficient derivative PFM5 7 (MutL− lines) by using whole genome sequencing data as reported in Lee et al. (2012a). MA experiments are designed to capture spontaneous mutations by allowing mutations to accumulate over many generations without selection (Keightley and Halligan, 2009). This is achieved by initiating a number of lines (MA lines) from a single founder strain and repeatedly taking each of the lines through a population size bottleneck, down to a single individual. Note that each line accumulates mutations independently from the other lines originating from the initial founding individual. This results in an effective population size of one, causing the power of random genetic drift to dominate the power of selection, thereby effectively removing the selection (Lynch et al., 1998). The general idea of the MA strategy is illustrated in Figure 5. Because of the lack of selection during an MA experiment, we expect to observe novel IS insertions near the actual transposition activities of each IS family.
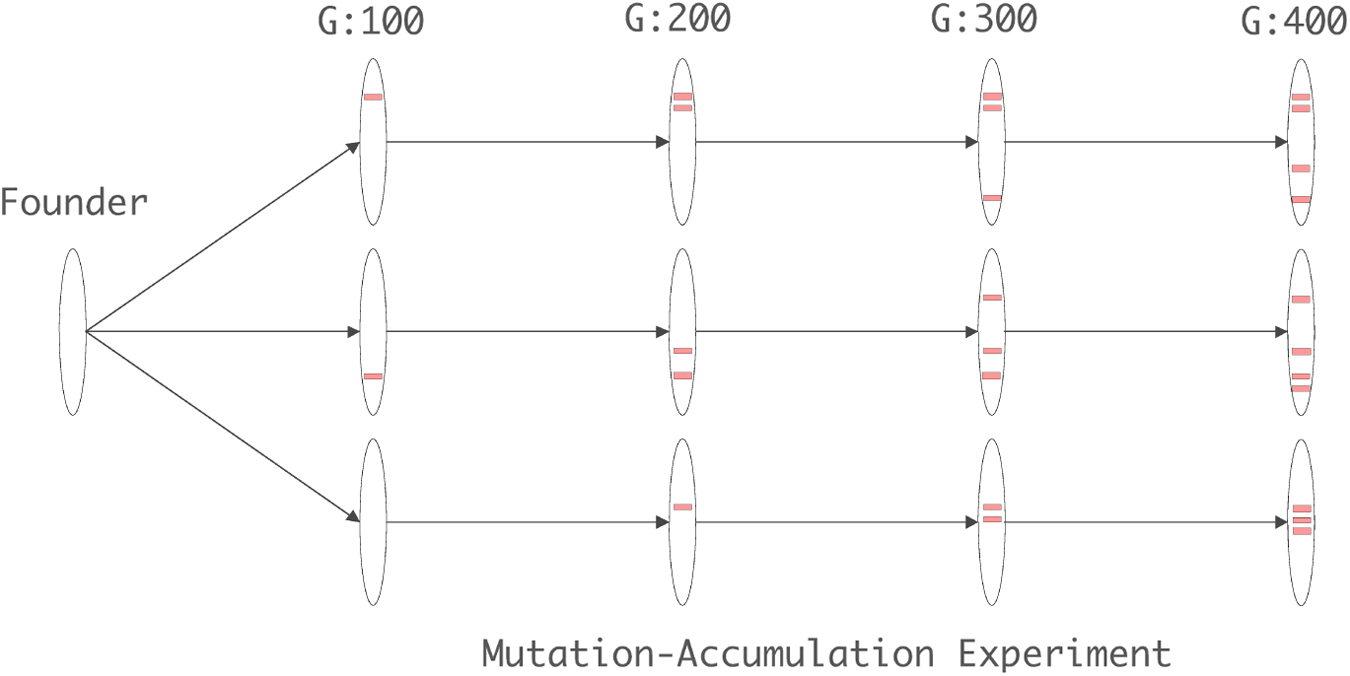
A schematic illustration of a mutation accumulation (MA) experiment. All MA lines start from a single strain, the founder as depicted in the figure. A number of (e.g., 3 as depicted in the figure) lines are maintained, and regularly passed through population bottle necks (a colony is picked and struck for single colonies; each colony is founded by a single cell). Genomes (shown as ellipses) of different lines accumulate mutations (shown as the red horizontal bars on genomes) independently throughout the course of the MA experiment.
We applied our methods to all the reported lines (Table 1), consisting of 38 lines of wild-type E. coli strains passed through 3,080 generations per line (denoted as wild-type 3k), 21 wild-type lines passed through 6,356 generations per line (denoted as wild-type 6k), and 34 lines of MutL− passed through 375 generations per line. For each MA line, ∼10.4 million read-pairs (∼20.8 million reads of length between 90 to 110 nucleotides) were acquired, achieving coverage of ∼100× . The expected range of insert size was estimated in terms of the median and the median absolute deviation (MAD) values calculated in Lee et al. (2012a), and it was determined as [median ± 7.5 * MAD] (which approximately is equal to 5 standard deviations from a normally distributed population of a large sample).
IS, insertion sequence; MA, mutation accumulation.
A total of 64 putative transposition events were identified in the various MA lines. Also, a novel insertion site of the IS186 element was observed in all 83 MA lines, indicating it is present in the founder line but absent in the reference genome. Table 2 shows the entire list of putative IS element insertions and the fixed insertion. Among 64 putative insertions, 27 of them are from the wild-type 3k and MutL− lines. We comprehensively validated these 27 insertions using PCR as follows. For each putative insertion, PCR primers were designed from the two flanking sequences. For each set of primers, we used two templates, one from founder and the other from the line of interest. It was called true positive if and only if the PCR product obtained from the founder template showed no sign of insertion, and the PCR product obtained from the line of interest showed the PCR product matching the expected size (Fig. 6). Out of 27 insertions, 26 were confirmed and only one was rejected as a false positive. The fixed insertion of IS186 found in all lines was also confirmed by direct PCR.
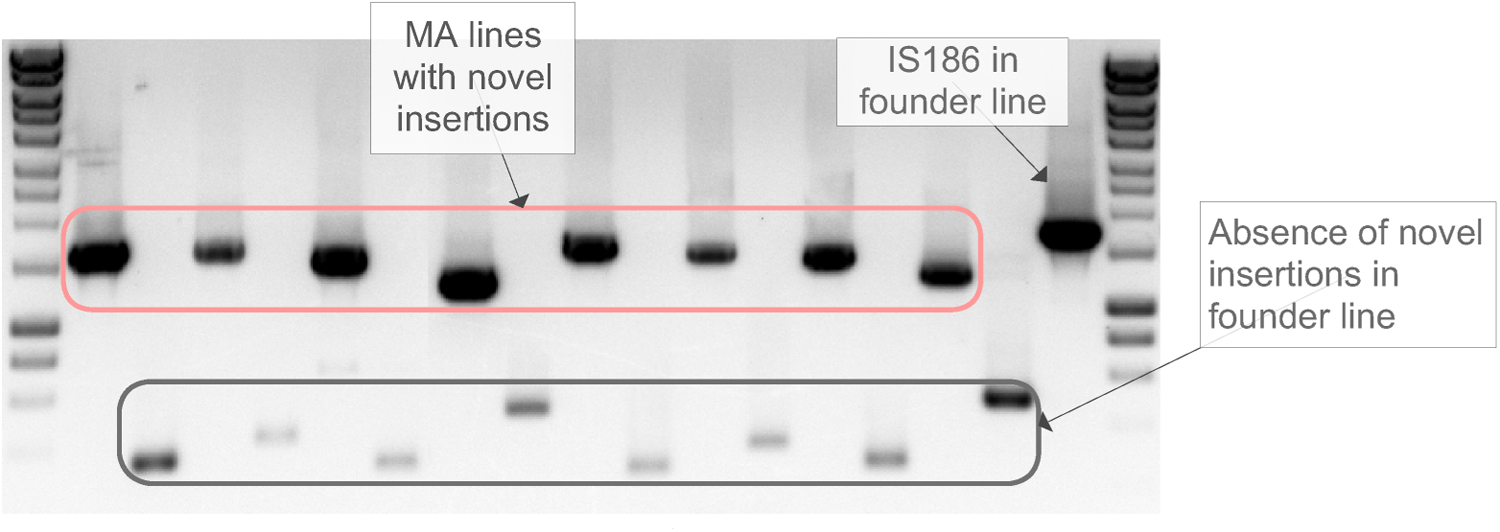
A gel image showing polymerase chain reaction (PCR) products confirming the identified IS element insertions in MA lines. PCR primers were designed from the two flanking regions of each insertion, allowing the detection of either the insertion or an empty site if there has not been a transposition. As indicated in the image, the PCR bands enclosed by the red boundary reflect the PCR products of expected size obtained using corresponding MA line's DNA as a template. PCR bands enclosed by the black boundary reflect the PCR products of much smaller sizes obtained using the founder template—the founder should lack these insertions, since these insertions happended independently during the MA experiment. The rightmost PCR band indicates the novel insertion of IS186 that is fixed in PFM2 (PCR against the founder template) and not present in the reference.
, wild-type 3k; ⋆, wild-type 6k; †, MutL−; ⨂, false-positive
With IS insertions found and confirmed, we calculated the spontaneous insertion rate of IS elements for wild-type and MMR-deficient (MutL−) strains (Table 1). The average rate (obtained from wild-type 3k and wild-type 6k strains) of insertion for the wild-type is 2.1 × 10⁻⁴ insertions per genome per generation, while the rate for MutL− is significantly higher at 7.06 × 10⁻⁴ (p-value ∼0.018 using t-test). Different IS families have very different activities in E. coli: IS1 and IS5 families were the most active in both wild-type and MutL− lines. We note that this work provides the first direct estimate of IS transposition activities in E. coli or in any bacterial species.
4. Discussion
In this article, we propose a novel approach to the SV detection problem using paired-end sequences acquired from a donor genome. Instead of mapping the read-pairs to a linear sequence of the reference genome, we propose mapping reads to the A-Bruijn graph constructed from the reference genome, in which the repetitive regions in the reference genome are collapsed into single edges. As a result, the read-pairs that are mapped to multiple loci in reference sequences can be uniquely mapped to the A-Bruijn graph, and thus SV detection becomes a straightforward clustering of all discordant read-pairs. This approach can easily be extended to the case of detecting novel SVs in comparison with multiple reference genomes. For instance, the recent human population sequencing projects—such as the 1000 Genomes Project (Altshuler et al., 2010)—have revealed many SVs that can serve as a reference set for the future association studies between SVs and human diseases. Besides these common SVs, one can expect to discover rare SVs in the sequencing data from additional individuals. In this case, the known SVs can be incorporated into the A-Bruijn graph representing multiple human genomes, in which the common regions among these genomes are represented as a single edge, similar to the repetitive regions in the reference genome, and SVs are represented as additional edges linking specific positions in the reference genome. After mapping read-pairs to the A-Bruijn graph, novel SVs are discovered by classifying discordant read-pairs resulting from the read mapping.
The A-Bruijn graph approach can also be applied to other problems involving reads mapping to repetitive regions. One such case is to quantify closely related microbial species (e.g., within the same genus) based on the metagenomic sequencing reads from a microbial community, in which the common and unique regions were represented as separate edges. After mapping reads to the resulting A-Bruijn graph, one can estimate the relative abundances of these closely related species based on the number of reads mapped to each edge (i.e., common or unique regions) using a statistical model (Wang et al., 2012).
Our work provides the first direct estimate of IS transposition activities in a bacterial organism, because our study is based on a mutation accumulation strategy that eliminates selection against IS insertion, 8 which frequently has fitness effects. The high activities of IS elements in MutL− lines was also observed in other MMR-deficient lines (data not shown) and might be related to the observation that the MMR pathway can inhibit transposon excision in bacteria (Lundblad and Kleckner, 1985).
Footnotes
Acknowledgments
We thank Michael Lynch and the members of his laboratory, especially Thomas G. Doak, for helpful discussions, as well as D. Osiecki, D. Simon, K. Storvik, J. Townes, N. Yahaya, and A. Ying Yi Tan for valuable technical assistance. This work was partially supported by the Multidisciplinary University Research Initiative Award W911NF-09-1-0444 from the Army Research Office, and the National Science Foundation Award DBI-1262588.
Author Disclosure Statement
The authors declare no conflicts of interest.
1
Note that p is always the distance away from the starting position of a forward traversal of the edge ei.
2
We assume we are using paired-ends sequencing in which the reads belonging to the same pair are sequenced from the opposite ends of the DNA fragment.
3
Note that in Hormozdiari et al. (2009,  ), the function Align(pei) returns a set of alignments as pei can be mapped to multiple loci in the reference genome.
4
For reads with error rate below 0.01, we consider δ = 4 because most reads contain 4 or fewer sequencing errors.
5
A putative insertion site is located in between these ends of two clusters.
6
When an IS element is inserted, its transposase recognizes a target site sequence and makes short staggered cuts to place the element (Mahillon and Chandler, ). After the element is placed, the short stretches of single-stranded DNA are filled, resulting in short duplicated sequences that flank both sides of the newly inserted element.
8
IS elements are often inserted into the protein-coding genes, resulting in lines with lower fitness.