
Abstract
Abstract
As the amount of data describing biological interactions increases, it becomes possible to analyze the complex interactions of genes and proteins across multiple networks at the genome scale. While the most popular techniques to study conservation of patterns in biological networks are through the use of network alignment techniques or the identification of network motifs, we show that it is possible to exhaustively enumerate all graphlet alignments, which consist of at least two vertex-disjoint subgraphs that share a common topology and contain homologous proteins at the same position in the topology. We compare the performance of our algorithm to network alignment algorithms and show that our algorithm is able to cover significantly more proteins in the given networks while maintaining comparable or higher sensitivity and specificity with respect to functional enrichment.
1. Introduction
T
An alternative strategy to analyze biological networks is through the identification of network motifs (Milo et al., 2002; Wuchty et al., 2003), which are over-represented patterns in a network. While most previous approaches for finding network motifs focus on estimating the number of motifs that have a certain topology in biological networks, either through counting (Shen-Orr et al., 2002; Parida, 2007; Alon et al., 2008), sampling (Kashtan et al., 2004; Jiang et al., 2006; Pržulj et al., 2006; Wernicke, 2006), or a combination of these techniques (Grochow and Kellis, 2007), functional linkages of proteins within a motif are ignored.
We investigate the problem of identifying conserved patterns in protein interaction networks by obtaining graphlet alignments, which consist of at least two vertex-disjoint subgraphs that share a common topology and contain homologous proteins at the same position in the topology. Since each topology is represented by a small graphlet, we employ exhaustive enumeration techniques to identify all alignments, which is different from most network alignment algorithms that employ heuristics. By placing a constraint on homology between aligned proteins, our strategy is different from counting the number of network motifs that have a certain topology.
We apply this strategy to protein interaction networks both within and across species and show that our algorithm is able to cover significantly more proteins in the given networks than previous approaches while maintaining comparable or higher sensitivity and specificity with respect to functional enrichment.
2. Methods
We first assume that a single interaction network is given, and our goal is to identify all graphlet alignments within the network (Fig. 1).

Illustration of an interaction network G; a topology H; a graphlet alignment that contains m = 3 instances H1, H2, and H3; and its correspondence with an induced subgraph of G3. Each oval represents one set S
k
of homologous proteins in
Definition 1
Given an undirected graph G and an integer m, Gm is an undirected graph in which each vertex
Definition 2
Given an undirected graph G = (V, E) that represents an interaction network, a connected undirected graph
Similar to the motif discovery approach in Grochow and Kellis (2007), we assume that a fixed topology is given, and our algorithm can be applied over different topologies to identify all graphlet alignments. Since the given topology does not contain actual proteins, this strategy is different from other approaches that identify conserved patterns through a query path or a query network (Kelley et al., 2003; Shlomi et al., 2006; Tian et al., 2007; Dost et al., 2008). Since no restrictions are made on the relationships between different sets Sk of homologous proteins, they can overlap in complicated ways. This strategy is different from the one in Koyutürk et al. (2004), in which the same label is used to specify homologous proteins in different graphs. In addition to subgraphs in G, the isomorphism mappings are applied to induced subgraphs in Gm to make sure that H is the densest topology that all instances share (note that the subgraphs in G do not need to be induced). To avoid repetitive structures, we require that each vertex in G can only appear at most once within an alignment. Note that this does not prevent different homologous proteins from appearing within an instance.
We exhaustively find all graphlet alignments through a branch-and-bound algorithm by generating m-tuples of vertices in G that satisfy the homology constraints and recursively adding them to a growing alignment with m instances. This technique updates the m instances at the same time and is different from the progressive alignment technique used in network alignment algorithms (Flannick et al., 2006). To avoid the generation of redundant alignments, we impose symmetry-breaking conditions.
Grochow and Kellis (2007) considered the problem of enumerating all subgraphs of an undirected graph G that are isomorphic to a given topology H and derived symmetry-breaking conditions to ensure that there is a unique map from H to each instance of H in G. Given a distinct labeling of vertices in G, they imposed conditions of the form
To impose symmetry breaking conditions on graphlet alignments, observe that there is a one-to-one correspondence between a graphlet alignment with m instances and an induced subgraph in Gm that contains m-tuples of homologous proteins as vertices with no repeated vertices in G. For each j, vij of Hi in a graphlet alignment corresponds to the ith component of the vertex
The problem reduces to enumerating all induced subgraphs of Gm that are isomorphic to H and contains m-tuples of homologous proteins as vertices with no repeated vertices in G, thus the symmetry-breaking conditions in Grochow and Kellis (2007) can be used to break symmetry of topology in Gm. We have an additional type of symmetry because of the permutation of instances.
Definition 3
Two graphlet alignments with m instances are redundant if they have exactly the same sequence of m-tuples of homologous proteins up to symmetry of topology in Gm and symmetry due to permutation of instances (Fig. 2).
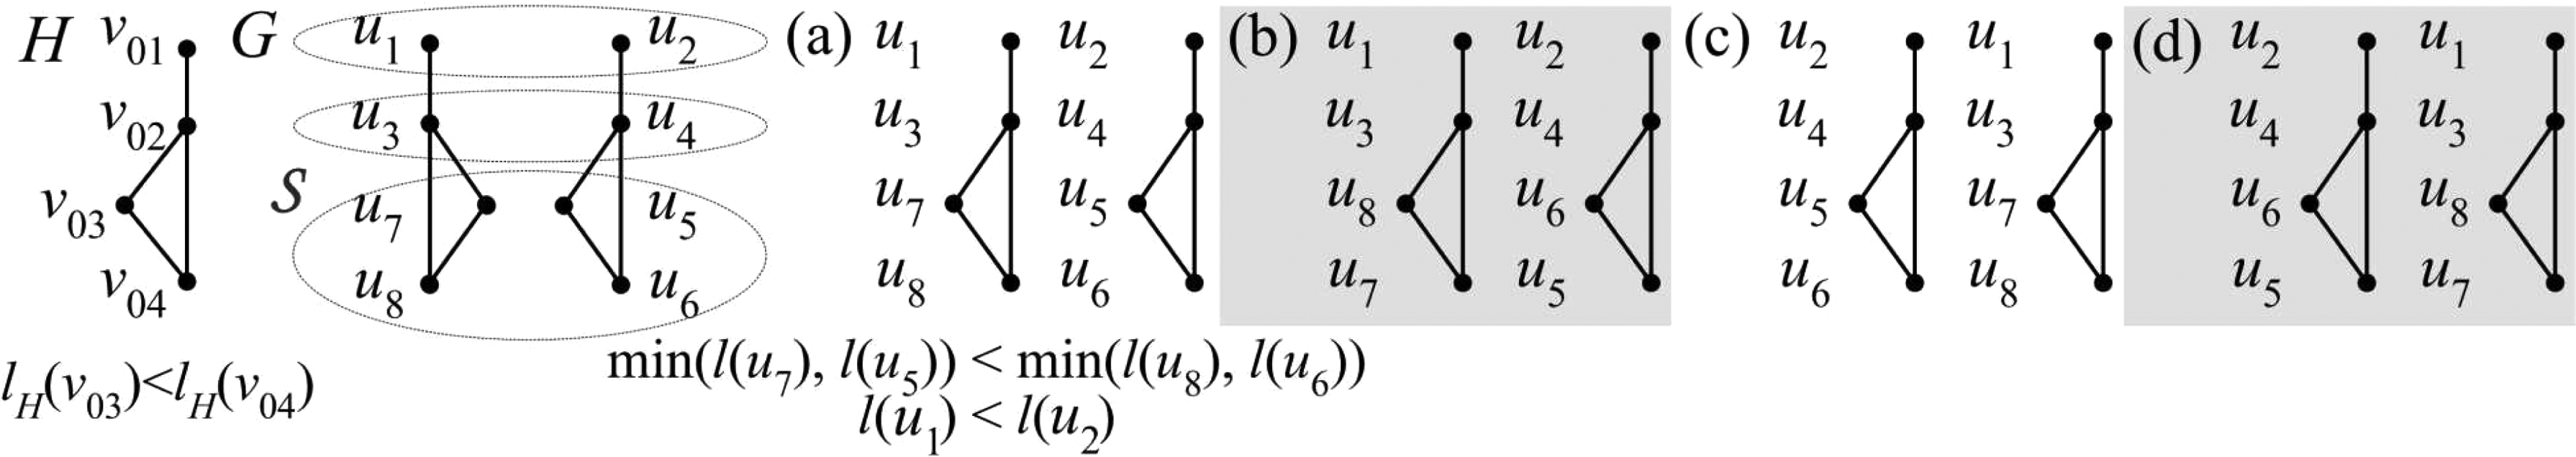
Illustration of redundant alignments: The alignments in
To break both types of symmetry, we first make sure that all alignments that differ only by a permutation of instances are treated in exactly the same way with respect to topology symmetry breaking by assigning the same label to each m-tuple

Illustration of distinct alignments that have the same set of labels {1, 3, 5, 6} in G2 given the label assignments l(u
i
) = i and l(ui, uj) = min(l(ui), l(uj)). The alignments in
Figure 4 shows our algorithm GraphletAlign that enumerates all non-redundant graphlet alignments by applying the procedure ExtendAlignment to grow an alignment recursively (Fig. 5). Unlike other network alignment approaches that combine more than one network into a single graph during preprocessing (Kelley et al., 2003; Sharan et al., 2005; Koyutürk et al., 2006), there is no need to generate the entire graph Gm explicitly, which is not feasible when m is large because of extensive space requirements. During the generation of m-tuples
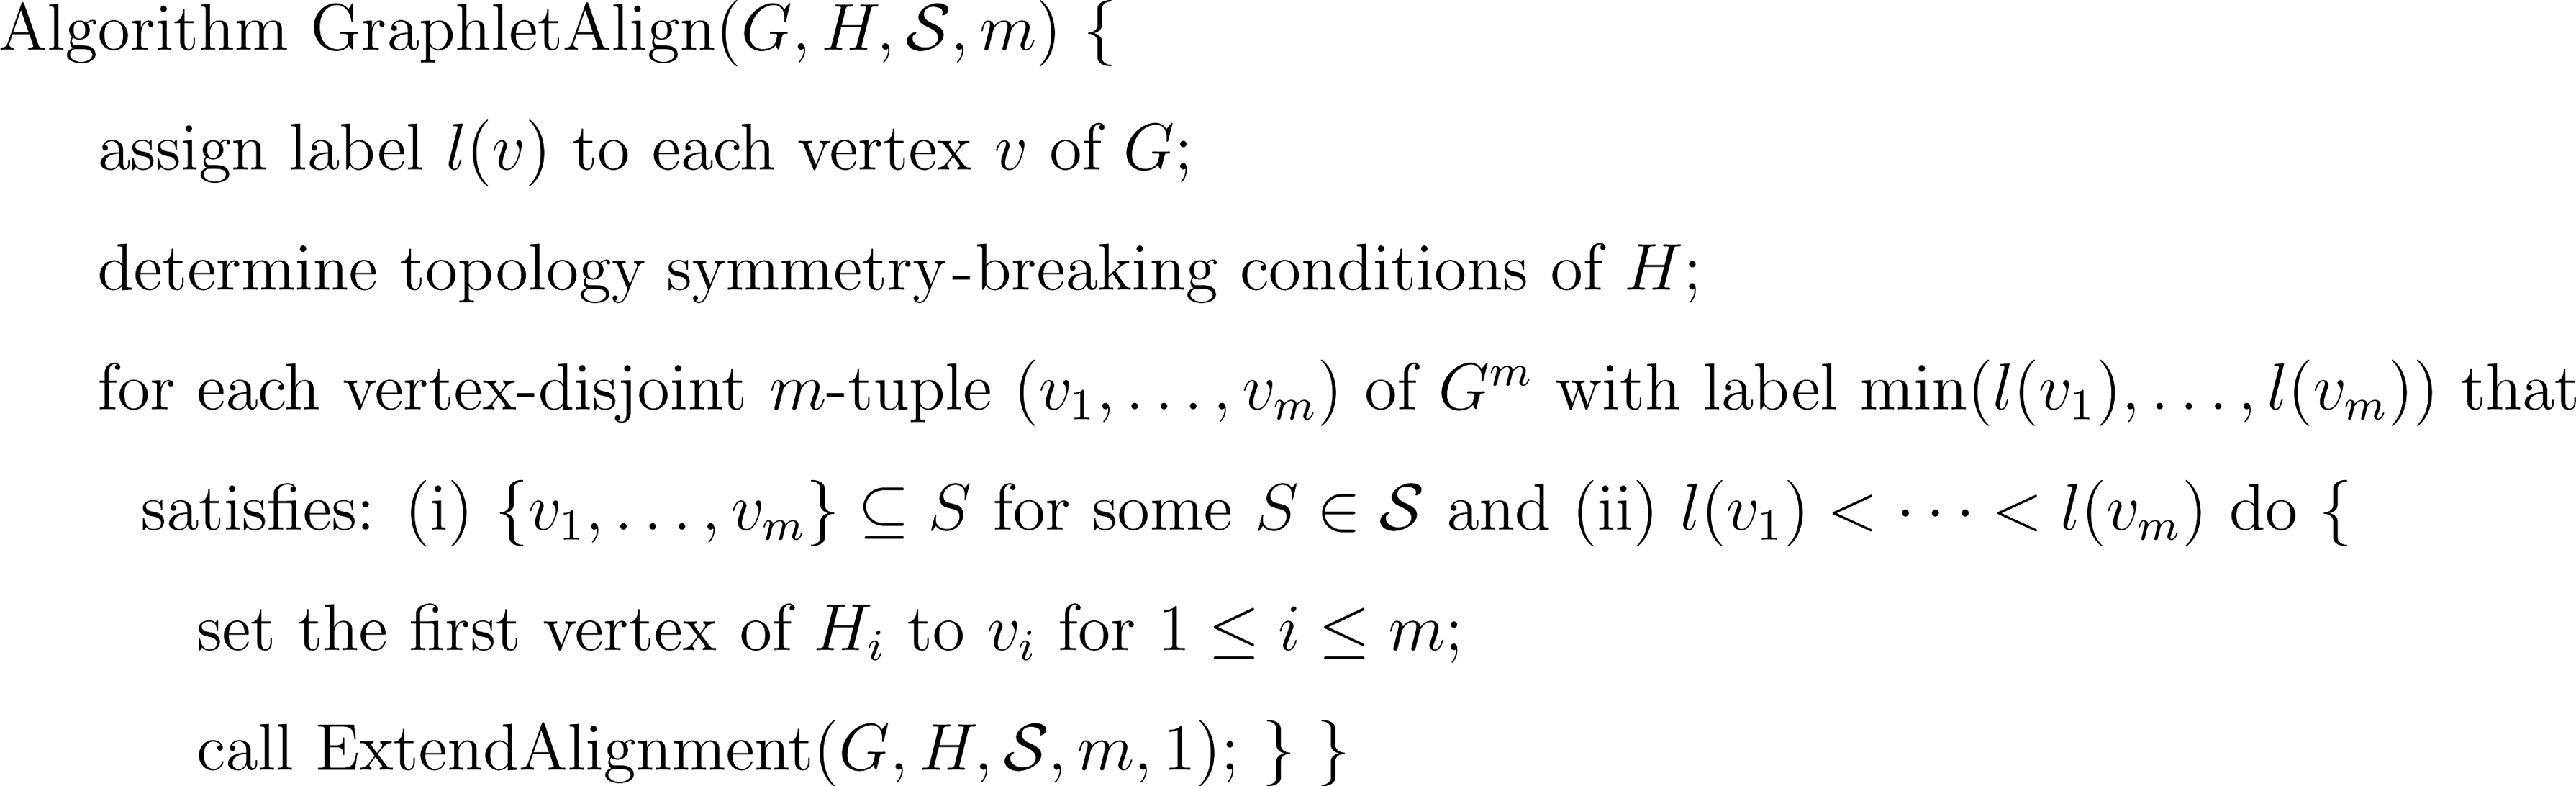
Algorithm GraphletAlign for finding graphlet alignments with m vertex-disjoint instances
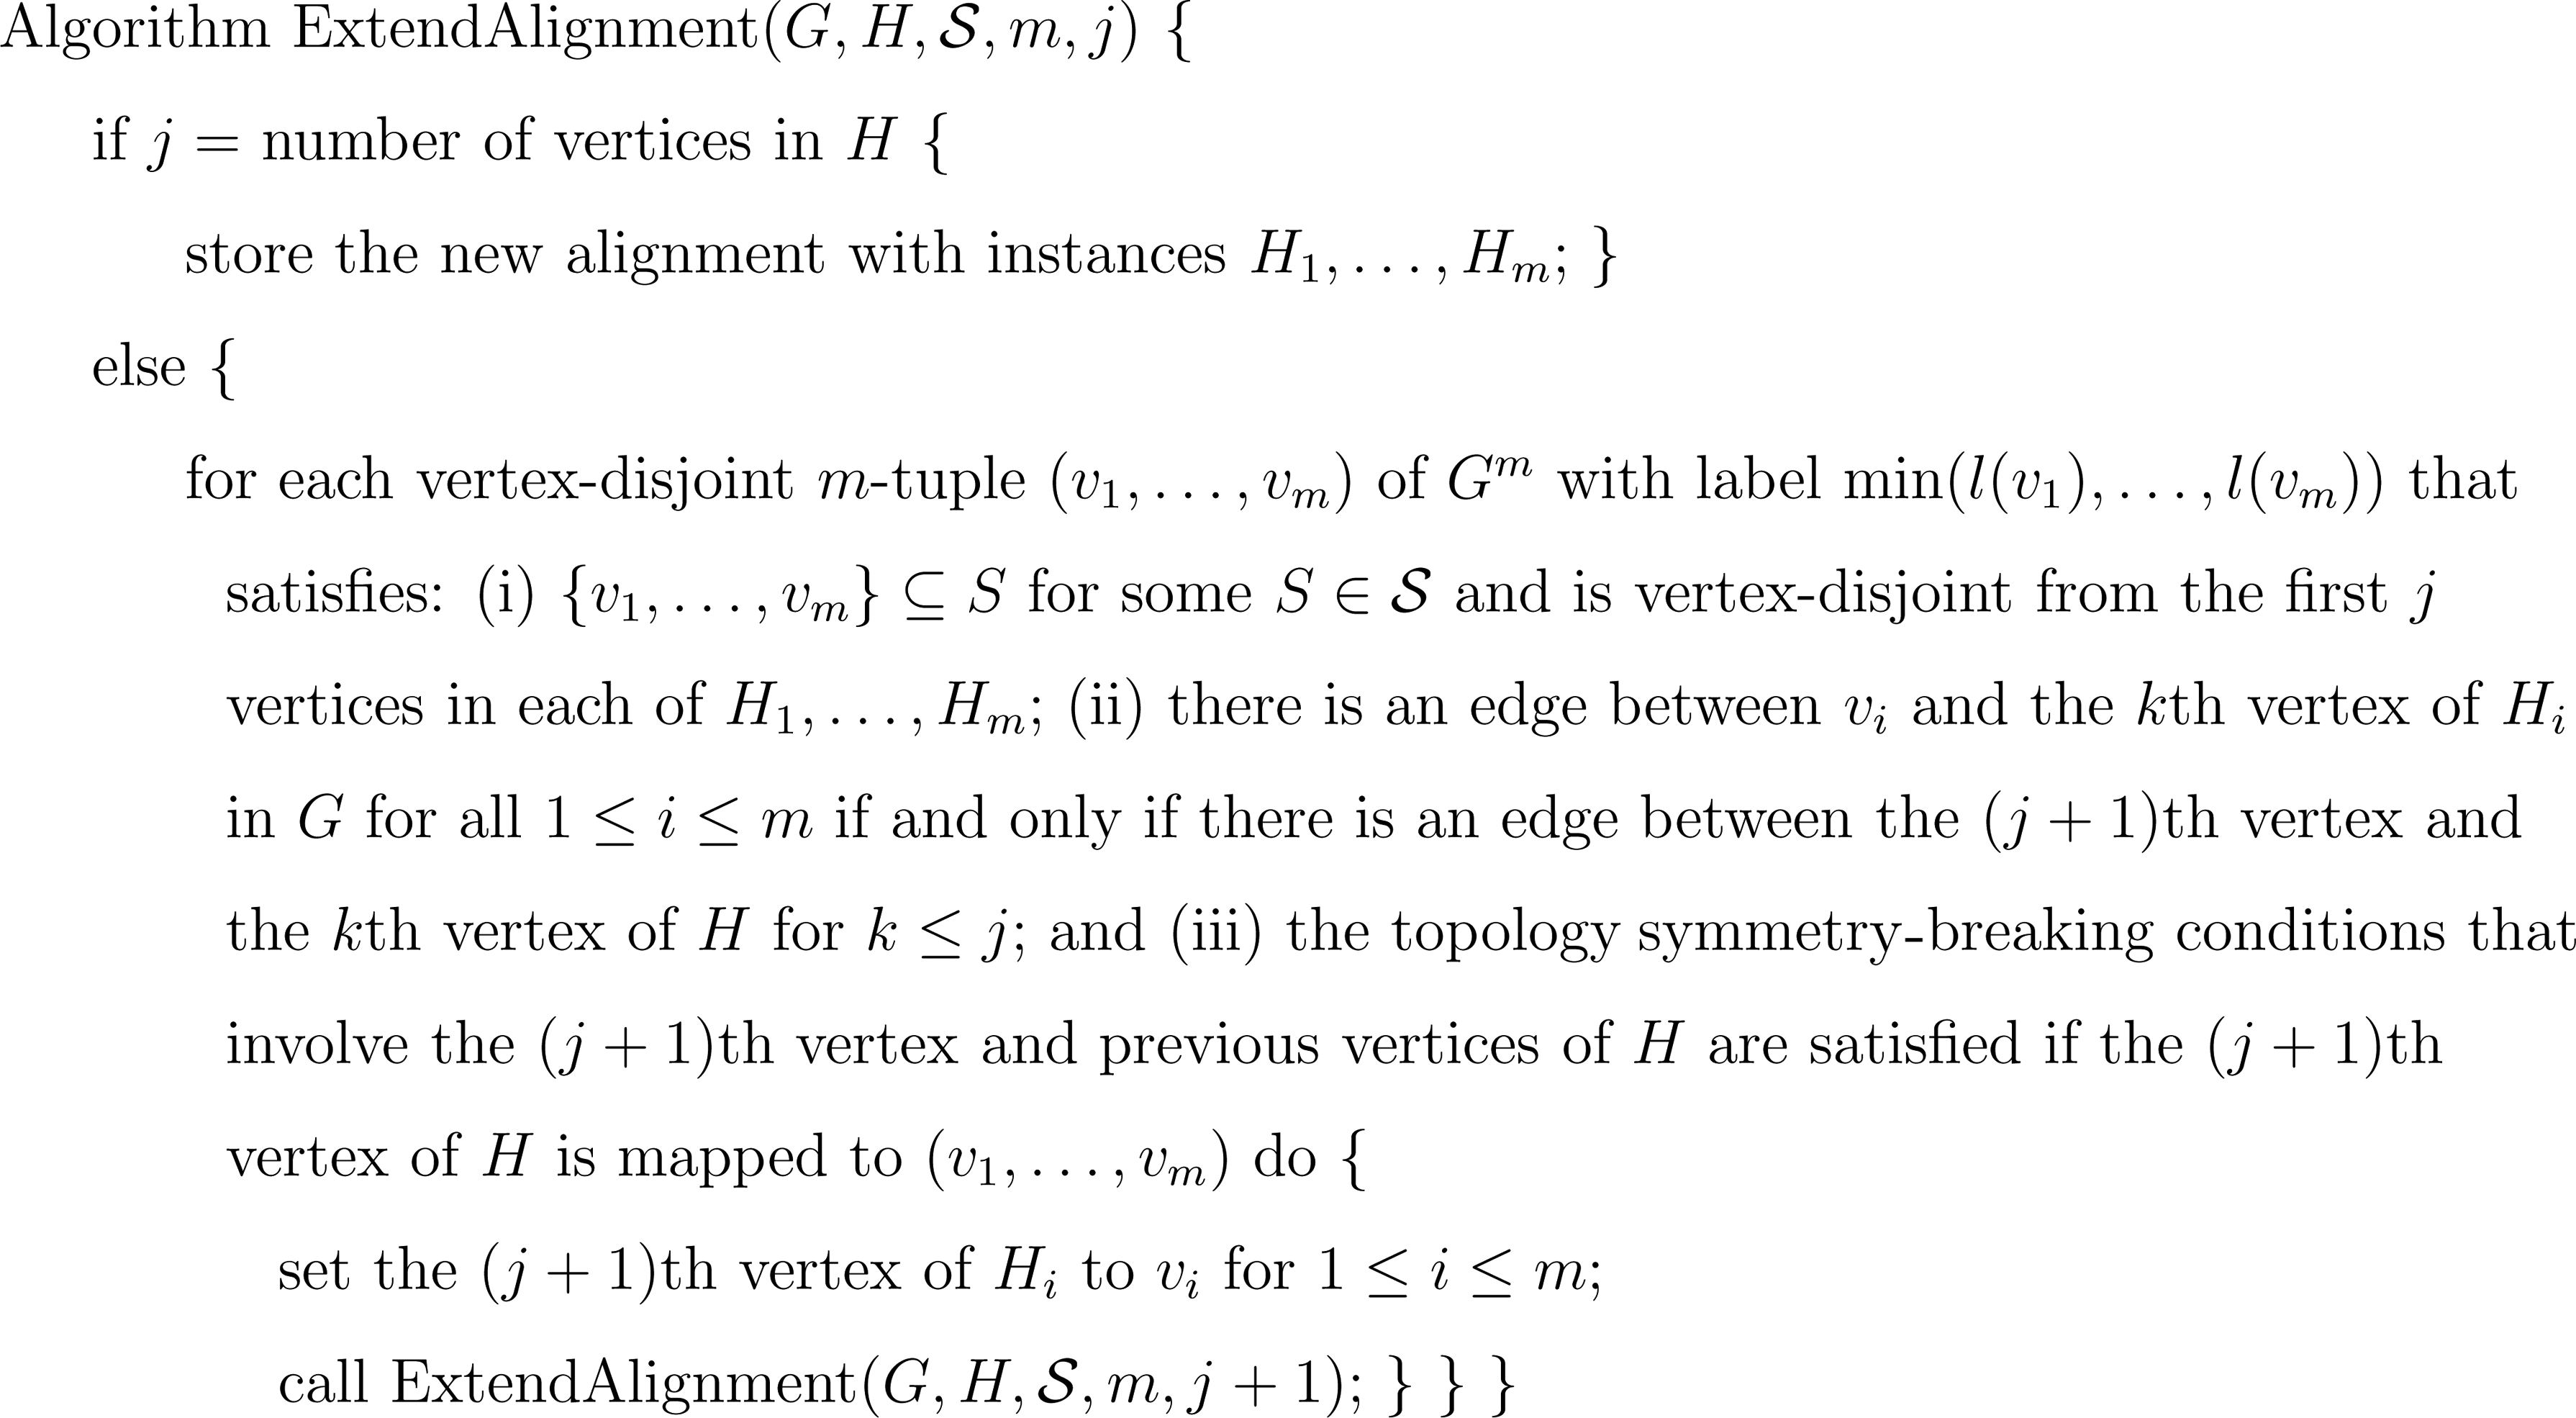
Algorithm ExtendAlignment for extending alignments that contain the first j vertices of each of the m vertex-disjoint instances
Since for each m-tuple in Gm, the algorithm ExtendAlignment is called recursively on all its adjacent m-tuples at most |V0|−1 times, the worst case time complexity is
To allow indels between neighboring proteins within the instances, given a parameter d that specifies the maximum length of gaps, we construct a new graph G′ = (V′, E′) from G = (V, E) by setting V′ = V and connecting vertex u to v in G′ if the shortest path distance between u and v is at most d + 1 in G and apply the algorithm to G′ instead of G. To allow the identification of graphlet alignments in multiple networks, we combine the given networks into a single graph G (no new edges are added) and assign consecutive labels to vertices in G within each of the networks. We further require that each alignment contains at least one instance from each network.
3. Results
We applied the GraphletAlign algorithm on non-isomorphic topologies H (Fig. 6) obtained from using the algorithm in McKay (1998) to protein interaction networks from human and mouse in the IntAct database (Hermjakob et al., 2004), to protein interaction networks from fly, worm, and yeast in the DIP database (Xenarios et al., 2000), and to protein interaction networks from E. coli, H. pylori, S. typhimurium, and V. cholerae in the SNDB database (Srinivasan et al., 2006). To obtain the collection
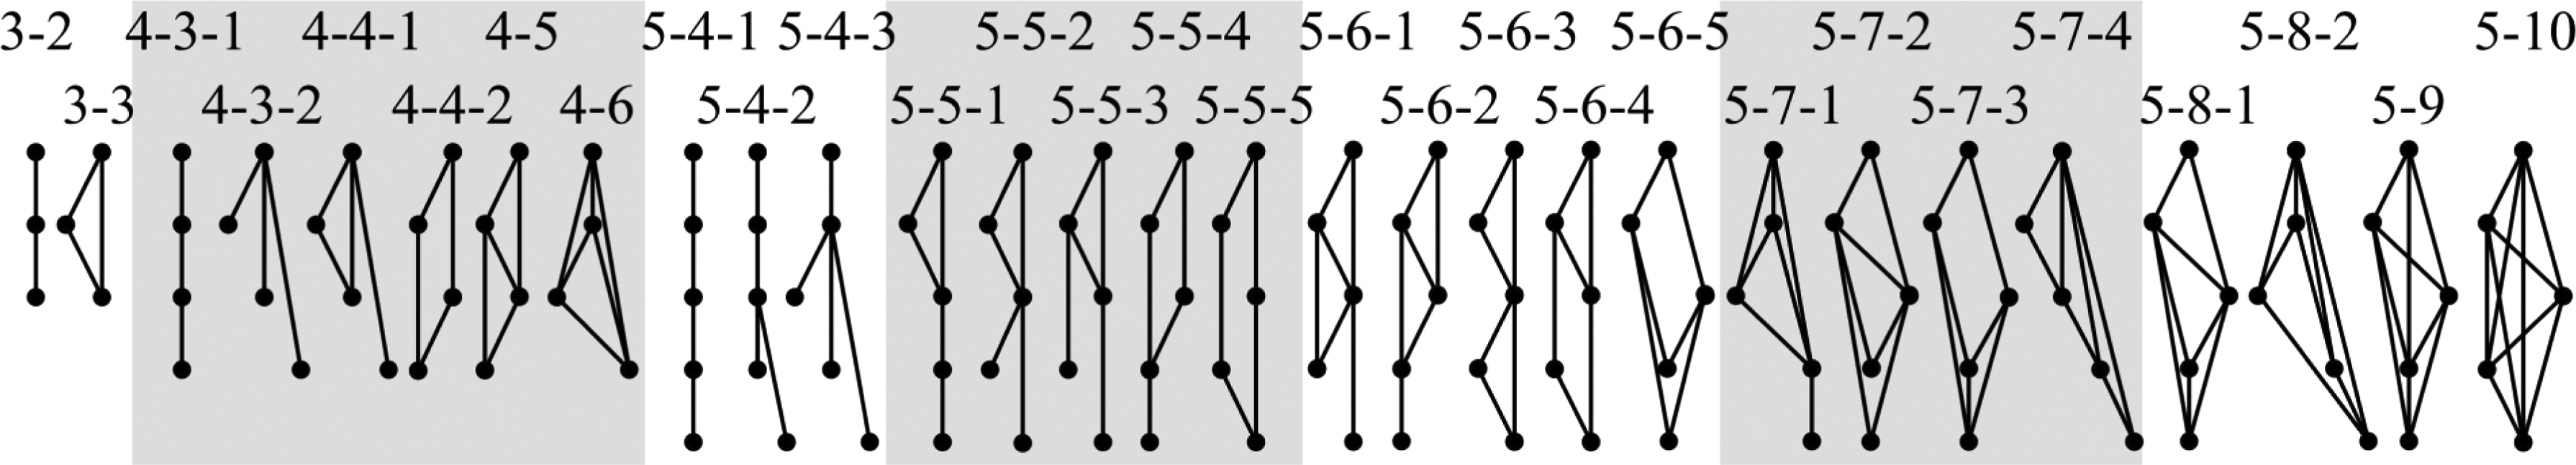
Illustration of all non-isomorphic topologies H with three to five vertices. Each topology is assigned a name of the form x-y or x-y-z, where x is the number of vertices in the topology, y is the number of edges, and z distinguishes between topologies that have the same values of x and y.
In order to allow an indel in a graphlet alignment between two sets of m aligned proteins, one from each instance, we impose an additional condition that there is at least one direct connection within one of the instances in the original network. Note that indels are allowed within each edge of the topology according to the way that G′ is constructed to replace G. Table 1 shows the number of graphlet alignments over a few combinations of species when one indel is allowed. For single species alignments, we use topology size |V0| = 3 and number of instances m = 2. For two-and three-species alignments, we also use topology size |V0| = 4. For two-species alignment on fly and yeast, we further use topology size |V0| = 5. For multiple species alignments, we set m as the number of species. We set the maximum number of top reciprocal BLAST hits r allowed for each protein to the largest possible value (in multiples of five) so that the number of alignments is between 107 and 108. It takes between half of a day and two days to obtain all alignments on a single processor over all topologies in each case.
Within each entry, vertex is the total number of vertices in the given interaction networks, edge is the total number of edges, |V0| is the range of size of topology, m is the number of instances, r is the maximum number of top reciprocal BLAST hits allowed for each protein (“—” indicating no constraint), alignment is the total number of alignments over all topologies, avg_size is the average number of distinct proteins within a module instance after postprocessing (only aligned proteins are counted while indels are ignored), max_size is the maximum number of distinct proteins within a module instance, and time is the computational time to obtain all alignments in minutes.
We compare the performance of our algorithm on multiple species alignments to NetworkBLAST-M (Kalaev et al., 2009), which identifies conserved functionally enriched modules based on a representation of multiple networks that are of linear size. On two-species alignments, we further compare to NetworkBLAST (Sharan et al., 2005), which combines more than one given network into a single graph and uses a seed-extension approach to find high-scoring subgraphs that represent alignments, and MaWISh (Koyutürk et al., 2006), which considers an evolutionary model that includes interaction matches, interaction mismatches, and protein duplications to define high-scoring pairwise alignments. On two-species alignment of fly and yeast, we also compare to DOMAIN (Guo and Hartemink, 2009), which incorporates information from domain interactions to produce pairwise alignments based on alignment of edges rather than nodes. On three-species alignment, we also compare to CAPPI (Dutkowski and Tiuryn, 2007), which identifies functional modules by reconstructing an ancestral network based on a network evolution model. On four-species alignment, we also compare to Græmlin (Flannick et al., 2006), which employs a progressive alignment approach that allows a large number of networks to be aligned together. Since our algorithm is the only one among these algorithms that can identify alignments within a single species, no comparisons are performed in this case.
We perform postprocessing to obtain larger modules from the graphlet alignments. In order to avoid exhaustive comparisons between all pairs of alignments when the number of alignments is large, we consider the alignments within each topology in search traversal order and merge all neighboring alignments that have exactly the same m-tuples in Gm at all search levels except for the last level. We merge each instance of an alignment with the corresponding instance of another alignment separately to obtain a module with larger instances.
We perform further postprocessing to reduce the number of modules and overlap between modules while increasing the module size. In order not to lose information from our exhaustive set of graphlet alignments, we merge some of these modules instead of removing them. We define the score of a graphlet alignment to be the average minus log e-value from BLAST of all aligned protein pairs, and the score of a module to be the best graphlet alignment score within the module. For each aligned protein, we construct a list of all the modules that contain the protein. We sort the module lists in decreasing order of the number of modules in each list and consider each module list in order. Within each module list, we sort the modules in decreasing order of the number of aligned proteins in the module, then in decreasing order of the number of aligned edges within the ordering, and finally in decreasing order of the module score. We iteratively consider the highest-ranked module in the list. We compare it to the next lower-ranked module and merge them if the merged module does not contain more than 100 aligned proteins within an instance and the overlap of aligned proteins between each pair of corresponding instances is at least 50% with respect to the average number of aligned proteins in the instance pair. We remove the lower-ranked module after merging and replace the highest ranked module with the merged module. We continue to compare the highest-ranked module with the next lower-ranked module until there are no more lower-ranked modules to compare, at which time we remove the module lists of all the aligned proteins that are contained in the highest-ranked module. We continue with the next module list until there are no more module lists left. Table 1 shows that the average size of the modules remains small after merging (although the maximum module size can be large).
To investigate functional relationships among aligned proteins within a module, we consider each species separately and use gene ontology (GO) annotations (Ashburner et al., 2000) to determine whether its aligned proteins tend to have related function. We evaluate its functional enrichment by applying the GO Term Finder (Boyle et al., 2004) to the aligned proteins and identifying significant GO terms with Bonferroni corrected p-value below 0.05 within the biological process ontology. We define the specificity to be the percentage of modules that have significant GO terms within each species. We map each significant GO term to all ancestral GO terms with a shortest-path distance of two from the root of the biological process ontology, which represents a subset of high-level GO terms that represent functional categories. We define the sensitivity to be the percentage of these ancestral GO terms that are mapped from at least one significant GO term.
Figure 7 shows that our algorithm was able to cover significantly more proteins. Except for a few cases, our algorithm usually had higher sensitivity and specificity than the other algorithms. Similar to NetworkBLAST and MaWISh, our algorithm returned a larger number of modules than the other algorithms. This is due to the condition that two modules have to satisfy the overlap threshold within each species in order to be merged, so that modules that occupy very different regions within some species will remain separate. Both the protein coverage and sensitivity decrease as the number of species increases. In general, the number of modules is highly correlated to the number of alignments. It is necessary to allow indels since otherwise protein coverage is much lower. While it is not feasible to use all BLAST hits, protein coverage can be improved by increasing the maximum number of top reciprocal BLAST hits allowed for each protein. When the number of instances is small, it is necessary to consider larger topologies to maintain high sensitivity and specificity.

Performance comparisons of GraphletAlign, NetworkBLAST-M, NetworkBLAST, MaWISh, DOMAIN, CAPPI, and Græmlin on single-species, two-species, three-species, and four-species alignments. For GraphletAlign, one indel is allowed and parameter settings are in Table 1. For the other algorithms, the same networks and the same BLAST e-value threshold are used.
To investigate whether completely different conserved regions can be obtained from different algorithms within each species, we consider each algorithm and retain only the modules in which all proteins within at least one species are not covered by another algorithm. Note that these modules can still overlap with proteins covered by the other algorithm within some other species. Figure 8 shows that our algorithm was able to identify some number of such modules with respect to each of the other algorithms, and the specificity of these modules remains high, while the other algorithms generally identified fewer such modules with respect to our algorithm.

Performance comparisons between GraphletAlign and each of the algorithms NetworkBLAST-M, NetworkBLAST, MaWISh, DOMAIN, CAPPI, and Græmlin on multiple species alignments when retaining only the modules in which all proteins within at least one species are not covered by another algorithm. The notation X\Y denotes the performance of algorithm X with respect to another algorithm Y. Each graph shows the same statistics as in Figure 7 except that they are only on the retained modules. The notation in
Figure 9 shows four graphlet alignments found by our algorithm in the yeast network that link together three mitogen-activated protein (MAP) kinase cascades in the pheromone response pathway, the filamentation/invasion pathway, and the cell integrity pathway, in which the correspondences between the MAPKK, MAPK, and MAP kinases are all in the correct positions (Gustin et al., 1998). Figure 10 shows a module found by our algorithm but not by NetworkBLAST-M that contains cold shock proteins nusA, infB, pnp, and rpsO (Bae et al., 2000), with a strong relationship of the extra protein fusA in H. pylori to cold shock response (Delgado et al., 2008).
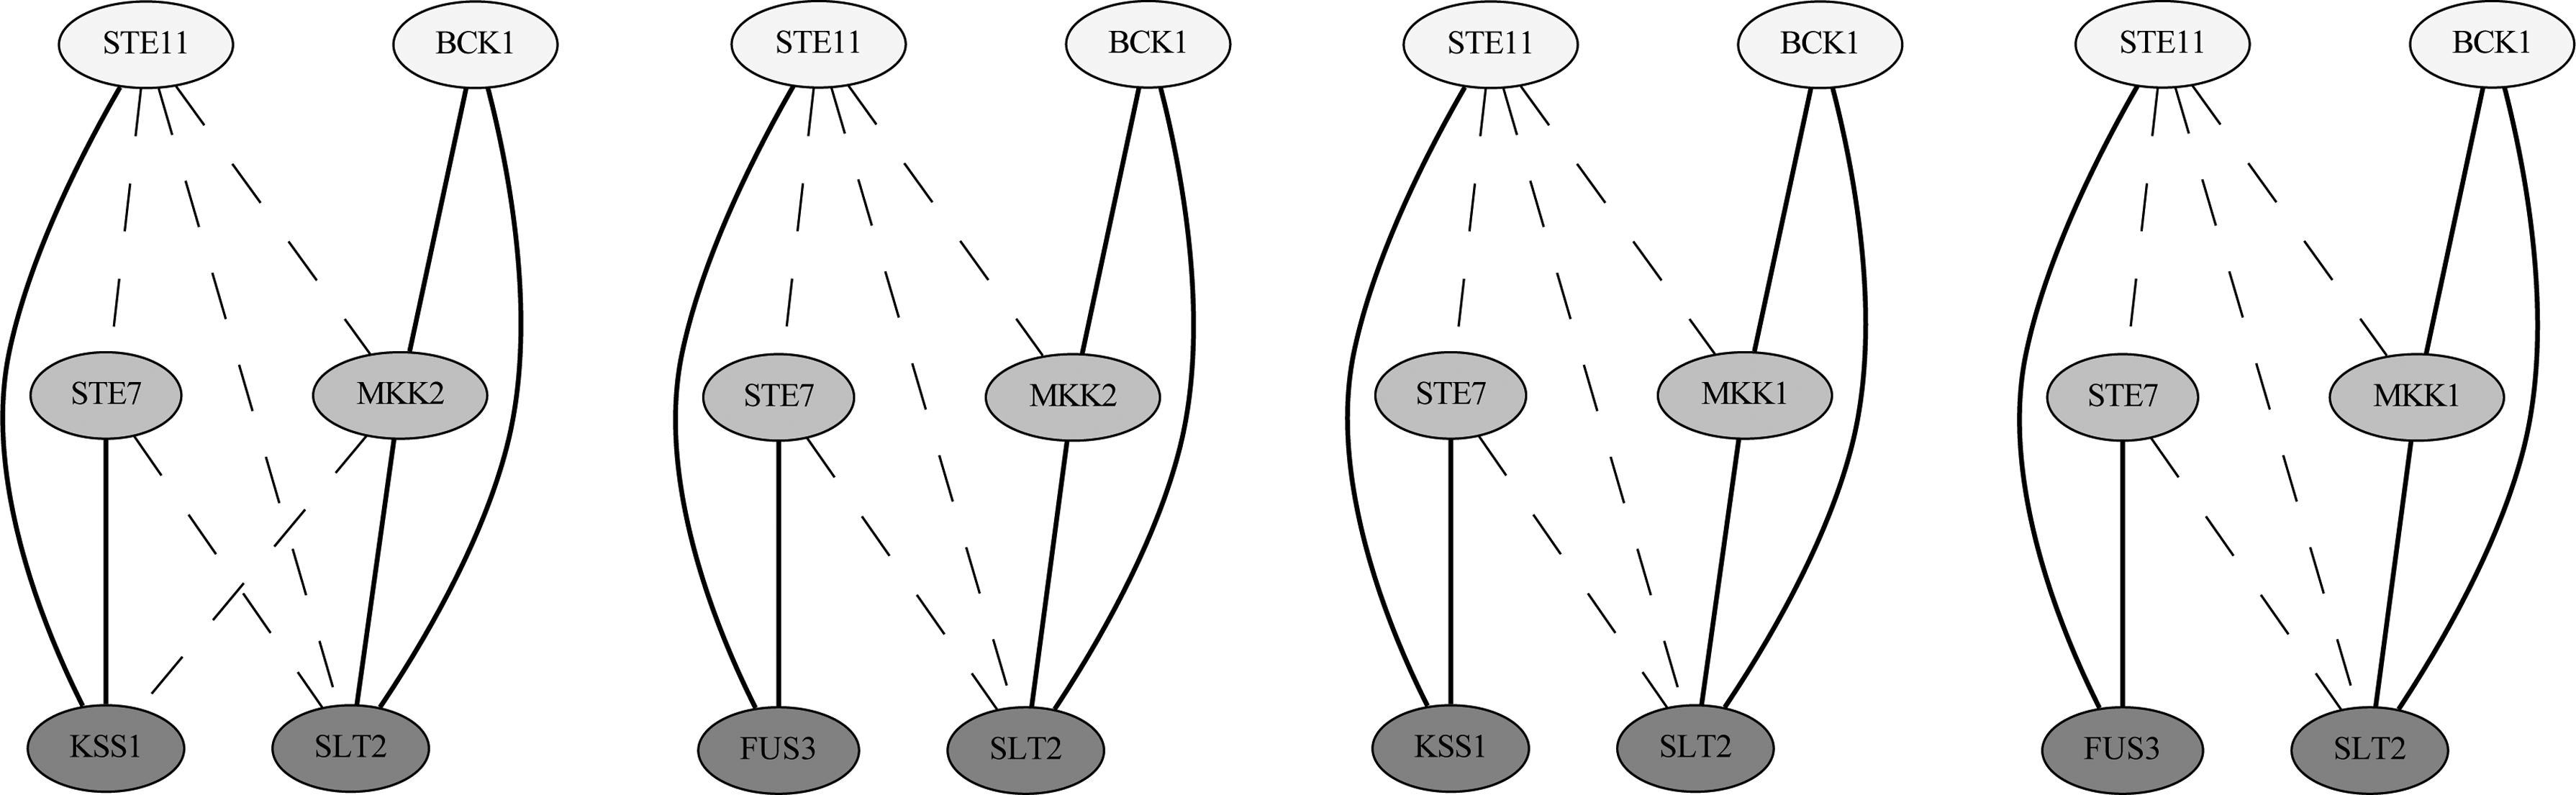
Mitogen-activated protein (MAP) kinase cascades found in the graphlet alignments of yeast with topology 3-3. Solid lines denote direct interactions, while dashed lines denote indirect interactions. Proteins within the same row are aligned together.
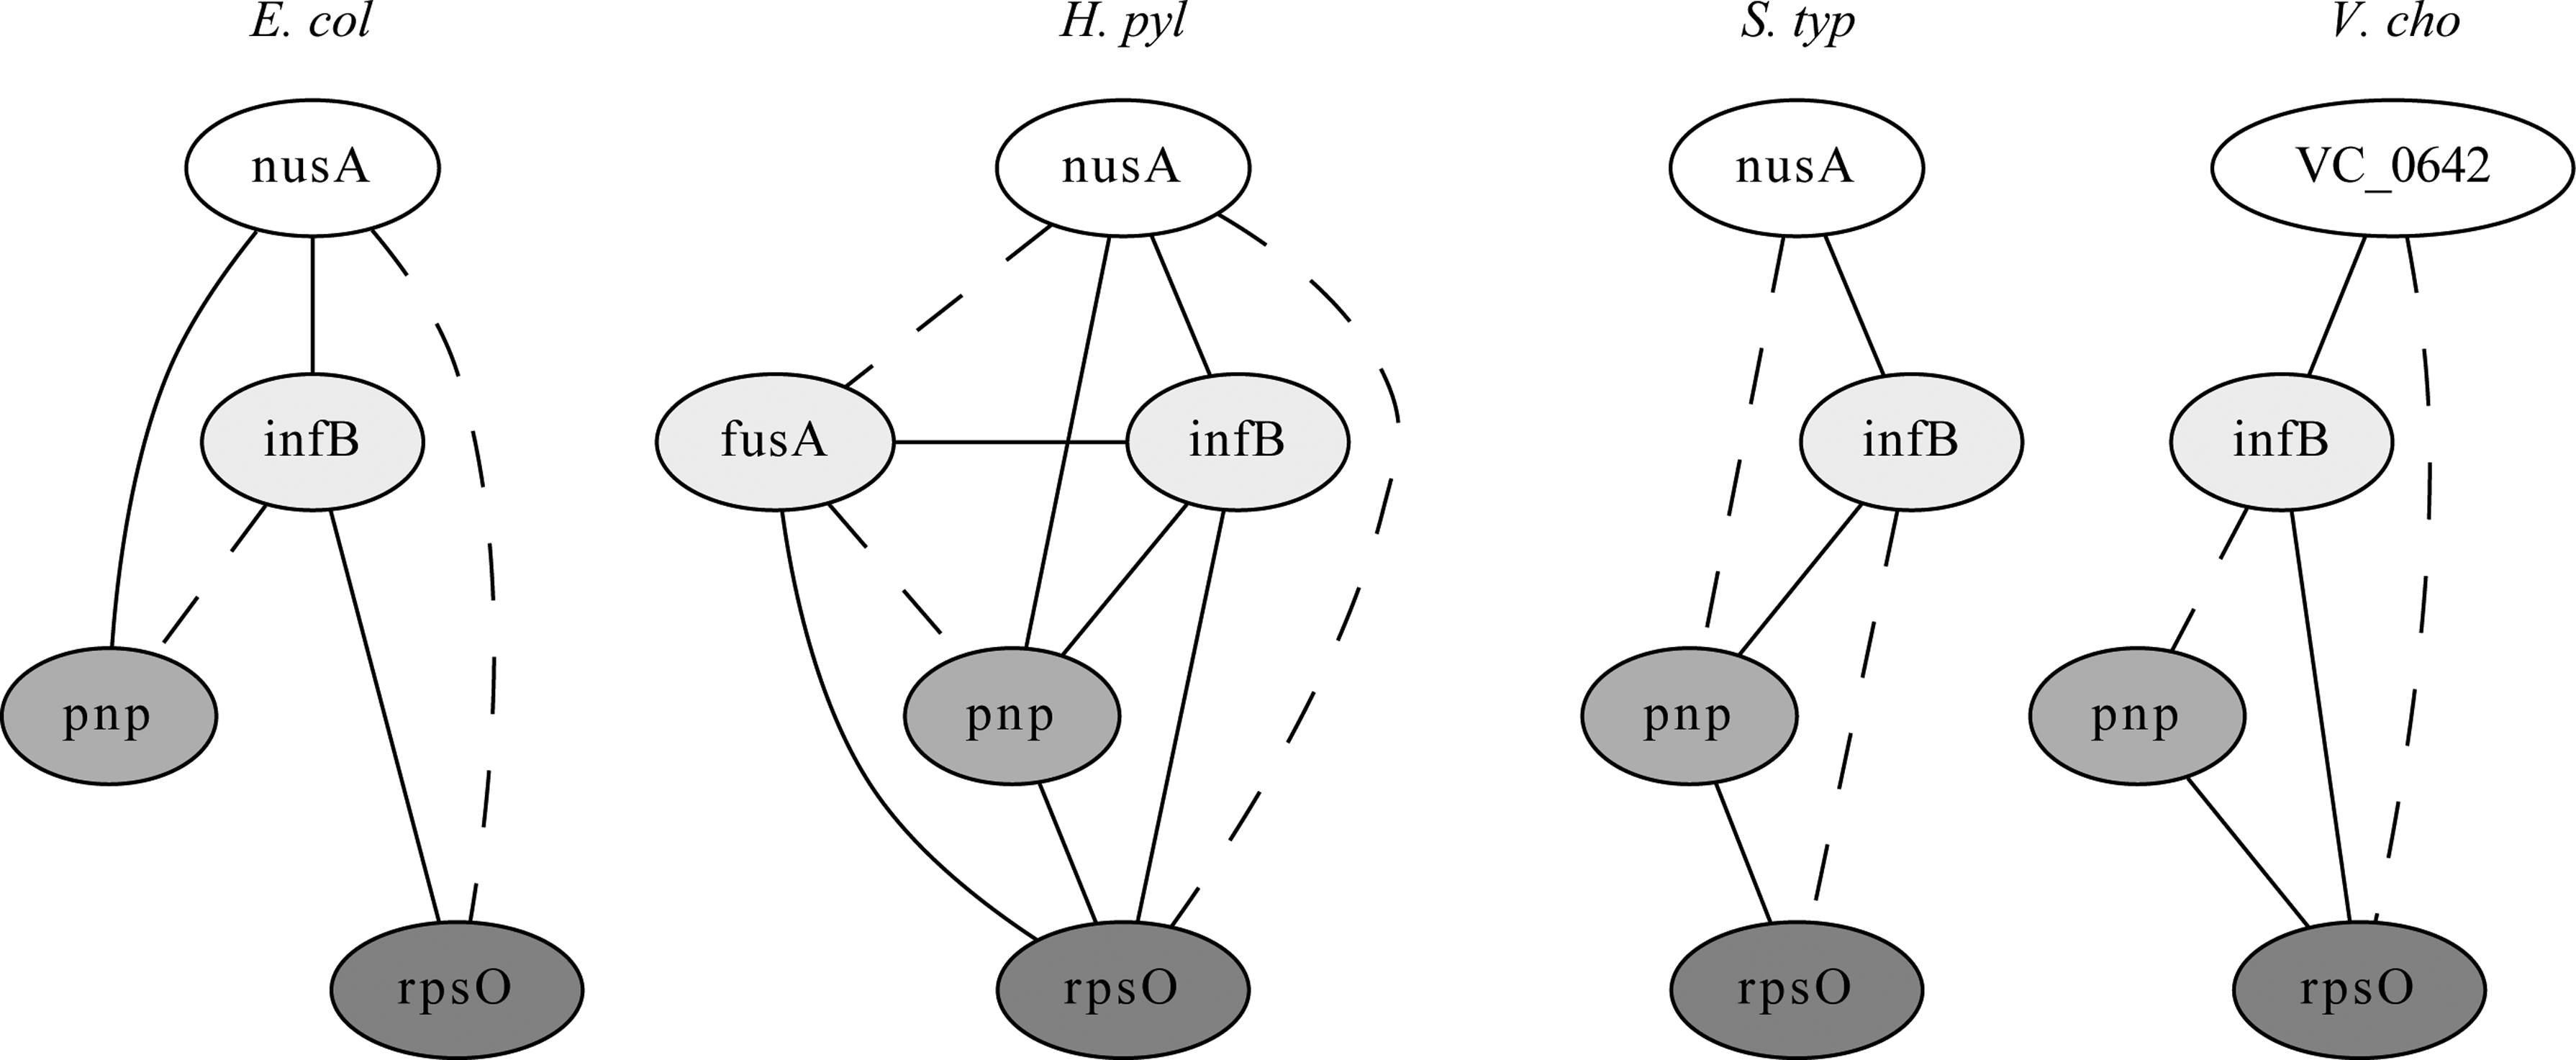
A module found by GraphletAlign but not by NetworkBLAST-M, which contains cold shock proteins. Solid lines denote direct interactions, while dashed lines denote indirect interactions.
4. Discussion
We have developed an algorithm for identifying graphlet alignments in protein interaction networks that complements existing algorithms on network alignments and network motifs. We show that it is possible to exhaustively enumerate all non-redundant alignments when the topology is small. Our strategy is successful in achieving a more complete coverage of the conserved functionally enriched modules within the networks while maintaining comparable or higher sensitivity and specificity. Among the algorithms that we have tested, our algorithm is the only one that can identify alignments within a single species.
Although our algorithm is slower than previous algorithms, its running time is approximately linear in the number of graphlet alignments that are generated, while the number of graphlet alignments is highly correlated to the maximum number of top reciprocal BLAST hits r allowed for each protein (Fig. 11). Figures 12 and 13 further show that both sensitivity and specificity increase as r increases, but they level off after r becomes large enough. As the maximum size of topology |V0| increases, sensitivity stays relatively constant while specificity gradually increases.
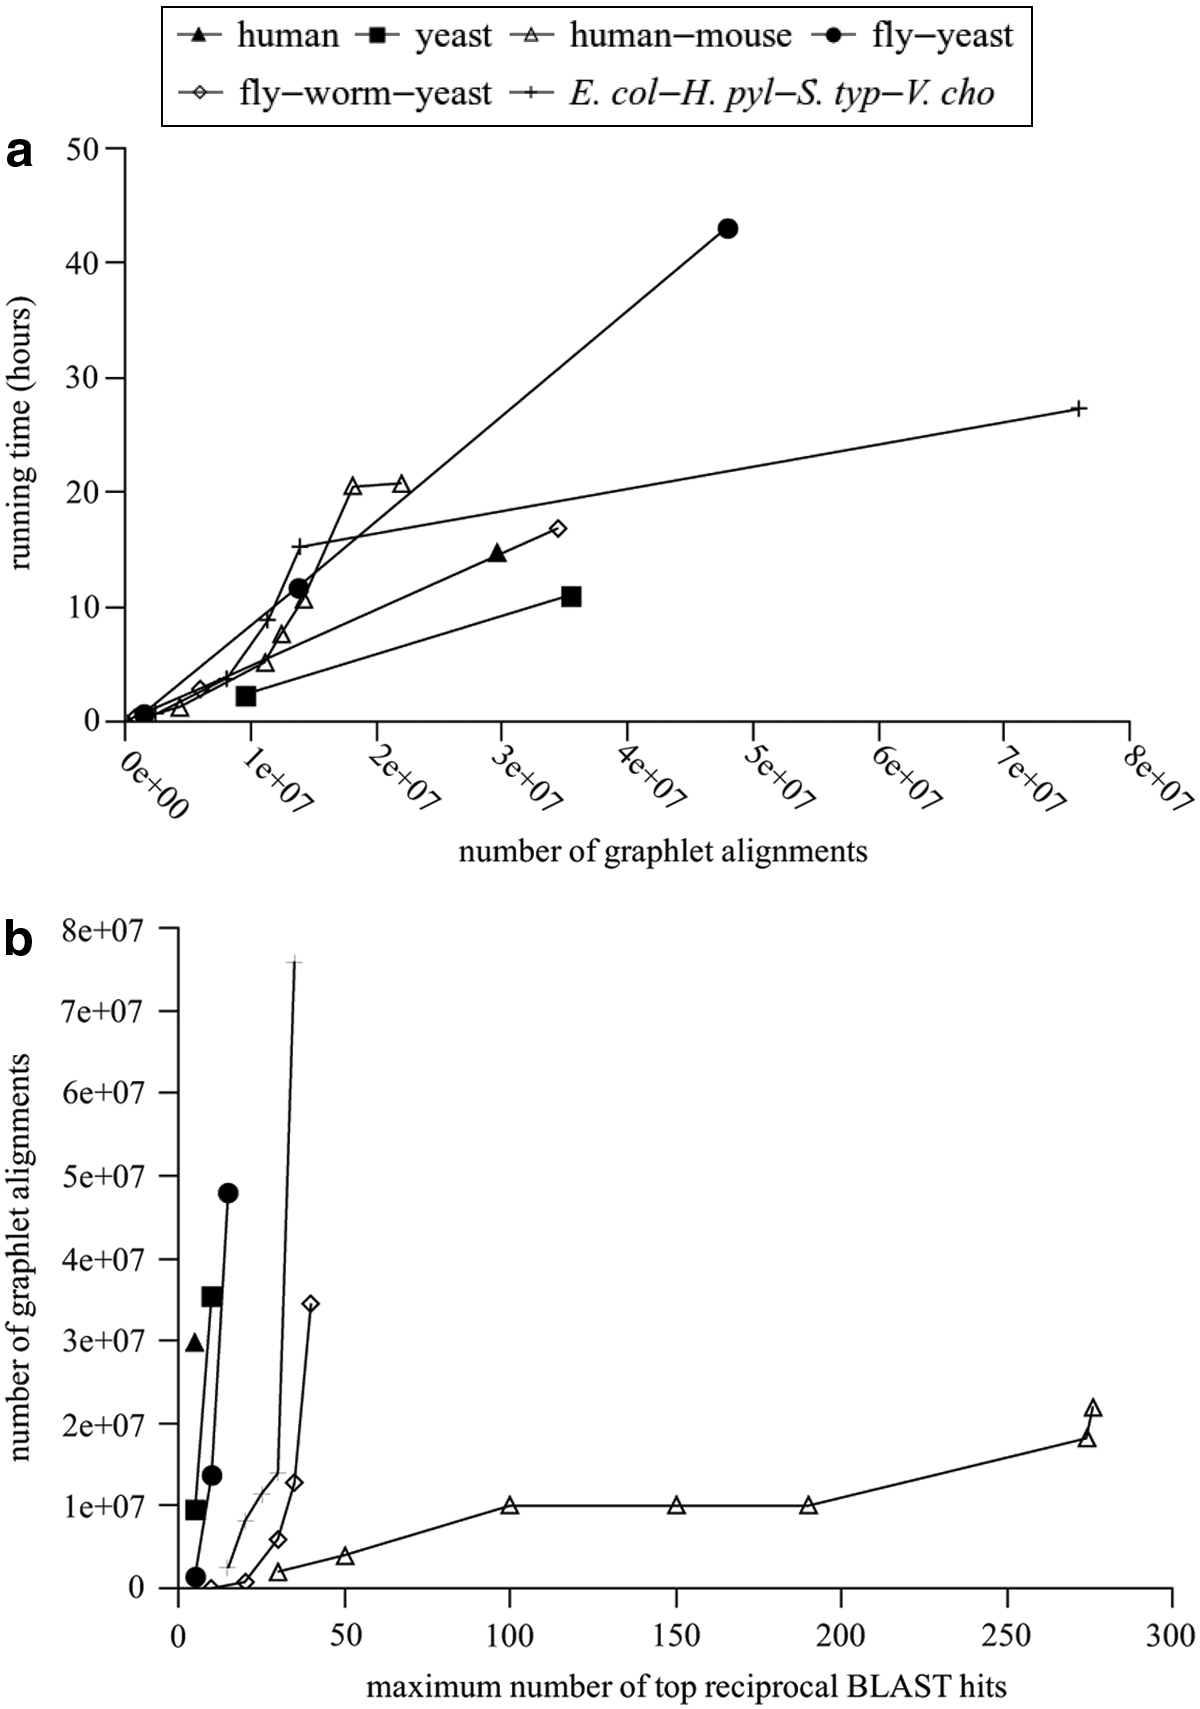
Computational statistics of GraphletAlign:
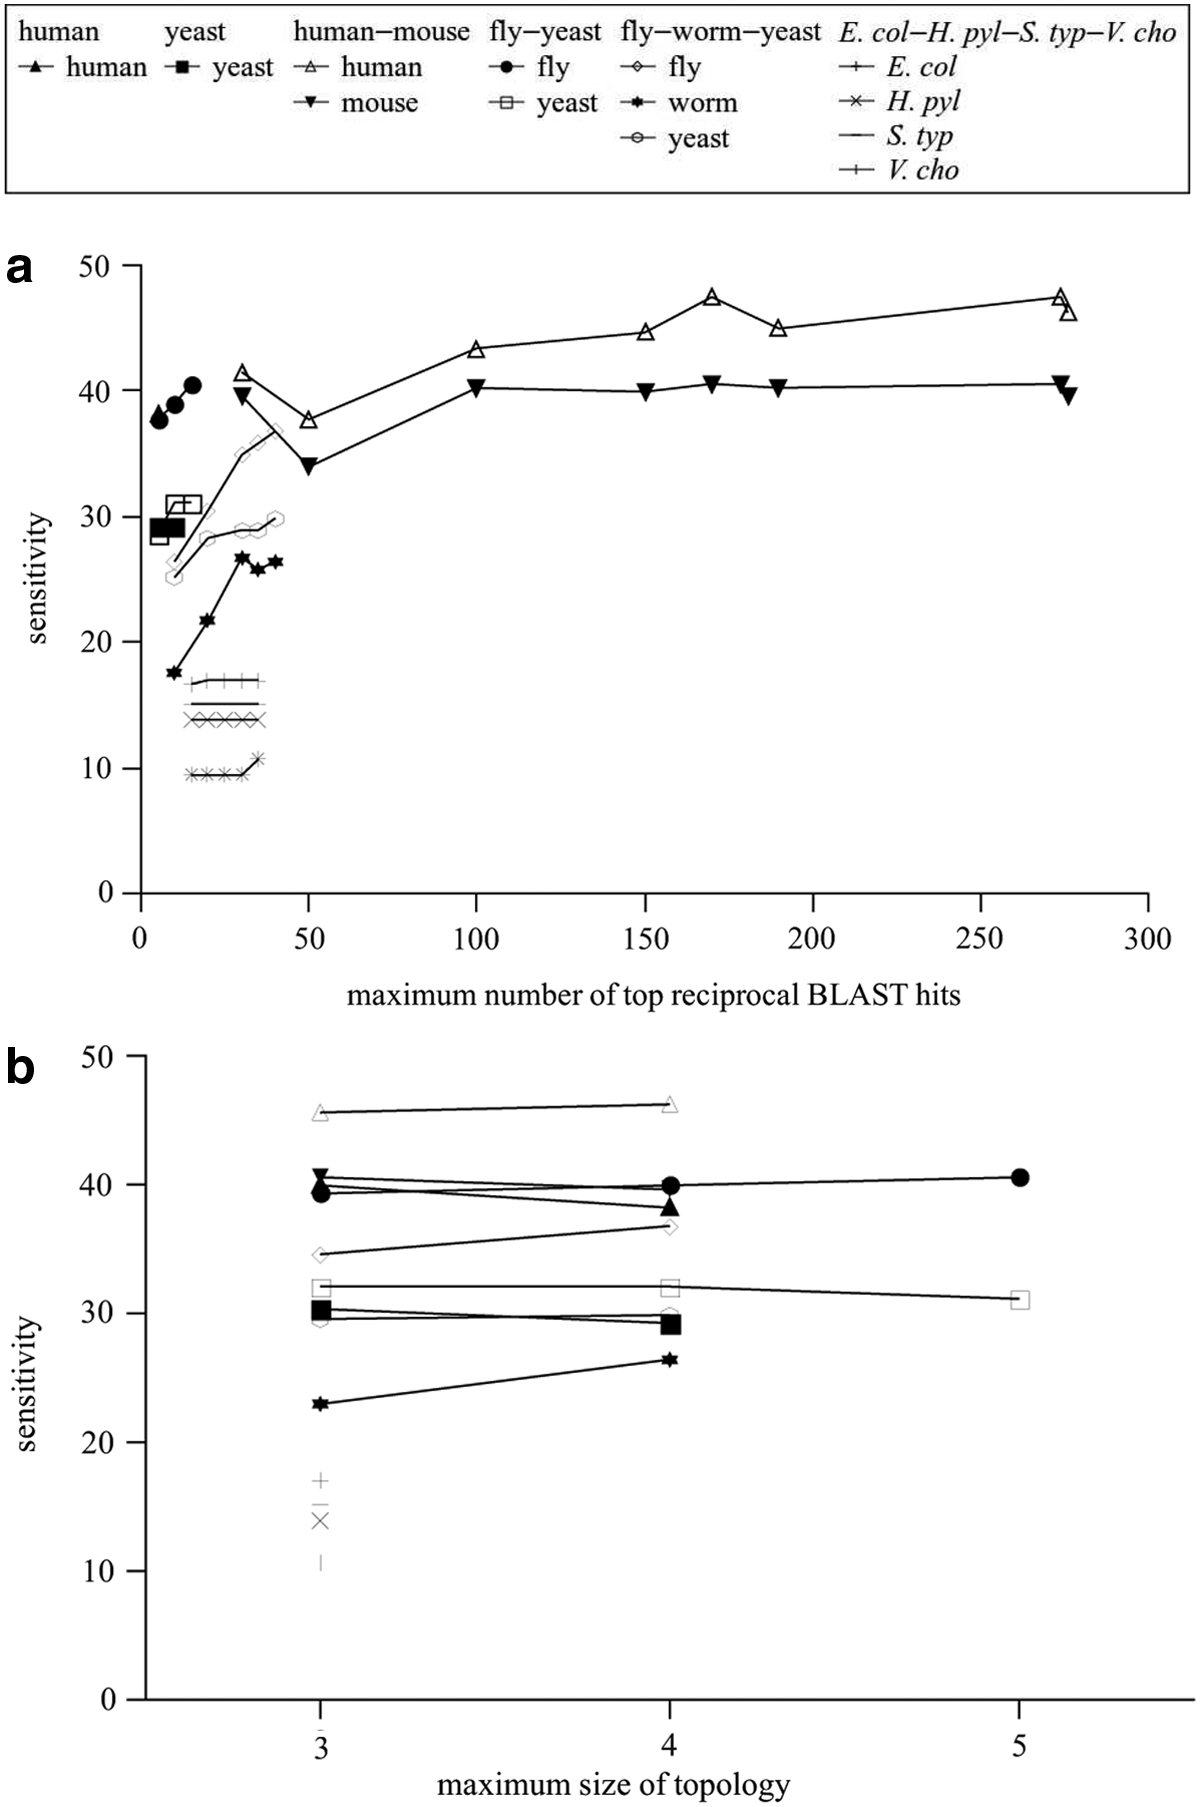
Sensitivity of GraphletAlign against

Specificity of GraphletAlign against
Our algorithm can be modified to handle other types of biological networks and directed graphs. Other than using BLAST, one can use COG (Tatusov et al., 1997) or Inparanoid (Remm et al., 2001) to define homologous proteins. Other methods such as phylogenetic profiling (Pellegrini et al., 1999) or functional linkages (Li et al., 2005) can be used to define proteins that have related function. Other than using GO terms, one can use resources such as KEGG Orthology (Kanehisa et al., 2004) to define functional categories.
Availability: A software program implementing the algorithm (GraphletAlign) is available online (Hsieh and Sze, 2014).
Footnotes
Acknowledgments
This work was supported by the National Science Foundation (MCB-0951120).
Author Disclosure Statement
No competing financial interests exist.