
Abstract
Abstract
1. Introduction
S
Neuromuscular disorders (NMD) are a group of muscular diseases that weaken the musculoskeletal system and hamper locomotion. They represent a perfect example of complex genetically heterogeneous disorders in which, as shown by Kaplan (2012) in his annual table, there are 681 diseases phenotypes associated with neuromuscular disorders, 321 causative genes, and 92 mapped loci awaiting gene identification.
In such heterogeneous genetic conditions, about 40% of patients do not obtain a molecular diagnosis by means of a traditional approach, because it would require a high number of gene sequences, which is expensive and time-consuming. As we will show in the following, NGS is useful for the molecular diagnosis (Nigro and Piluso, 2013), because it provides an easy analytic pipeline, together with high specificity and sensitivity. Furthermore, it reduces the overall execution time.
NGS techniques are currently used to sequence single genomes, and the process is still very expensive in terms of cost and time. In studies with a large number of patients, an alternative is represented by grouping individuals in pools to sequence their genomes together. This pooling technique can reduce time and cost, although a model is needed to predict whether the single nucleotide polymorphisms (SNPs) are sufficiently covered and still detectable in the experiment. On the other hand, pooled NGS is often theoretically more effective in mutation discovery, providing more accurate allele frequency estimates, as described by Futschik and Schlotterer (2010). Nevertheless, only few publications address the problem when pooled experiments are considered, and they are lacking of formal mathematical models that can assess the validity of the study. This is the case, for example, of the article by Calvo et al. (2011), who introduce high-throughput, pooled sequencing to identify mutations in NUBPL and FOXRED1 in human complex I deficiency. In that study, seven pools with a total of 103 cases and 42 healthy controls are involved. That study illustrates how large-scale sequencing, coupled with functional prediction and experimental validation, can be used to identify causative mutations in individual cases. The limit of that study is that only two genes are considered. They were able to confirm only the mutations in half of the 103 subjects, which might be related to the lack of a priori experimental design. Wang et al. (2011) are sequencing pooled mtDNA of multiple individuals for estimating allele frequency using the Illumina genome analyzer (GA) II sequencing system. Each pool includes 20 subjects that have been previously sequenced using Sanger sequencing. Each pool is replicated to assess variation of the sequencing error between pools. The proposed technique is not resilient to sequencing errors, thus providing a large number of false positives. Finally, Ding et al. (2012) compare four standard supervised machine learning algorithms to predict causative SNP in tumor/normal pooled NGS experiments. In order to evaluate these approaches (random forest, Bayesian additive regression tree, support vector machine, and logistic regression), features are constructed to represent 3369 candidate somatic SNPs from 48 breast cancer genomes, originally predicted with naive methods and subsequently revalidated to establish ground truth labels. The solution depends on third-party software packages and no planning of the experiment has been done.
The aim of this article is to describe an efficient method to detect rare and putative causative mutations in pooled experiments on 98 genes in a population of 128 patients for which a clinical diagnosis of muscular disease was available. The exon regions of the 98 genes have been analyzed by means of the Agilent HaloPlex Target Enrichment system (Agilent, 2014). In a preliminary phase, loci not containing probable mutations are filtered by means of decision rules. Then, features of 6502 candidate causative mutations are constructed and subsequently used to build a classification model. The last part of the computational procedure uses this model to predict the potential mutations, which are ranked and filtered again with respect to the prediction of SIFT (Ng and Henikoff, 2003), which ensures the damage of the mutation on the coded protein.
The article is organized as follows. The following section deals with materials and methods for managing NGS data, DNA preparation and protocols, target genes, and methods for SNP discovery. In Section 3, results are described and compared with those obtained by other methods. In Section 4, results are discussed. Finally, in Section 5, some concluding comments and open problems are addressed.
2. Materials and Methods
2.1. DNA preparation and pooling
A total of 128 DNA samples from patients with a clinical diagnosis of neuromuscular disease have been extracted using standard procedures. DNA quality and quantity have been assessed using both spectrophotometric (Nanodrop ND 1000, Thermo Scientific Inc., Rockford, IL) and fluorometry-based (Qubit 2.0 Fluorometer, Life Technologies, Carlsbad, CA) methods. In all, 8 pools of 16 different samples each have been created. Each of the first 8 pools contains a control sample with known mutations. Pools are replicated using two samples from each original pool, for a total of 16 pools. The pool organization is reported in Tables 1 and 2. Each row represents a pool, where samples are numbered from 1 to 128.
The control samples are indicated in bold.
The control samples are indicated in bold.
Since a control sample with a known heterozygous mutation is present in each pool, this means that the control variant is present in 1 out of 32 alleles, that is, approximately 3.12% of reads.
According to manufacturers instructions (HaloPlex Target Enrichment System For Illumina Sequencing, Protocol version D, August 2012, Agilent Technologies, Santa Clara, CA) for each pool, 200 ng of genomic DNA have been digested in eight different restriction reactions to create a library of fragments. These fragments have been hybridized for 16 hours to specific probes, containing index sequences for Illumina sequencing and able to direct circularization of the target DNA fragments. After the capture of biotinylated target DNA using streptavidin beads, nicks in the circularized fragments have been closed by a ligase. Finally, captured target DNA has been eluted by NaOH and amplified by Polymerase Chain reaction (PCR). Amplified target molecules have been purified using Agencourt AMPure XP beads (Beckman Coulter Genomics, Bernried am Starnberger See, Germany). Enriched target DNA in each library sample has been validated and quantified by microfluidics analysis using the Bioanalyzer High Sensitivity DNA Assay kit (Agilent Technologies) and the 2100 Bioanalyzer with the 2100 Expert Software.
2.2. Target genes
A literature search has identified the 98 genes used in the present analysis for a total of 486480 bp. All the genes investigated are causative of muscular dystrophies or congenital myopathies and are listed in Kaplan's table (Kaplan, 2012).
2.3. SNP discovery
2.3.1. Decision rules
The proposed computational procedure consists of two parts: a rule-based filtering and a supervised classification algorithm. The first is devised to eliminate the loci where there is no evidence of an SNP, whereas the latter is devised to predict the positions in which there might be a mutation. We decided not filter out the loci listed in the single nucleotide polymorphism database (dbSNP), because although already known, some of them are not related with specific diseases. In the first step, for each position the frequencies of the four nucleotides aligned in all reads on that position are computed.
Since some patients can be represented in the experiment with a quantity of DNA greater than the others, we applied the following reasoning. The contributions of DNA from each sample are equally divided in two groups. Half of the patients have an average contribution equal to one and the other half contributes in mean two. This situation can be formally represented by means of a mixture of two generalized beta distributions, respectively, with support [0.35, 1.65] and [1.35, 2.65] and both with parameters α = 3 and β = 3.
The generalized beta random variable Xj with support [cj, dj] and parameters αj and βj has probability density function
where B(αj, βj) is the beta function, and it is equal to
where, for
Finally, we required an average of 20 reads for each individual in each pool covering every locus. Taking into account that the average contribution of DNA of each patient is equal to 1.5, this means that we select only the loci with a coverage at least equal to 20 * 1.5 * 16 = 480 ≃ 500 (we use 500 to approximate 480). The obtained dataset is then classified by means of supervised techniques.
2.3.2. Classification
The problem of detecting an SNP can be posed as a classification problem. Once a classification model is determined, each position can be tested and classified as a probable mutation or not. The ingredients to build a classification model are: a set of training positive/negative mutations, described by some features, and a classification algorithm. The next step consists in constructing the features used in the learning phase of the classification procedure. The supervised classification is based on a training and a testing set. In the training phase, each classifier learns from the data on the basis of some features. In this study, taking into account that the aim is to predict causative mutations, we construct 19 features mainly related to the base frequency, the mapping quality, and the base quality. In details, for each position we consider the following: the frequency of each base (‘T’, ‘G’, ‘C’, ‘A’); the minimum, the maximum, and the average mapping quality; and the minimum, the maximum, and the average base quality related to each base. The features related to base quality play an important role, as they indicate if the mutated base is reliable.
A binary classification problem can be formulated as a generalized eigenvalue problem. This idea was firstly introduced by Mangasarian and Wild (2006) to generalize support vector machines (SVM) (Vapnik, 1982), a de facto standard classification algorithm. This generalization has been devised to overcome some issues related to the computational complexity of SVM. The main idea is to describe each class with a line that is as close as possible to the points of that class and the farthest from the other class (Fig. 1).
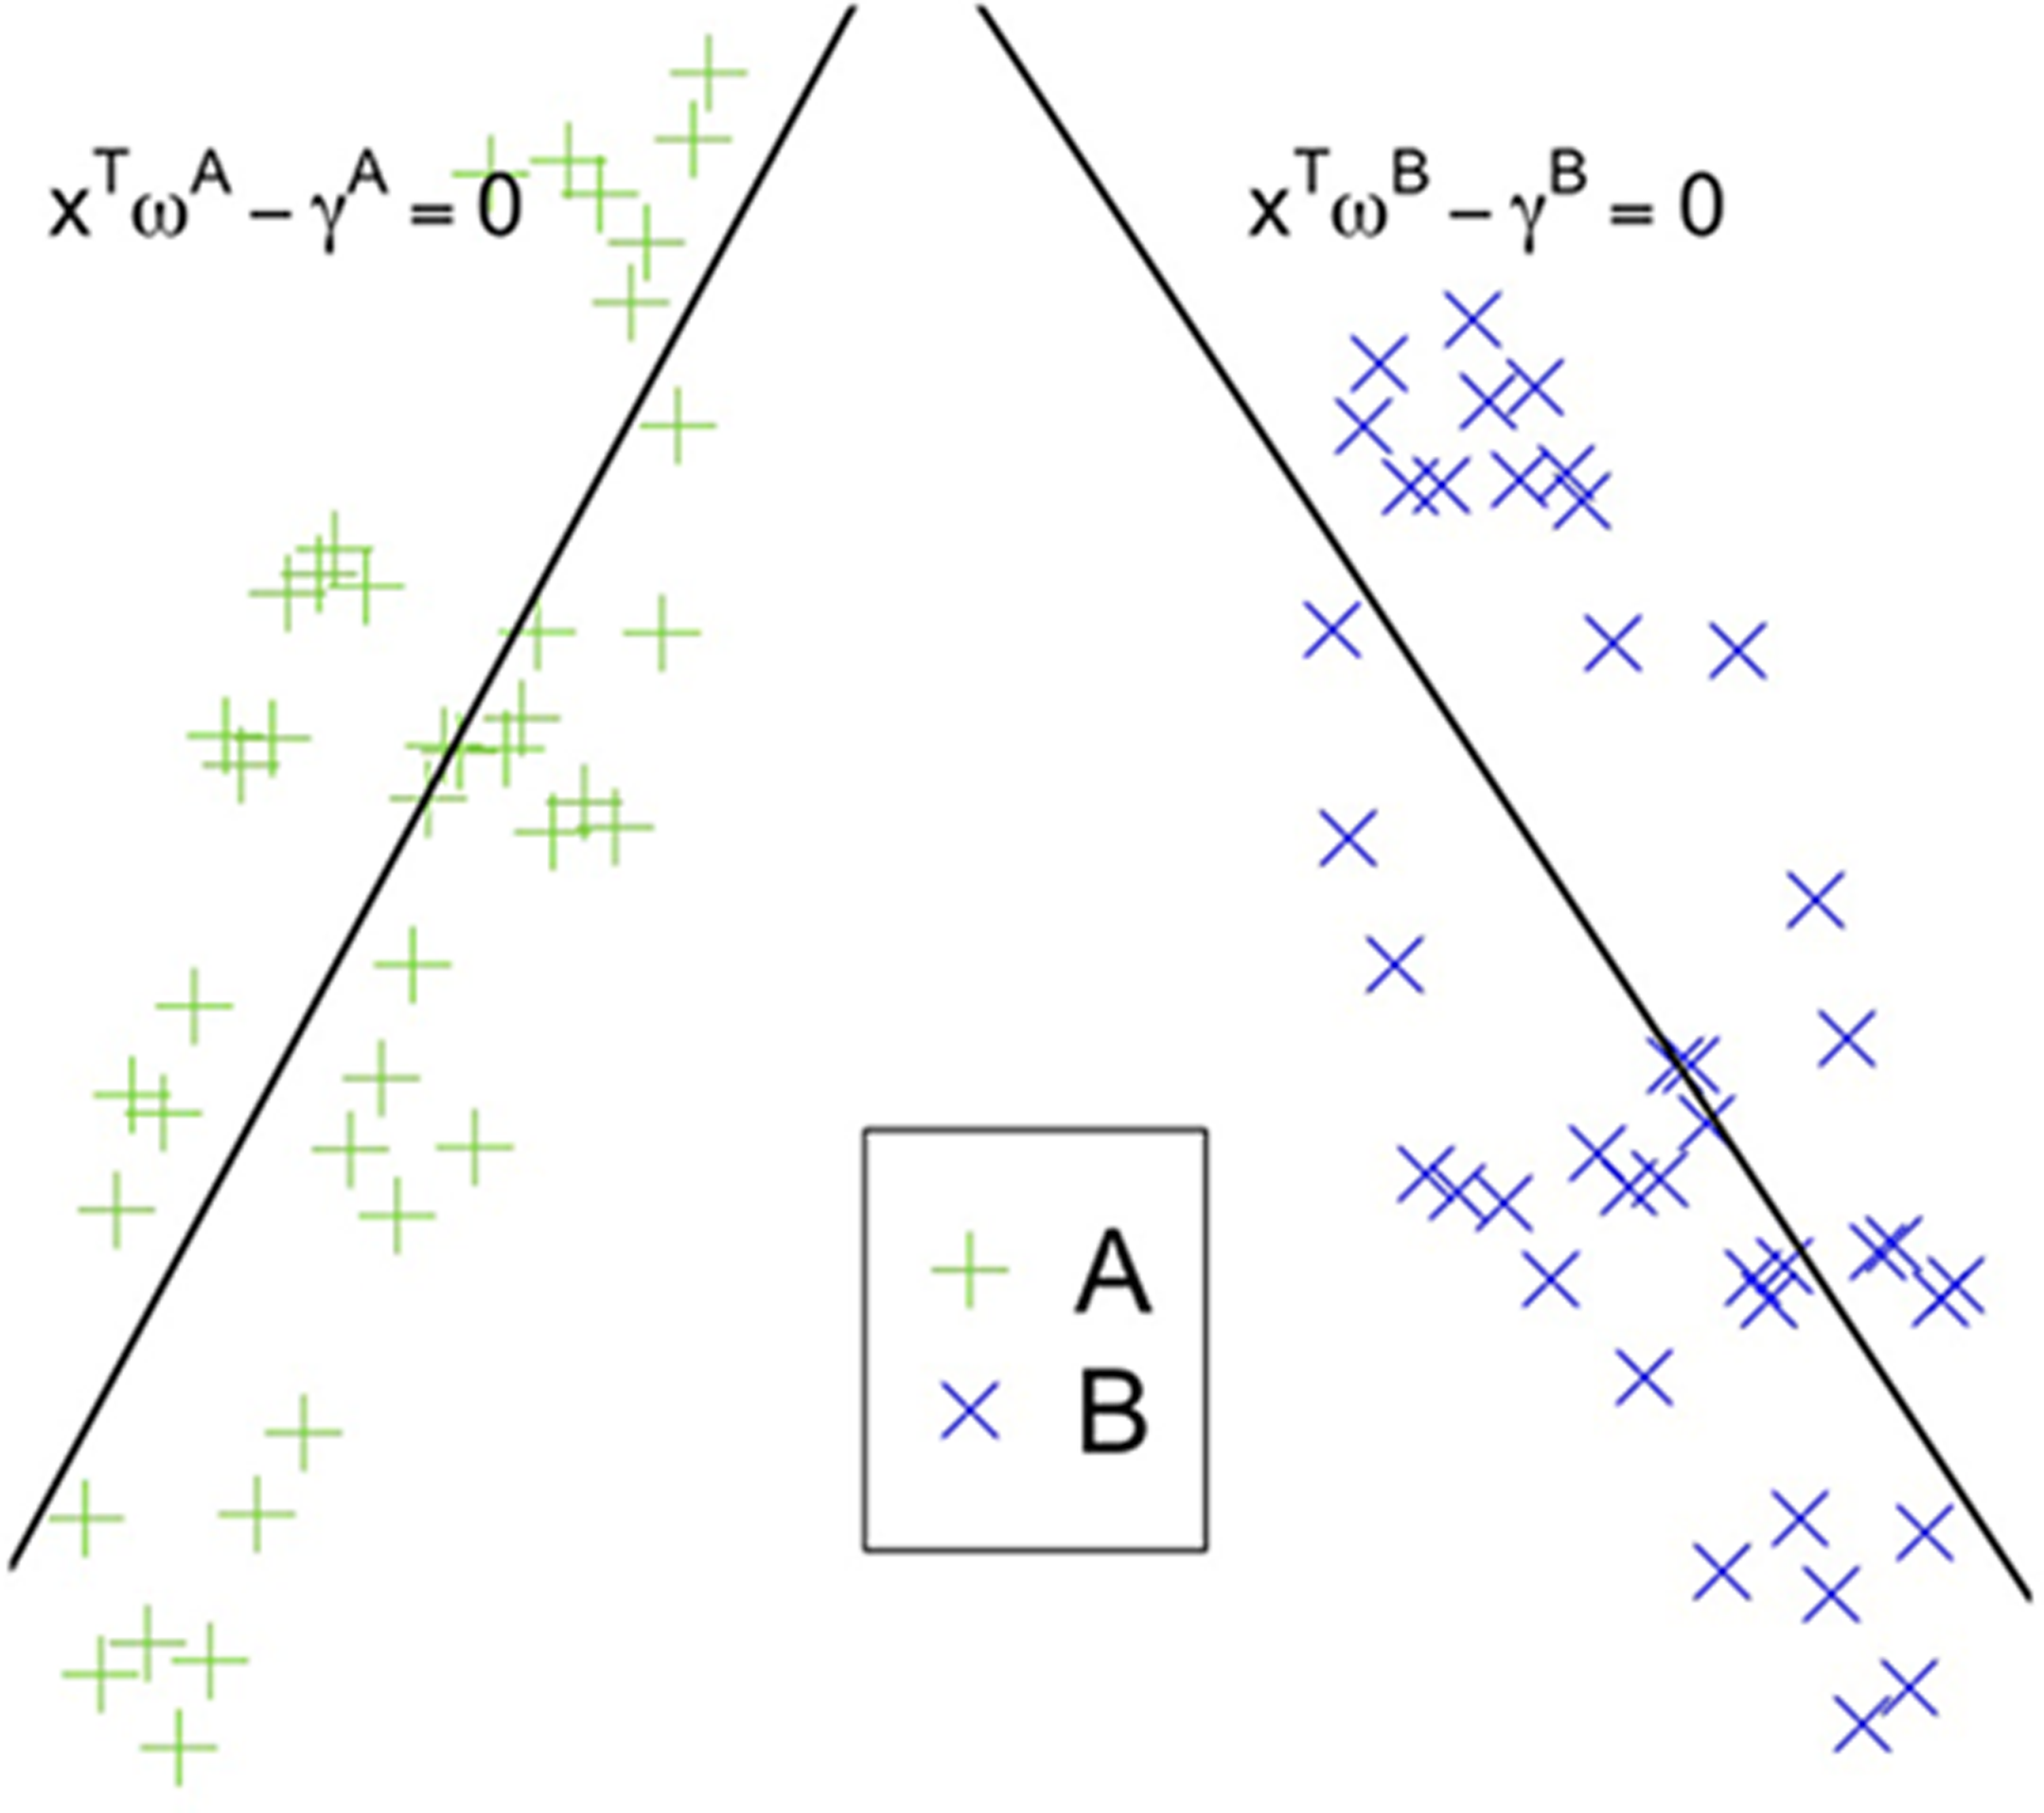
Example of two classes, A and B, and the planes obtained by generalized eigenvalue proximal SVM (GEPSVM).
Let A and B be the matrices containing one point from one class in each row. A and B will have the same number n of columns (features) and as many rows as the number of points in the corresponding class. Let xT ω − γ = 0 be a plane in the n-dimensional feature space, where ω is the vector of the coefficients and γ the intercept. The solution to the following optimization problem:
provides the coefficients ωA and constant γA of the plane xT ωA − γA = 0 describing class A. The minimization of the inverse of the same quotient provides the solution (ωB, γb) for class B. To assign label for a new point xu, for which the class is unknown, we use the following formula:
which assigns the point to the class with the closest plane. The algorithm used to compute the classification model is based on the work of Guarracino et al. (2007), which introduces a regularization technique to speed up computation (ReGEC). Cifarelli et al. (2007) introduce an incremental version of the algorithm, which can be used in the case of a large training set.
3. Results
3.1. Benchmark dataset
The experiments were conducted using a benchmark dataset. The dataset contains 205 positions biologically verified with Sanger sequencing. Among those, 148 were found to contain mutations, whereas the remaining 57 were false positive. The BAM files were obtained filtering out all reads not covering the selected positions.
3.2. Other tools
In this section, we briefly review four software tools that can be used to analyze pooled NGS data and that are de facto standard in SNP detection. GATK is a software package developed at the Broad Institute to analyze next-generation data (DePristo et al., 2011; McKenna et al., 2010); it is composed of different software packages, called walkers. Among the walkers offered, the most important is variant discovery and genotyping. The GATK was designed using the functional programming paradigm of MapReduce (Dean and Ghemawat, 2008).
SNVer is a software tool for calling common and rare variants in pools of individuals (Wei et al., 2011). The software can analyze loci with any (low) coverage. The depth of coverage will be quantitatively taken into account in the detection.
FreeBayes is a Bayesian genetic variant detector software designed to detect small polymorphisms such as SNPs, Indels, and multi-nucleotide polymorphisms (MNPs) smaller than the length of the short reads obtained in the sequencing (Garrison and Marth, 2012).
CRISP uses a cross-pool comparison approach to distinguish sequencing errors from rare variants. It can be used to evaluate pooled sequencing datasets (human and bacterial) generated by the Illumina sequencing platforms (Bansal, 2010).
We check the positions of the benchmark dataset of mutations by means of the above software. GATK recognizes 104 out of 148 as true positive and 44 as false negative. Only 4 out of 57 are classified as false positive. The number of false negatives obtained with FreeBayes is 82 out of 148, while there are no false positives. SNVer has 0% specificity and CRISP accuracy is 50% (less than null classification). The values of accuracy, sensitivity, and specificity are represented in Figure 2.
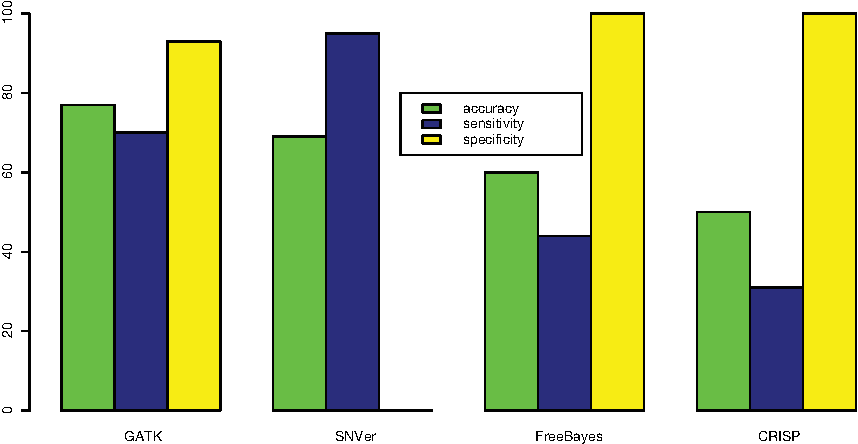
Accuracy, sensitivity and specificity of GATK, SNVer, FreeBayes and CRISP.
3.3. Decision rules results
In the fist step of the computational procedure, the 486480 exon positions are filtered by selecting only those whose coverage is greater than 500, one base frequency in the interval [1.1%, 8.3%] and two bases below 1%. In addition, each exon position has to be replicated in two pools, one of the original group and one of the replicated group. This allows for an imprecision between two samples.
In Figure 3, some positions fulfilling and not fulfilling decision rules are reported. In particular, blue bars are associated with bases whose frequency is lower than 1%. Red bars refer to bases with frequency in the interval [1.1%, 8.3%] and green bars to bases with frequency greater than 8.3%. Hence, each position corresponds to a possible mutation if it is characterized by two blue bars, one red, and one green; is replicated in the two pools; and its coverage is greater than 500. In details, positions 152990583, 152990660, and 152990694 of gene ABCD1 and chromosome X correspond to possible mutations. Position 152991046 and position 152991050 are not selected by decision rules since both have coverage lower than 500. Furthermore, the last one is also characterized by two green bars. Hence, there are not two bases with frequencies lower than 1%.
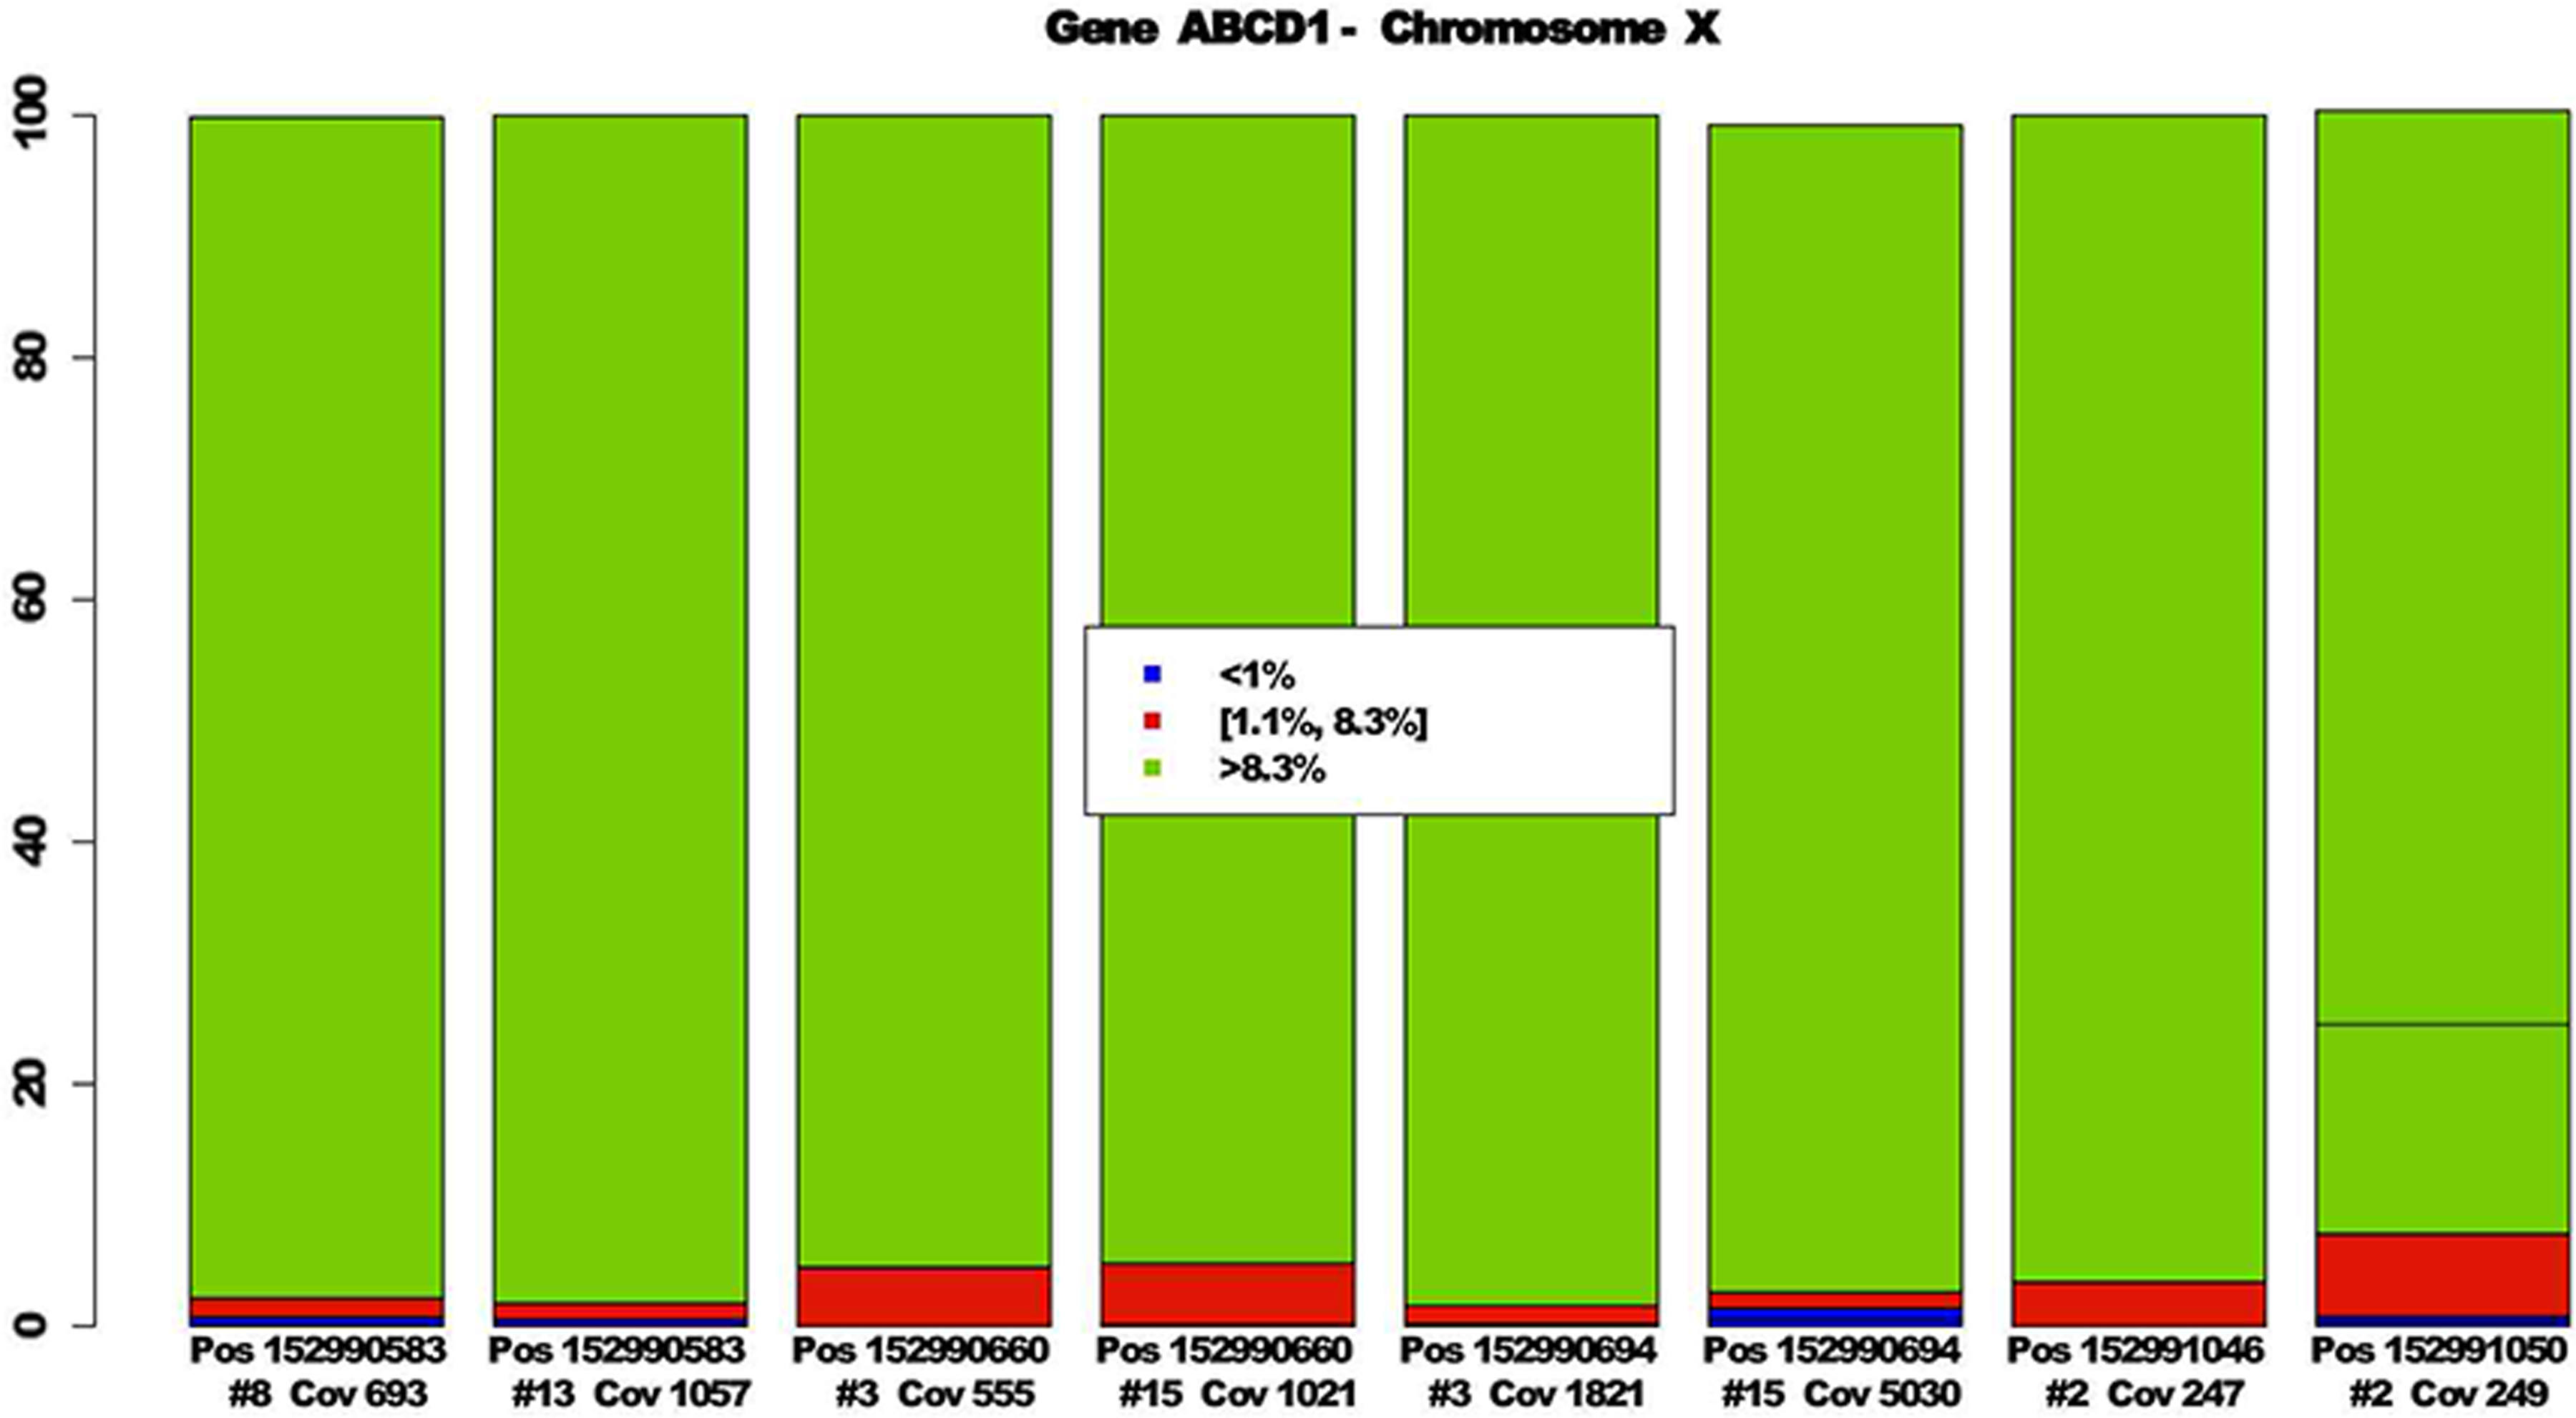
Barplots of bases related to eight positions of gene ABCD1 and chromosome X.
Three positions associated with possible mutations, according to the above rules, are reported in Table 3. In detail, position 152990560 (reported also in Fig. 3) is characterized by a coverage equal to 555; two bases, G and A, below 1%; and base T equal to 4.9% in pool 3. In addition, this position is replicated in pool 15. An analogous situation is present in position 100326823 of gene AGL (chromosome 1) and position 22271787 of gene ANO5 (chromosome 11). By means of the described filtering rules, 6502 mutations have been selected.
The values in the interval [1.1%, 8.3%] are indicated in bold.
3.4. Classification results
In order to check the adequacy of the ReGEC algorithm, we use the set of 148 true mutations and 57 nonmutation positions (confirmed previously by biologists) as a training set. By means of a 10-fold cross-validation analysis we obtain robust quantitative accuracy measurements of sensitivity and specificity on labeled training data. For this classifier we obtain an accuracy equal to 94.25%, a sensitivity equal to 93% and a specificity equal to 98%. Furthermore, by comparing ReGEC with other classifiers, it results better in terms of accuracy, sensitivity, and specificity. In detail, we consider support vector machines using sequential minimal optimization (SMO) (Platt, 1998), Bayesian network classifier (Friedman et al., 1997), k-nearest neighbours (k-NN) (Fix and Hodges, 1951), classification via clustering (simple k-means), multivariable functional interpolation and adaptive networks (Broomhead and Lowe, 1988), simple logistic (Landwehr et al., 2005; Sumner et al., 2005), complement naive Bayes (Rennie et al., 2003), Bayesian logistic regression (Mitchell, 1997), and primal estimated sub-gradient solver for SVM (Pegasos) (Shalev-Shwartz et al., 2007). The results are reported in Figure 4.

Accuracy sensitivity and specificity of different classification methods.
By means of ReGEC we predict positions related to possible mutations. The set of 148 true mutations and 57 nonmutation positions is used as a training set. The 6502 positions obtained by decision rules are tested, and 1300 are predicted as mutations. We consider only the loci corresponding to mutations in both pools. These predicted mutations were ranked using their distances from the plane of the belonging class. In further detail, for each position xu we construct the following rank
where the numerator is the distance of xu from the belonging class (+) and the denominator of the ration is the distance from the nonbelonging class (−). The ranked list is used by biologists to biologically validate whether loci are true mutations.
3.5. SIFT
In this section a structural analysis on the predicted mutations is conducted using SIFT (sorting intolerant from tolerant). SNP studies identifies amino acid substitutions in protein-coding regions. Each substitution has the potential to affect protein function. SIFT is a program that predicts whether an amino acid substitution affects protein function. SIFT can distinguish between functionally neutral and deleterious amino acid changes in mutagenesis studies and on human polymorphisms (see, for more details, Ng and Henikoff, 2003). Among the 1300 positions associated with possible mutations, 600 have been identified by SIFT as 100% damaging, that is, as causative mutations.
3.6. Detection rate
The biologists start to check these mutations following the order of ranking and considering only exon positions. Furthermore, 142 positions not containing those used in the training set have been analyzed. In detail, 114 mutations have been confirmed, including the control mutations, and 28 mutations have not been confirmed (false positive). This implies a detection rate equal to 80.3%, as reported in Figure 5.

Detection rate.
In detail, the predictive positive value—that is, the fraction true positives divided by the sum of true and false positives—reported on the y-axis and the x-axis represents the number of positions classified as mutations.
4. Discussion
In this article we consider pooled next-generation sequencing data. We propose a computational procedure to identify and classify variants potentially related to human diseases. This procedure consists of two parts. The first step involves decision rules, and in the second step, we use a supervised classifier; we focus on causative mutations for muscular diseases. Taking into account the distribution of each patient contribution in a pool and the percentage of reads associated with a mutation, we construct some decision rules for filtering the 486480 loci. We get 6502 loci corresponding to possible mutations.
Using the set of 148 biologically verified mutations and 57 nonmutation positions as the benchmark dataset, we compute the accuracy, sensitivity, and specificity of the de facto standard SNP software: GATK, SNVer, FreeBayes, and CRISP. The best accuracy of these methods on the benchmark dataset is 77% (GATK), with a specificity of 93%. In order to check the adequacy of that classifier we compare different classification algorithms by means of a cross-validation procedure using the training set previously mentioned. Results show that among eleven de facto standard supervised algorithms, ReGEC has the highest accuracy, sensitivity, and specificity. By means of the ReGEC algorithm, we test the 6502 positions obtained in the filtering step, and we predict 1300 possible mutations. These predicted mutations were ranked using their distances from the plane of the belonging class. Predicted mutations closer to the class of training mutations are more similar to these and therefore have higher probability to be SNPs. These positions were then tested with SIFT to predict whether a mutation would damage protein structure and therefore affect protein function, reducing the total to 600 possibly causative mutations. The biological checking of these mutations follows the ranking order, and 114 mutations have been confirmed, including the control mutations, and 28 mutations have not been confirmed (false positive) so far.
Results show that when biological evidence exists of loci containing true and false SNP, these data can be used to build a supervised classification model predicting mutations with high detection rate. Furthermore, this method also provides a ranked list of possible SNPs, thus providing a useful tool to help decide where to focus attention first. Overall, since sequencing pooled samples is certainly a cost-effective method to detect variants, the bioinformatic tool described in this article provides a powerful procedure to this aim. In particular, this methodology represents a robust option for the analysis of a high number of samples in genetically heterogeneous diseases.
5. Concluding Remarks
Since standard tools are not appropriate to discover SNPs when pooled NGS experiments are considered, we propose a computational procedure to identify and classify variants potentially related to human diseases. This procedure is divided in two phases: First, the loci are filtered by means of decision rules, and second, part positions related to possible mutations are predicted by using a supervised classification. In the near future, it will be interesting to construct more features related with the data and to find integrated software solutions.
Footnotes
Acknowledgments
The authors would like to thank T. Giugliano, M. Iacomino, A. Torella, A. Garofalo, C. Pisano, F. Del Vecchio Blanco, and G. Piluso (Department of Biochemistry, Biophysics and General Pathology, Second University of Naples); M. Mutarelli, V. Singh Marwah, and M. Dionisi (TIGEM); and the Italian LGMD network. This work has been partially funded by the Italian Flagship project Interomics and by project PON02_00619.
Author Disclosure Statement
The authors declare that no competing financial interests exist.