
Abstract
Abstract
Liver cancer is one of the leading causes of cancer mortality worldwide. Hepatocellular carcinoma (HCC) is the main type of liver cancer. We applied a machine learning approach with maximum-relevance–minimum-redundancy (mRMR) algorithm followed by incremental feature selection (IFS) to a set of microarray data generated from 43 tumor and 52 nontumor samples. With the machine learning approach, we identified 117 gene probes that could optimally separate tumor and nontumor samples. These genes not only include known HCC-relevant genes such as MT1X, BMI1, and CAP2, but also include cancer genes that were not found previously to be closely related to HCC, such as TACSTD2. Then, we constructed a molecular interaction network based on the protein–protein interaction (PPI) data from the STRING database and identified 187 genes on the shortest paths among the genes identified with the machine learning approach. Network analysis reveals new potential roles of ubiquitin C in the pathogenesis of HCC. Based on gene ontology (GO) and Kyoto Encyclopedia of Genes and Genomes (KEGG) pathway enrichment analysis, we showed that the identified subnetwork is significantly enriched in biological processes related to cell death. These results bring new insights of understanding the process of HCC.
1. Introduction
L
Maximum relevance–minimum redundancy (mRMR) is an effective machine learning approach for phenotype classification based on transcriptome data (e.g., gene expression microarray), which was also proved to identify disease-related genes (Chris Ding, 2005).
In the postgenomic era, one of the most important challenges is to determine gene functions. We use high-throughput biotechnologies to generate a large amount of biological data that are valuable resources for acquiring the gene functions (Li et al., 2012). For example, in order to predict protein functions, Nabieva et al. (2005) developed a network-flow-based algorithm that exploits the underlying structure of protein interaction maps. Now, protein–protein interaction (PPI) data have been widely used for gene function prediction.
The Search Tool for the Retrieval of Interacting Genes (STRING) database is an online resource that provides both experimental and predicted interaction information with a confidence score (Szklarczyk et al., 2011). In the PPI network, proteins with short distances between each other tend to have similar biological functions (Sharan et al., 2007; Bogdanov and Singh, 2010; Kourmpetis et al., 2010; Ng et al., 2010), and interactive neighbors are prone to have more similar biological functions than noninteractive ones (Letovsky and Kasif, 2003; Karaoz et al., 2004).
This study identified HCC-related genes based on the gene expression profile. We identified 117 HCC-related gene probes with the mRMR approach. We also used Dijkstra's algorithm (Dijkstra, 1959) to identify 187 genes on the shortest paths between the 117 gene probes in the PPI network. Then, the genes identified were analyzed through gene ontology (GO) functional enrichment and Kyoto Encyclopedia of Genes and Genomes (KEGG) pathway enrichment.
2. Materials and Methods
2.1. Dataset
The gene expression profiling dataset contains a total of 43 tumor and 52 nontumor samples, which were from research by Tsuchiya et al. (2010). It was generated by the Agilent-014850 Whole Human Genome Microarray 4x44K G4112F. The dataset was downloaded from NCBI Gene Expression Omnibus (GEO) with the accession number GSE17856.
2.2. Feature selection
We applied the mRMR method to rank the importance of the features, which is based on both their relevance to the target and the redundancy between features (Chris Ding, 2005). In our study, mRMR was realized by using an R package mRMRe (De Jay et al., 2013). In mRMRe, both relevance and redundancy are quantified using mutual information (MI), which is estimated as
where x and y are two features, I and ρ represent the MI and the correlation of x and y, respectively.
Let
The selection step is repeated until a desired number of ranked features N has been reached.
The mRMR provides only a list of ranked features, but does not tell us how many appropriate features should be selected. So a possible feature subset Si can be determined by incremental feature selection (IFS), as expressed by the following equation (Huang et al., 2009):
For example, the first feature subset is S1 = {f1}, and the last feature subset is
2.3. Prediction engine
We used three prediction methods to estimate the phenotype of an individual: (1) the phenotype of its nearest neighbor, (2) the most frequent phenotypes of its five nearest neighbors, and (3) the phenotype of its nearest cluster center of every phenotypic group.
In our study, the distance between two individuals is defined according to Chou and coworkers (Chou and Shen, 2006; Chou, 2011), as shown below:
where i1 and i2 represent two individuals, d refers to the distance between the two individuals, and e1 and e2 are vectors of selected feature sets (expression levels of selected genes) of the two individuals, respectively.
2.4. Validation method
Independent dataset test, subsampling test, and jackknife test are three validation methods that are often used in statistics for validating a statistical prediction. However, among the three validation methods, the jackknife test can avoid the arbitrariness problem that is existent in the independent dataset and subsampling test (Chou, 1995, 2011; Chou and Shen, 2008). In the jackknife test, both the training dataset and testing dataset are open, and each sample will be in turn moved between the training dataset and testing dataset.
The prediction accuracy was formulated by
where TP represents the number of true positive, TN represents the number of true negative, FP represents the number of false positive, and FN represents the number of false negative.
2.5. Graphics approach and shortest paths tracing
In this study, we constructed a graph G(V,E) using the PPI data from STRING (version 9.0) (Szklarczyk et al., 2011), which can provide intuitive insights and overall structure properties to study complex biological systems. Based on our PPI network, we used Dijkstra's algorithm to identify the shortest path between any pair of proteins that were identified by mRMR-IFS, and we used Cytoscape (Smoot et al., 2011) to visualize the subnetwork of shortest paths.
2.6. Pathway enrichment analysis
In our study, we used the functional annotation tool of DAVID (Huang da et al., 2009a) for KEGG pathway enrichment and GO functional enrichment analysis. The original enrichment p-value and corrected p-value by Benjamin multiple tests were estimated by the tool.
3. Results
3.1. Gene probes for HCC classification identified by mRMR
We retrieved the HCC gene expression profile from GEO with the accession number GSE17856, which contained 95 samples (43 tumors, 52 nontumors) and 25,073 probes. We applied the mRMR-IFS strategy for feature selection and compared three different nearest-neighbor models for phenotype classification (see Materials and Methods). On the basis of outputs of mRMR, we estimated the classification accuracy for these models for up to 500 probes using jackknife validation (Fig. 1). From the IFS curve, we find that although the feature number with the highest accuracy (0.905) is 405, the second accurate one is 117 and the accuracy (0.895) is almost similar to the highest one. Since fewer features were incorporated, we chose the 117 gene probes as the final feature set to separate tumor and nontumor samples. All the 117 gene probes and their corresponding genes are presented in Supplementary Table S1 (Supplementary Material is available online at www.liebertpub.com/cmb). Some of the genes have been shown to be closely related to HCC, such as MT1X, BMI1, and CAP2, which justified the rationality of our method. We also identified some cancer genes that have not been reported previously to be closely related to the HCC, such as TACSTD2, suggesting that our method is effective in prediction of novel HCC-related genes. And their expression difference is shown in Figure 2.

IFS curve to determine the number of features used in prediction. We used an IFS curve to determine the number of features finally used in the mRMR selection. Prediction accuracy reached its second maximum value when 117 genes were included. Predict 1, predict 2, and predict 3 refer to the three prediction methods we used—a vote of the first nearest neighbor, the top five nearest neighbor, and nearest clustering center of each phenotype group, respectively. The x-axis indicates the number of probes used for classification, and the y-axis is the prediction accuracy of the three approaches to predict samples' phenotype. IFS, incremental feature selection; mRMR, maximum relevance–minimum redundancy.
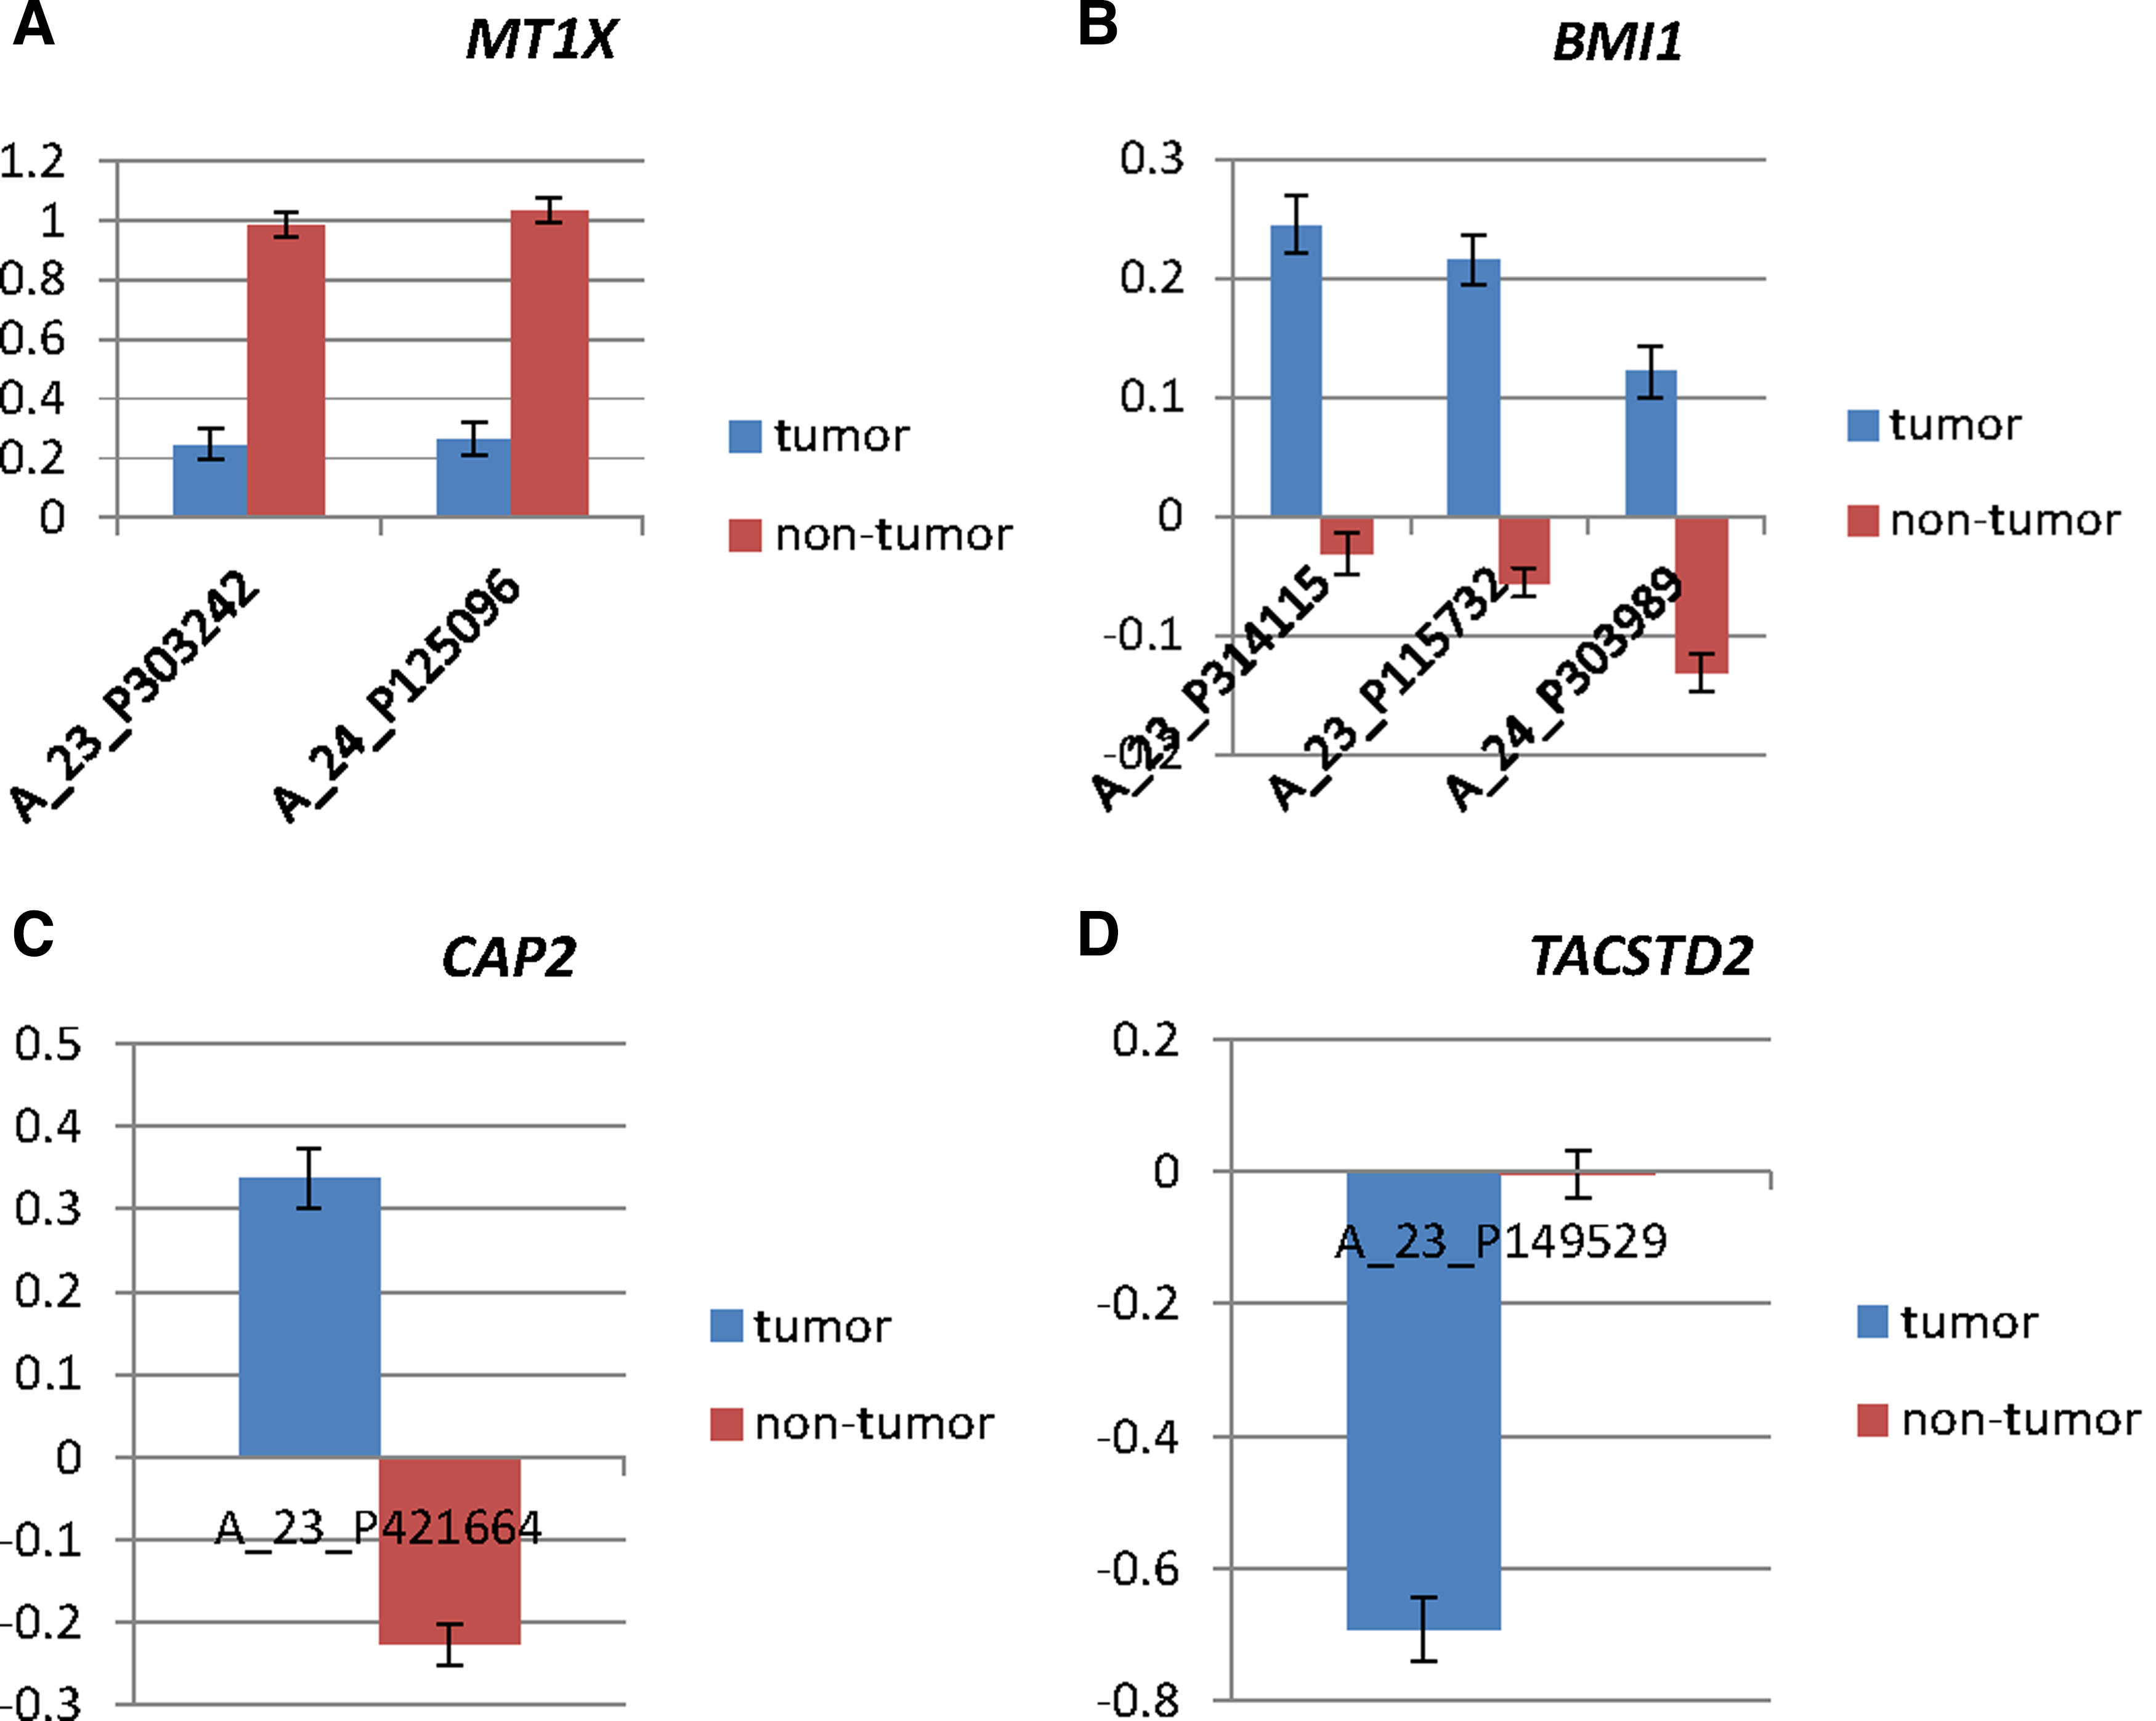
Expression differences of MT1X (A_23_P303242, A_23_P303242), BMI1 (A_23_P314115,A_23_P115732,A_24_P303989), CAP2 (A_23_P421664), and TACSTD2 (A_23_P149529) between tumors and nontumors. This figure shows the expression differences of MT1X, BMI1, CAP2, and TACSTD2 between tumors and nontumors separately. Error bars indicate standard errors.
3.2. A PPI subnetwork of the identified genes on HCC
We further constructed an undirected graph using the PPI data from STRING (Szklarczyk et al., 2011). From the 117 gene probes identified by mRMR and IFS as described above, we found 75 protein coding genes, and 32 proteins of them existed in STRING. Then, we picked out every pair of two proteins from the 32 proteins and identified the shortest path between these two proteins with Dijkstra's algorithm (Dijkstra, 1959). The shortest paths between the 32 proteins were integrated into a subnetwork (Fig. 3), which contains a total of 350 PPIs involving 187 proteins. To evaluate the essentiality of the 187 proteins, we ranked them according to their betweennesses, and the top 10 proteins are shown in Table 1. Among these genes, the ubiquitin C (UBC) gene has the largest betweenness of 290, meaning that there are at least 145 shortest paths going through this gene. This result suggests that UBC may play important roles during the pathogenesis of HCC.
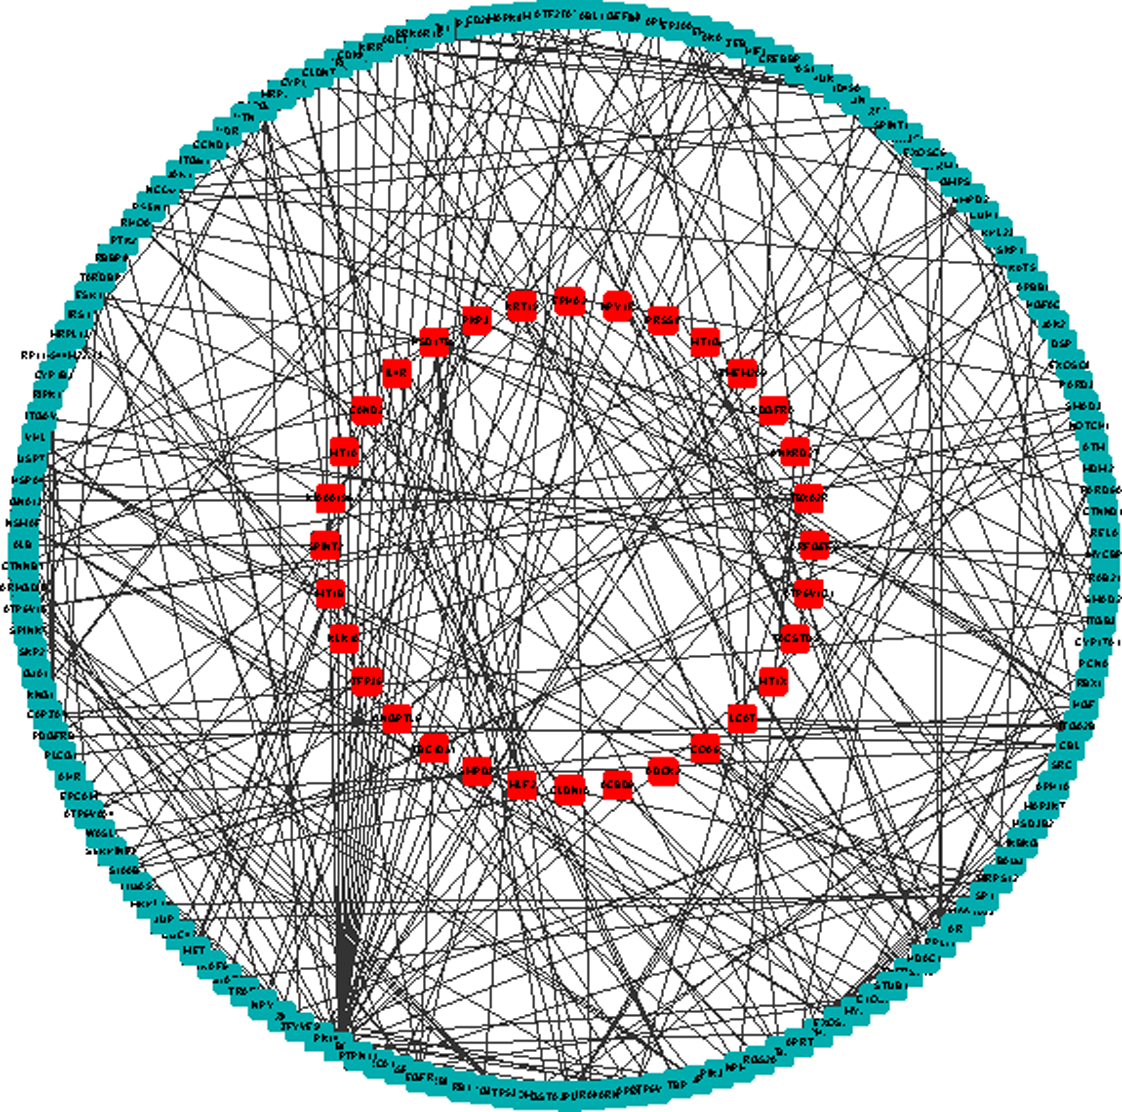
PPI network of shortest paths among 75 computational method-identified proteins. Shortest paths between each pair of the 32 proteins that were from the 75 computational method-selected proteins were identified in the STRING PPI network. Proteins are presented using their Ensembl IDs. Proteins in red are the 32 identified using the computational method that also present in the STRING PPI network; proteins in dark green are located only on shortest paths. PPI, protein–protein interaction; STRING, Search Tool for the Retrieval of Interacting Genes.
3.3. The result of enrichment analysis of the identified genes
Using the functional annotation tool provided by DAVID (Huang da et al., 2009a,b), the KEGG pathway and GO functional enrichment analysis were first performed on the genes corresponding to the 117 gene probes. This result shows that these genes are significantly enriched in the GO modules of protein localization in organelles (Supplementary Table S2). In the KEGG pathway enrichment analysis, a pathway (hsa04080: neuroactive ligand–receptor interaction) is enriched, but it is not significant (p = 0.068).
The KEGG pathway and GO functional enrichment were also carried out for all the 187 genes on the shortest paths. In the GO functional enrichment analysis, many genes are significantly enriched in the modules related to cell death (Supplementary Table S3). The KEGG pathway enrichment result shows that these genes are significantly enriched in the pathways in cancer (p = 1.02E-26; Supplementary Table S4).
4. Discussion
In the 117 gene probes optimizing the tumor and nontumor prediction, both known and unknown HCC-related cancer genes are found. For example, a series of MT (metallothioneins) genes are included, such as MT1A, MT1B, MT1G, MT1H, MT1L, and MT1X. MTs are cysteine-rich low-molecular-mass intracellular proteins occurring in a wide variety of eukaryotes and constituting the major fraction of intracellular protein thilos (Jaromir Gumulec et al., 2014). Many studies have shown an increased expression of MTs in human tumors of breast (Schmid et al., 1993; Goulding et al., 1995; Jin et al., 2001); colon (Dziegiel, 2003); kidney (Nartey et al., 1987a); liver (Nartey et al., 1987a); lung (Joseph et al., 2001); nasopharynx (Jayasurya et al., 2000); ovary (Tan et al., 1999); prostate (Garrett et al., 2000); salivary gland, testes, and thyroid (Nartey et al., 1987b); and urinary bladder (Cherian, 2003). In 1997, Studer et al. also found that metallothionein accretion in human hepatic cells is linked to cellular proliferation (Studer et al., 1997). MT1X is not only found by mRMR-IFS, but also appears in the genes that exist in the subnetwork consisting of shortest paths. In a previous study, a cDNA microarray dataset on HCC indicated that MT1X shows downregulated expression (Peng et al., 2012). Another study also found that the downregulated expression of MT in HCC may play a role in hepatocarcinogenesis and be a marker of hepatocellular differentiation (Tao et al., 2007). Our study confirms that MT1X is downexpressed and is very relevant to the pathogenesis of HCC.
Another gene among the 117 probes we noticed is B lymphoma Mo-MLV insertion region 1 homolog (BMI1), which is known as a polycomb ring finger oncogene. Chatoo et al. (2009) found that the polycomb group gene BMI1 regulates antioxidant defenses in neurons by repressing p53 pro-oxidant activity. Wang et al. (2008a) also found that increased polycomb-group oncogene BMI1 expression correlated with poor prognosis in HCC. Our study also supported this opinion. In fact, BMI1 is not only well established as one of the most commonly activated oncogenes, but also provides a potential therapeutic target for the future treatment of HCC.
Adenylyl cyclase-associated protein 2 is an enzyme that in humans is encoded by the CAP2 gene, which was identified by mRMR-IFS in our study. Neo et al. (2004) identified several genes that were upregulated in human HCCs using gene expression profiling, and CAP2 was listed as one of the overexpressed genes. In Shibata et al.'s study, they also found that CAP2 was overexpressed at both the mRNA and protein levels in early and progressed HCCs (Shibata et al., 2006). In our study, we also found that the CAP2 gene is overexpressed in HCC, which provided a new evidence that CAP2 is related to the pathogenesis of HCC.
Tumor-associated calcium signal transducer 2 (TACSTD2; also called Trop-2) is a calcium signal transducer (Ripani et al., 1998) that is associated with cancer aggressiveness, poor prognosis (Fong et al., 2008a; Muhlmann et al., 2009), and transformed cell growth in experimental systems (Wang et al., 2008b). Trerotola et al. (2013) found that upregulation of trop-2 quantitatively stimulated human cancer growth. There are many cancers that are associated with the expression of Trop-2, such as pancreatic, gastric, oral, colorectal, and ovarian cancers (Fong et al., 2008a,b; Wang et al., 2008b; Muhlmann et al., 2009; Bignotti et al., 2010). The finding in our work that Trop-2 was identified in HCC prediction suggested its potential role in the development of HCC.
In the PPI network constructed by shortest paths tracing, more HCC-related genes could be revealed; especially UBC has the highest betweenness in the subnetwork. We did not find any previous reports about the effect of UBC on the development of HCC, but ubiquitins are related to the DNA-damage responses as well as signaling processes leading to activation of the transcription factor NF-kappa-B (Chen, 2005). Thus, our results imply that UBC may play important roles during the pathogenesis of HCC.
5. Conclusions
We applied a set of machine learning approaches, including mRMR and IFS, to the HCC gene expression profile and identified 117 gene probes for HCC prediction. In these genes, some have been shown to be closely related to HCC (e.g., MT1X, BMI1, and CAP2). We also identified some new genes that have not been reported previously to be closely related to the process of HCC (e.g., TACSTD2), which bring some new insights into the occurrence of HCC. We further constructed a PPI subnetwork based on the selected genes using shortest paths tracing and identified 187 genes relevant to HCC. Functional enrichment analysis shows that the subnetwork is significantly enriched in modules related to cell death and pathways in cancer. Network analysis reveals the potential role of UBC in the pathogenesis of HCC. We demonstrated that our method is efficient and effective in the prediction of novel cancer-related genes and has universal applicability in cancer research.
Authors' Contributions
T.G., X.D., R.L., Z.W., and Y.L. wrote the article. T.G., X.D., and Z.W. performed the analysis. Y.L. organized the whole project.
Footnotes
Acknowledgments
This work was supported by the National Natural Science Foundation of China (31260544, U1036604, 31070752, and 31301032).
Author Disclosure Statement
No competing financial interests exist.
References
Supplementary Material
Please find the following supplemental material available below.
For Open Access articles published under a Creative Commons License, all supplemental material carries the same license as the article it is associated with.
For non-Open Access articles published, all supplemental material carries a non-exclusive license, and permission requests for re-use of supplemental material or any part of supplemental material shall be sent directly to the copyright owner as specified in the copyright notice associated with the article.