
Abstract
Abstract
Many different methods have been proposed for calculating the semantic similarity of term pairs based on gene ontology (GO). Most existing methods are based on information content (IC), and the methods based on IC are used more commonly than those based on the structure of GO. However, most IC-based methods not only fail to handle identical annotations but also show a strong bias toward well-annotated proteins. We propose a new method called weighted multipath measurement (WMM) for estimating the semantic similarity of gene products based on the structure of the GO. We not only considered the contribution of every path between two GO terms but also took the depth of the lowest common ancestors into account. We assigned different weights for different kinds of edges in GO graph. The similarity values calculated by WMM can be reused because they are only relative to the characteristics of GO terms. Experimental results showed that the similarity values obtained by WMM have a higher accuracy. We compared the performance of WMM with that of other methods using GO data and gene annotation datasets for yeast and humans downloaded from the GO database. We found that WMM is more suited for prediction of gene function than most existing IC-based methods and that it can distinguish proteins with identical annotations (two proteins are annotated with the same terms) from each other.
1. Introduction
G
These measures have been used in a broad range of applications, such as protein function (Fontana et al., 2009), cellular localization prediction (Lei and Dai, 2006), protein–protein interaction prediction (Wu et al., 2006b; Xu et al., 2008), automatic annotation validation (Couto et al., 2006), pathway modeling (Guo et al., 2006), and the evaluation of similarity between gene products with respect to expression profiles (Sevilla et al., 2005). However, all existing similarity measurement methods have drawbacks. Methods of Resnik (1995), Lin (1998), and Jiang and Conrath (1997) use information content (IC) to represent the specificity of GO terms. These methods hinder their ability to determine the functional similarity of genes. Resnik's method (Resnik, 2011) ignores the information contained in the structure of the ontology. A serious drawback of Lin's method (Lin, 1998) and Jiang's method (Jiang and Conrath, 1997) is that shallow annotation (two gene products are well annotated near the root of the ontology) makes the semantic similarity always be close to 1, which leads to a misleading result. Considering the drawbacks of these two methods, Wang et al. (2007) developed an IC-independent method, in which each edge is assigned a weight that was named the semantic contribution factor (ωe), according to the type of relationship. They represent a GO term A as DAG
A
= (A, TA, EA), a subgraph of GO, where TA is the set of all ancestors of A and itself, and EA is the set of corresponding links. The contribution of any term t to the semantics of a term A is defined as the S-value of the term t related to term A, SA(t), which can be calculated by
where ωe is the semantic contribution factor for edge e ∈ EA linking term t with its child term t′. The semantic value of the term A, SA(A), is the aggregate semantic contribution of all terms in the DAG
A
.
Given that DAG
A
= (A, TA, EA) and DAG
B
= (B, TB, EB) for the two terms A and B, respectively, the semantic similarity between them, SGO (A, B), is defined as
Nevertheless, each ancestor term may have multiple direct child terms, and this property indicates that there may be multiple paths from a given term to its ancestor. Wang's method (Wang et al., 2007) ignored the affection brought by different paths. Therefore, it is not sensitive to GO updating.
Besides their individual drawbacks, a common problem in above methods is that different researchers may get different semantic similarity values for the same two GO terms if they use different gene annotation data. In some special cases, researchers need to have a fixed semantics when the terms are used to annotate genes. Hence, it is desirable to determine the semantic similarity of GO terms only based on their structure and annotation specification of gene ontologies (Wang et al., 2007). However, most ontology-structure-based methods (Gentleman, 2005; Pesquita et al., 2007) determine the semantic similarity either based on their distances to the closest common ancestor terms or based on the number of their common ancestor terms. There are some other methods that rely on distance measures (Couto et al., 2006; Wu et al., 2006b), for example, counting the number of edges on the shortest path between the involved terms in GO to calculate the similarity of GO terms and ignoring the affection brought by other paths, and thus the results obtained by these methods have a low accuracy.
2. Methods
To address the weaknesses of the most existing methods, we propose a weighted multipath measurement (WMM) based on the DAG structure of GO to measure the semantic similarity of GO terms. In addition to taking every path into account, we also assign a weight to each edge according to the type of relationship like Wang's method (Wang et al., 2007) instead of quantifying each edge as 1.
2.1. Semantic similarity of GO terms based on the structure of GO graph
Figure 1 shows a subgraph that is extracted from GO for a given term, for example, GO: 0048471. As shown in Figure 1, term t3 is the father of t5 and the brother of t4. Interpreted by human common sense, the similarity value between t3 and t5 should be higher than that of t3 and t4. Some related studies also demonstrated that the path of two terms affected the semantic similarity of them, and the longer the path is, smaller the similarity value is. For example, sim (t3, t4) < sim (t3, t5) (the similarity value of term t3 and term t4 is smaller than that of term t3 and term t5), sim (t7, t8) < sim (t6, t8), and sim (t11, t12) < sim (t9, t12); the results obtained by Wang's method (Wang et al., 2007) and Jiang's method (Jiang and Conrath, 1997) both confirmed it (see Fig. 2).
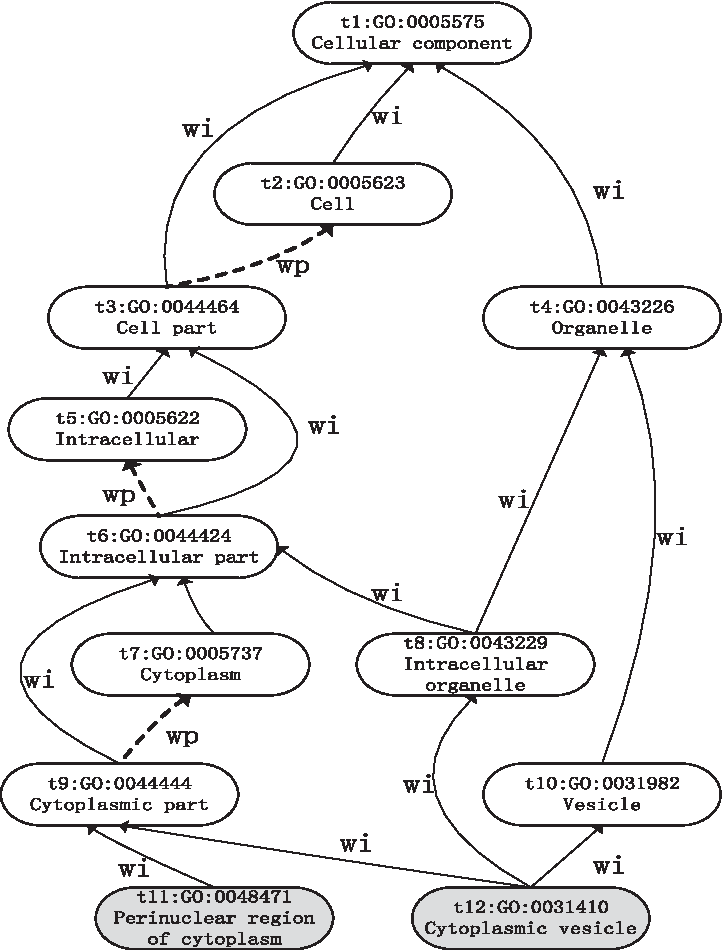
A subgraph generated from GO of two seed terms, GO:0048471 and GO:0031410. Gene ontology is represented as a directed acyclic graph in which the nodes correspond to the terms and the edges represent relationships between terms. The solid arrows represent the “is-a” relationship and the dotted arrows show the “part-of” relationship. GO, gene ontology.
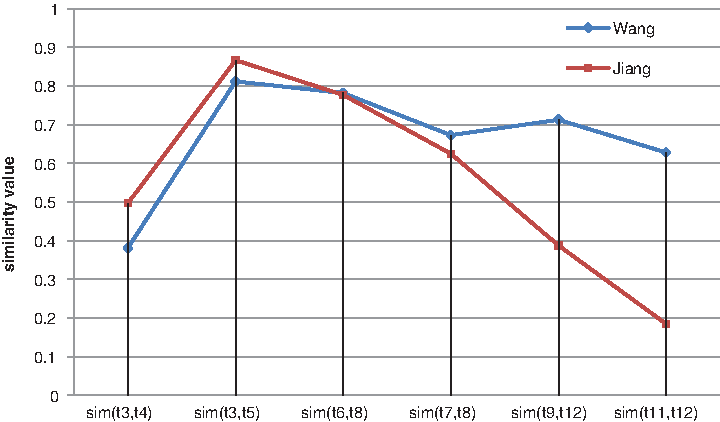
Similarity values of certain term pairs obtained by Wang's and Jiang's methods. Term pairs are extracted from Figure 1. The results obtained by Wang's and Jiang's methods demonstrate that the path of two terms affects the semantic similarity of term pairs, and the longer the path is, the smaller the similarity value is.
Given two GO terms ta and tb in a DAG, the path from ta to tb is defined as
where function parent (t) represents the set of parents of t. If term ta is an ancestor of term tb, then there is at least one path from ta to tb, and so the set of ancestors of term t can be defined as
The common ancestors of ta and tb are defined as
The set of lowest common ancestors (LCAs) is described as
Considering that one GO term may have multiple parent terms with different semantic relations in a DAG, there may be multiple LCAs between two terms and more than one path from one term to a certain LCA, and so given two terms ta and tb, the similarity between them based on path distance (PD) can be defined as
where
Because the specificity of a GO term is usually determined by its location in the GO graph and a GO term's semantics (biological meanings) are inherited from all its ancestor terms, two terms sharing the same parent that are near the root of the ontology should have a larger semantic difference than two terms having the same parent that are far away from the root of the ontology, which means that the semantic similarity value of two terms whose closest common ancestor is near the root of the ontology is expected to be less than that of two terms whose LCA is far away from the root. So the semantic difference of two GO terms cannot be accurately represented by their distances to their closest common ancestor terms, and the distance from the LCAs to the root of the ontology is an important factor that affects the semantic similarity. For instance, sim (t7, t8) > sim (t3, t4); this is because the LCA of t7 and t8 is t6, and the LCA of t3 and t4 is t1, and t1 is the root of the ontology. The results we derived are consistent with the results obtained by Jiang's method (Jiang and Conrath, 1997) and Wang's method (Wang et al., 2007). Figure 2 gives an intuitive comparison. Based on this, a concept called common path distance (CPD) is defined, which represents the average distance from the root to its LCAs of ta and tb. Thus, the similarity value is given by
where
In fact, the common ancestor of two GO terms may have different contributions to the semantics of these specific child terms because the distance from terms to their common ancestor and the semantic relations (edges in the GO graph) may be different. In order to get a more accurate result, different weights are assigned to different edges according to the type of relationship. In this study, we assign wi and wp for “‘is-a” and “part-of” relations, respectively. The values of wi and wp are calculated according to Wang's method (Wang et al., 2007).
In order to get a more reasonable and accurate result, simPD and simCPD are combined by a parameter λ. Finally, the semantic similarity of two GO terms is defined as
By replacing
where α is a parameter that regulates the contribution rate of PD, and β regulates the contribution rate of the depth, and λ regulates the contribution rate of distance and depth to the similarity value. The values of them range from 0 to 1.
2.2. Function similarity of gene products
It is meaningless to compare only the semantic similarity of GO terms. All methods for calculating the similarity of GO terms are proposed to finally compare the function of genes or gene products.
There are two strategies quantifying the relationship between two gene products. One is pairwise strategy, which includes maximum (MAX), the average, and best-match average (BMA). The other strategy is named as groupwise, such as simUI (Gentleman, 2005), simGIC (Pesquita et al., 2007), and SORA (Teng et al., 2013). Different strategies are best suited in different contexts (Pesquita et al., 2009a; Guzzi et al., 2012), and no measure is clearly preferred over the others for biological problems. As noted by Pesquita et al. (2008), the maximum and average approaches have limitations from a biological point of view, and the BMA (Pesquita et al., 2007) performs better than the MAX (Pesquita et al., 2007), because MAX strategy considers the best match among all term pairs of two gene products, and it could be potentially affected by incorrect annotations or the noise along with the IEA annotations (Guzzi et al., 2012). In this article, the BMA is applied.
Let A and B be two gene products of interest, and TA and TB are the sets of all the GO terms assigned to proteins A and B, respectively. So the relationship strength between A and B is defined through pairwise rule, that is, BMA. The BMA strategy finds all the best semantic similarity values for each term in TA and TB, and Equation 13 demonstrates it. The functional similarity of proteins A and B is calculated by
where
3. Results and Discussion
Most of the existing semantic similarity measurements assess their performance in terms of correlations with sequence similarity (Mistry and Pavlidis, 2008), protein family similarity (Couto et al., 2005; Schlicker et al., 2006), and human ratings (Rong et al., 2006), etc. In this article, we first evaluate the performance of WMM by comparing the calculated semantic similarities with human ratings, and then we compare WMM with other existing methods using the Collaborative Evaluation of GO-based Semantic Similarity Measures (CESSM), an online tool for evaluating GO-based semantic similarity measures using Pearson's correlation with sequence, Pfam domain, and EC classification (ECC) similarities (Pesquita et al., 2009b); third, we compare the resolutions of WMM with other methods; finally, we discuss about the contribution of the WMM method in calculating the similarity of proteins annotated by identical annotations.
In this article, GO data (released in April 2012) and gene annotation datasets (released in April 2012) for yeast and human downloaded from the GO database (Ashburner et al., 2000) are used. The GO contains 22,506 BP, 2980 CC, and 9341 MF terms.
3.1. Comparison of WMM with human ratings
Ten biologists grade 25 pairs of GO terms with high, intermediate, and low similarities from 0 (no similarity) to 10 (synonymy) individually. After repeated testing, the maximum value of Pearson's correlation coefficient (PCC) is obtained when wi = 0.8, wp = 0.6, α = 0.8, β = 0.1, and λ = 0.6. Table 1 shows the PCCs between similarity values obtained by seven measures and that of human ratings. A higher PCC represents better performance, which means that the method with a higher PCC has a higher capability to achieve semantic similarity closer to human performance. As shown in Table 1, the results obtained by the WMM method most closely match the human perception. Although WMM does not show significant improvement compared with Combine's (Guzzi et al., 2012) method, it outperforms two intrinsic methods, SimUI method (Gentleman, 2005) and Wang's method (Wang et al., 2007).
The PCCs between the semantic similarities obtained by the seven measures and that of human ratings. PCCs, Pearson's correlation coefficients; WMM, weighted multipath measurement.
3.2. Evaluation of WMM by CESSM
CESSM is an online tool made available by the XLDB research team at the University of Lisbon. In total, 13,430 protein pairs involving 1039 distinct proteins and Uniprot GO annotations can be downloaded from CESSM online. CESSM provides three standards of evaluation: ECC similarity (ECC), Pfam similarity (Pfam), and sequence similarity (SeqSim). CESSM is used in our research to compare the WMM method with existing methods, such as Resnik's (RB) method (Resnik, 1995), Lin's (LB) method (Lin, 1998), and Jiang's (JB) method (Jiang and Conrath, 1997), coupled with simGIC (GI) (Pesquita et al., 2007) and simUI (UI) (Gentleman, 2005) (i.e., GI, UI, RB, LB, and JB) in three ontologies (MF, BP, and CC). First, the performance is evaluated by measuring the PCC between the semantic similarities given by each method and the functional similarity estimated from ECC, Pfam annotation (Pfam), and sequence similarity (SeqSim), respectively, under different three ontologies, MF, BP and CC. Table 2 shows the performance of each method evaluated by correlation received from CESSM. Figures 3–5 give a more intuitive comparison. As shown in Table 2 and Figure 3, both WMM and simGIC outperformed the others in sequence similarity (with a correlation of approximately 0.8 in BP). By analyzing Figure 4, we can find that WMM, simGIC, and simUI show a higher correlation in Pfam similarity than the others (with a correlation of approximately 0.6 in MF). In Figure 5, the three aforementioned methods and Resnik show a similar correlation for ECC (0.6 in MF).
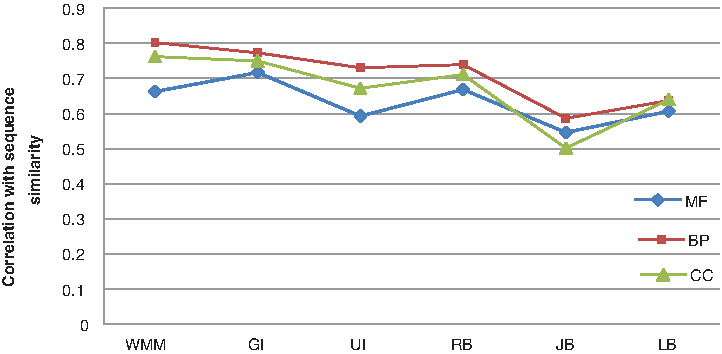
Correlation between semantic similarity calculated by WMM and sequence similarity displayed by CESSM. Both WMM and simGIC outperform the others in sequence similarity (with a correlation of approximately 0.8 in BP). The evaluation is carried out for UniProt protein pairs from the CESSM database in the MF, BP, and CC ontologies. BP, biological processes; CC, cellular components; CESSM, Collaborative Evaluation of GO-based Semantic Similarity Measures; MF, molecular function; WMM, weighted multipath measurement.
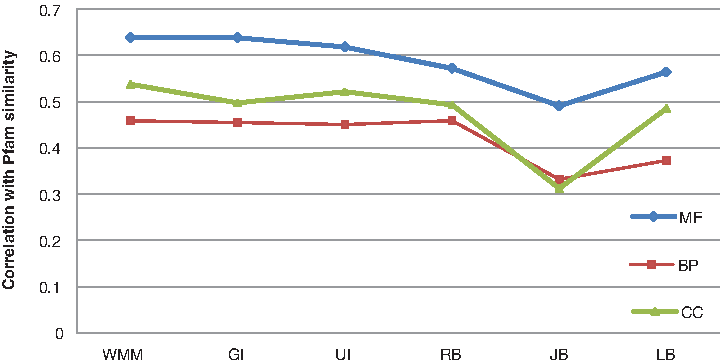
Correlation between semantic similarity calculated by WMM and Pfam similarity displayed by CESSM. WMM, simGIC, and simUI show a higher correlation in Pfam (protein family) similarity than the others (with a correlation of approximately 0.6 in MF). The evaluation is carried out for UniProt protein pairs from the CESSM database in the MF, BP, and CC ontologies.
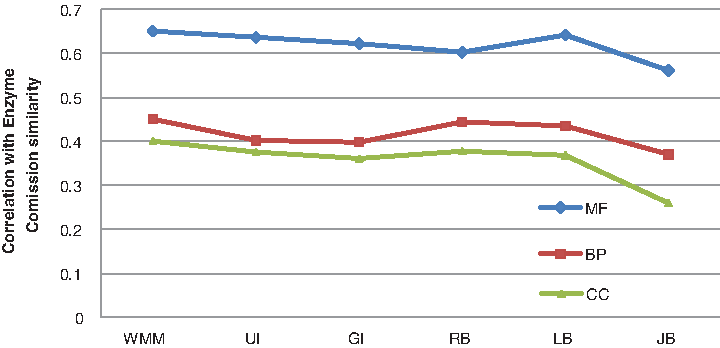
Correlation between semantic similarity calculated by WMM and ECC similarity displayed by CESSM. WMM, simGIC, simUI, and Resnik show a similar correlation (0.6 in MF) for ECC.The evaluation is carried out for UniProt protein pairs from the CESSM database in the MF, BP, and CC ontologies. ECC, enzyme comission classification.
Performance is measured by the PCC between the semantic similarity given by each method and the functional similarity estimated from EC classification (ECC), Pfam annotation (Pfam), and sequence similarity (SeqSim), respectively. Molecular function (MF), biological processes (BP), and cellular components (CC) are the three ontologies of gene ontology (GO).
Pesquita et al. (2008) recommended a measurement called resolution instead of the correlation coefficient to evaluate how well the semantic similarity matches the sequence similarity because the relationship between semantic similarity and sequence similarity is not linear. Resolution is the relative intensity whereby variations in the sequence similarity scale are translated into the semantic similarity scale. The method with a higher resolution has a higher capability to distinguish protein functions between different levels. Figure 6 shows the resolutions when sequence similarity is compared with the semantic similarity measured by WMM and some other existing methods. For a more intuitive comparison, see Figure 7. It shows that WMM performs comparably to the other five methods.
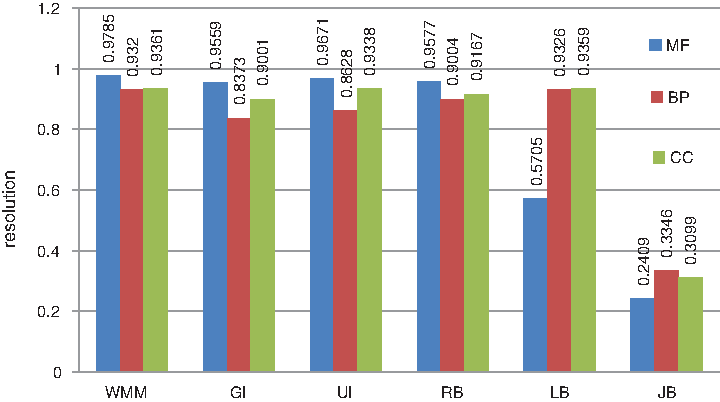
The resolutions of different methods. Resolution is defined as the relative intensity whereby variations in the sequence similarity scale are translated into the semantic similarity scale.
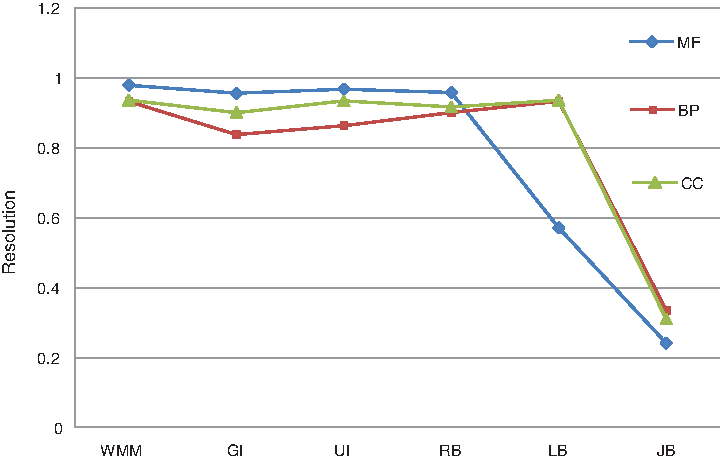
The comparison of resolutions obtained by CESSM. This figure is drawn from the data in Figure 6 and shows that WMM outperforms the other five methods.
3.3. Comparing identical annotations
Identical annotation occurs when two proteins are annotated with the same terms. It is a pity that most existing semantic similarity measurements assume that the similarity of any pair of proteins annotated by the same GO terms (known as identical annotation) will always be 1, which does not match the human perception that the similarity between proteins annotated with more specific terms should be greater than those annotated with more general ones. For instance, in the simplest case in Figure 1, in a given protein pair, P1 and P2 both annotated with the single term GO: 0005623, and in another protein pair, P3 and P4 both annotated with the single term GO: 0044424, and both of them have similarities of 1 under all of the existing measurements, but it is not true if rated by a human expert. As the specificity of terms increases downward through the DAG, it is reasonable to assume that there will be more similarity in the latter case than in the former case, and the similarity value between a term and itself can be calculated by Equation 9. As a result, our method shows that the similarity between P1 and P2 is 0.5583 and that the similarity between P3 and P4 is 0.7154.
As shown in Table 2 and Figure 7, WMM performs better than all the other five methods. Although it does not show significant improvements, it does show that it can compare proteins with identical annotations, providing a more authentic and unbiased result. These results confirm that WMM can be used as an alternative method to evaluate the functional similarity between proteins.
Footnotes
Acknowledgments
This work was supported in part by the National Science Foundation of China under Grant No. 61303105; the Humanity & Social Science general project of Ministry of Education under Grant No. 14YJAZH046; the Beijing Educational Committee Science and Technology Development Planned under Grant No. KM201410028017; Academic Degree Graduate Courses group projects; and the Beijing Key Disciplines of Computer Application Technology.
Author Disclosure Statement
The authors declare that no competing financial interests exist.