
Abstract
Abstract
Epistatic miniarray profile (E-MAP) is a popular large-scale genetic interaction discovery platform. E-MAPs benefit from quantitative output, which makes it possible to detect subtle interactions with greater precision. However, due to the limits of biotechnology, E-MAP studies fail to measure genetic interactions for up to 40% of gene pairs in an assay. Missing measurements can be recovered by computational techniques for data imputation, in this way completing the interaction profiles and enabling downstream analysis algorithms that could otherwise be sensitive to missing data values. We introduce a new interaction data imputation method called network-guided matrix completion (NG-MC). The core part of NG-MC is low-rank probabilistic matrix completion that incorporates prior knowledge presented as a collection of gene networks. NG-MC assumes that interactions are transitive, such that latent gene interaction profiles inferred by NG-MC depend on the profiles of their direct neighbors in gene networks. As the NG-MC inference algorithm progresses, it propagates latent interaction profiles through each of the networks and updates gene network weights toward improved prediction. In a study with four different E-MAP data assays and considered protein–protein interaction and gene ontology similarity networks, NG-MC significantly surpassed existing alternative techniques. Inclusion of information from gene networks also allowed NG-MC to predict interactions for genes that were not included in original E-MAP assays, a task that could not be considered by current imputation approaches.
1. Introduction
T
The missing value problem in E-MAPs resembles that from gene expression data where imputation has been studied well (Troyanskaya et al., 2001; Brock et al., 2008; Liew et al., 2011). The objective of both tasks is to estimate the values of missing elements in the given incomplete data matrix. Both types of data may exhibit correlation between mutant and gene profiles that is indicative of pathway membership in the case of E-MAP data (Ryan et al., 2010) and coregulation in the case of gene expression data. E-MAP data sets are therefore often investigated with tools originally developed for gene expression data analysis (Zheng et al., 2010). However, there are important differences between E-MAP and gene expression data that limit direct application of gene expression imputation techniques to E-MAPs (Ryan et al., 2010). E-MAP matrices report on pairwise relations between genes and have substantially different dimensionality than gene expression data sets. They often contain substantially more missing values than gene expression data sets with the latter having up to 5% missing data rate (Bø et al., 2004; Liew et al., 2011). These differences coupled with the biological significance of E-MAP studies have spurred the development of specialized computational techniques for recovery of missing interaction measurements in E-MAP-like data sets (Ryan et al., 2010).
We here propose NG-MC (network-guided matrix completion), a hybrid and knowledge-assisted method for imputing missing values in E-MAP-like data sets. NG-MC builds upon two concepts: probabilistic matrix completion and propagation of NG-MC-inferred latent gene interaction profiles. Matrix completion uses information on global correlation of elements in the E-MAP score matrix. Propagation of latent profiles exploits the local similarity of genes as specified by the gene networks. The use of prior knowledge in the form of gene networks gives NG-MC the potential to improve imputation accuracy beyond purely data-driven approaches. This could be especially important for data sets with small number of genes and high missing data rate such as E-MAPs. In what follows we present mathematical formulation of the proposed approach and in a comparative study that includes several state-of-the-art imputation techniques demonstrate its accuracy across several E-MAP data sets.
2. Related Work
Imputation algorithms for gene expression data sets are reviewed in Liew et al. (2011), where they are categorized into four classes based on how they utilize or combine local and global information from within the data (local, global, and hybrid algorithms) and their use of prior knowledge in imputation (knowledge-assisted algorithms). Local methods based on k-nearest neighbors that include KNNimpute (Troyanskaya et al., 2001), local least squares (LLS) (Kim et al., 2005), and adaptive least squares (LSimpute) (Bø et al., 2004) rely on local similarity of genes to recover missing values. Global methods decompose data matrices using variations of singular value decomposition (SVDimpute) (Troyanskaya et al., 2001), singular value thresholding algorithm for matrix completion (SVT) (Cai et al., 2010), and Bayesian principal component analysis (BPCA) (Oba et al., 2003). Hybrid imputation approaches for gene expression data make predictions by combining estimates from both local and global imputation methods (Jörnsten et al., 2005).
Only a handful of missing data imputation algorithms directly address E-MAP-like data sets. Ulitsky et al. (2009) experimented with a variety of genomic features, such as the existence of physical interaction or coexpression between genes, that were used as input to a classification algorithm. The NG-MC differs from this approach as it directly uses the matrix of measured GI scores and does not require data-specific feature engineering. Ryan et al. (2010, 2011) considered four general strategies for imputing missing values—three local methods and one global method—and adapted these strategies for E-MAPs. They modified unweighted and weighted k-nearest neighbors imputation methods (uKNN and wNN, respectively) and adapted LLS and BPCA algorithms to handle symmetric E-MAP data. We refer the reader to Ryan et al. (2010) for details on the algorithm modifications. We compare their imputation approaches with the NG-MC (sec. 6). Pan et al. (2011) proposed an ensemble approach to combine the outputs of two global and four local imputation methods based on diversity of estimates of individual algorithms. In this article, we focus on the development of a single algorithm that, if necessary, could be used in an ensemble, and therefore compare it with ensemble-free algorithms.
Another venue of research focuses on predicting qualitative, that is, binary, instead of quantitative interactions. Here, predictions estimate the presence or absence of certain types of interactions rather than their strength (Wong et al., 2004; Kelley and Ideker, 2005; Qi et al., 2008; Pandey et al., 2010). A major distinction between these techniques and the method presented in this article is that we aim to accurately impute quantitative genetic interactions using the scale of GI scores. Individual GI may by itself already provide valuable biological insight as each interaction attests to a functional relationship of a pair of genes. Prediction of synthetic sick and lethal interaction types in S. cerevisiae was pioneered by Wong et al. (2004), who applied probabilistic decision trees to diverse genomic data. Wong et al. introduced 2-hop features to capture the relationship between a pair of genes and a third gene. For example, if protein g physically interacts with protein h, and gene w is synthetic lethal with the encoding gene of h, then this observation increases the likelihood of a synthetic lethal interaction between the encoding gene of g and gene w. Two-hop features were shown to be crucial when predicting GIs (Wong et al., 2004; Bandyopadhyay et al., 2008; Ulitsky et al., 2009) and are the rationale behind our concept of propagating latent profiles over gene networks.
3. Methods
We start by presenting a probabilistic model of matrix completion for missing value imputation in E-MAP-like data sets in which the prediction of missing interaction measurement depends only on the E-MAP score matrix. We then develop an efficient model-fitting approach called network-guided matrix completion (NG-MC), which can additionally consider the prior knowledge in the form of any number of gene networks. NG-MC uses information on topology of gene networks to propagate latent gene interaction profiles among neighboring genes. It exploits the transitivity of interactions; that is, the property of the relationship between a gene pair and a third gene (sec. 2). As such, NG-MC predicts missing values by integrating E-MAP data with available network data. Any type of knowledge that can be expressed in the form of gene networks can be passed to NG-MC. In our experiments we consider gene ontology (Ashburner et al., 2000) semantic similarity network and protein–protein interaction network.
3.1. Problem definition
In the E-MAP study we have a set of n genes,
Network-guided matrix completion can simultaneously consider multiple gene networks. Given a weighted adjacency matrix
The model inference task is defined as follows: given a pair of genes, gi and gj, for which
3.2. Preliminaries
We begin with a probabilistic view of matrix completion for missing value imputation that does not consider prior biological knowledge. This approach builds upon probabilistic matrix factorization of Mnih and Salakhutdinov (2007) and Salakhutdinov and Mnih (2008), and we refer to it as MC. Genome-scale genetic interaction mapping (Costanzo et al., 2010) has suggested the existence of coherent groups of genes participating in related biological processes. Hence, a desirable computational model of interactions should model interactions not only in terms of pairwise measurements, but also in terms of how these measurements relate to each other. Matrix completion models this intuition by assuming E-MAP score matrix
where
Through Bayesian inference we obtain the log-posterior probability of latent feature matrices given the interaction measurements,
3.3. Network-guided matrix completion
Network-guided matrix completion (NG-MC) extends matrix completion model (MC) from the previous section by borrowing latent feature information from neighboring genes in networks
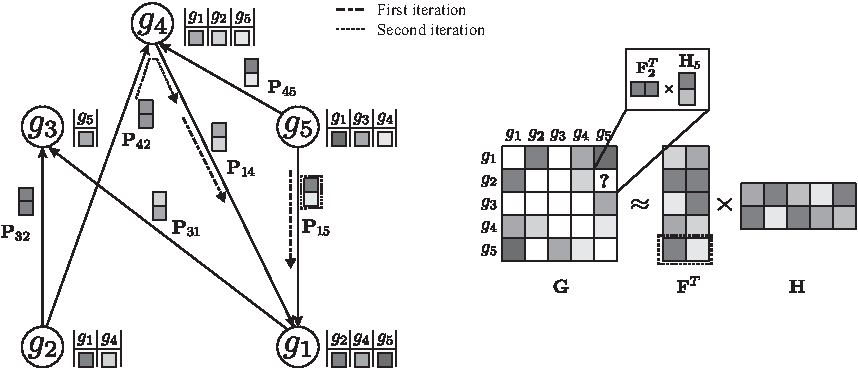
A toy application of the network-guided matrix completion (NG-MC) algorithm. A hypothetical E-MAP data set with five genes is given,
Suppose that for a given i and j, the observation in
Such formulation of gene latent matrix keeps gene feature vectors in
We then compute the log-posterior probability to obtain:
Our goal is to learn
where
NG-MC algorithm (Alg. 1) iteratively updates gene latent feature vectors
Algorithm 1. Network-guided matrix completion (NG-MC) algorithm. We observed that parameter values λ
4. Experimental Setup
In the experiments, we consider an existing incomplete E-MAP matrix from each of the E-MAP studies and artificially introduce an additional 1% of missing values for a set of arbitrarily selected gene pairs (Ryan et al., 2010; Pan et al., 2011). These gene pairs and their data constitute a test set on which we evaluate the performance of imputation algorithms. Because of E-MAP symmetry, for a given test gene pair and its corresponding entry
It may be noted that established performance evaluation procedure of missing value imputation methods for gene expression data is not directly applicable to E-MAPs for several reasons discussed in Ryan et al. (2010). That procedure first constructs a complete data matrix by removing genes with missing values and then artificially introduces missing values for evaluation. Gene expression data contain a substantially lower fraction of missing data than E-MAPs (Table 1), and removing a small number of genes and experimental conditions does not significantly reduce the size of gene expression data sets, whereas this does not hold for E-MAP data sets.
We select the latent dimensionality k and regularization parameters λ
We consider two measures of imputation accuracy. These are the Pearson correlation (CC) between the imputed and the true values, and the normalized root mean square error (NRMSE) (Oba et al., 2003) given as
To test if the differences in performance of imputation methods are significant, we use the Wilcoxon signed-rank test, a nonparametric equivalent of a paired t-test. Its advantage is that it does not require Gaussian distribution or homogeneity of variance, but it has less statistical power, so there is a risk that some differences are not recognized as significant.
5. Data
We consider four E-MAP data sets in a comparative evaluation of NG-MC with five state-of-the-art methods for missing value imputation. The evaluated data sets are from budding yeast S. cerevisiae; they include S-scores of interaction measurements, but differ in the subset of studied genes and the proportion of missing values (Table 1):
• Chromosome biology (Collins et al., 2007) is the largest data set considered, encompassing interactions between 743 genes involved in various aspects of chromosome biology, such as chromatid segregation, DNA replication, and transcriptional regulation. • RNA processing (denoted by RNA) (Wilmes et al., 2008) focused on the relationships between and within RNA processing pathways involving 552 mutants, 166 of which were hypomorphic alleles of essential genes. • The early secretory pathway (denoted by ESP) (Schuldiner et al., 2005) generated genetic interaction maps of genes acting in the yeast early secretory pathway to identify pathway organization and components of physical complexes. • Lipid E-MAP (Surma et al., 2013) focused on lipid metabolism, sorting, trafficking, and various aspects of lipid biology, and its data were indicative of a dedicated bilayer stress response for membrane homeostasis.
We have considered two data sources for gene network construction. The first network is constructed based on gene ontology (GO) (Ashburner et al., 2000) annotation data. It is a weighted network of genes included in the E-MAP study whose edge weights correspond to the number of shared GO terms between connected genes, excluding annotations inferred from GI studies (i.e., those with the
6. Results and Discussion
6.1. Imputation performance
Table 2 shows the CC and NRMSE scores of imputation algorithms along with the baseline method of filling-in with zeros. NG-MC-PPI and NG-MC-GO achieved highest accuracies on all considered data sets. We compared their scores with the performance of the second-best method (i.e., LLS on chromosome biology data set, SVT on ESP data set, and MC on RNA data set) and found that improvements were significant in all data sets.
MC denotes matrix completion model (sec. 3.2). The NG-MC-GO and NG-MC-PPI are network-guided matrix completion models (sec. 3.3) that utilize gene ontology annotation and physical interaction data, respectively. For descriptions of other methods see sec. 2. Highlighted results are significantly better than the best non-NG-MC method according to the Wilcoxon signed-rank test at 0.05 significance level.
ESP, early secretory pathway; CC, Pearson correlation coefficient; NRMSE, normalized root mean squared error; BPCA, Bayesian principal component analysis; wNN, weighted k-nearest neighbors; LLS, local least squares; SVT, singular value thresholding algorithm.
We did not observe any apparent connection between the proportion of missing values in a data set and the performance of any of the imputation methods. The performance was better on smaller ESP and RNA data sets, although differences were small and further investigation appears to be worthwhile.
The baseline method of filling-in with zeros had the worst performance on all data sets. While this approach seems naïve, it is justified by the expectation that most genes do not interact. We observed that BPCA failed to match the performance of weighted neighbor-based and local least squares methods, wNN and LLS, respectively, on all three evaluated E-MAP data sets. Local imputation methods, wNN and LLS, demonstrated good performance across all three data sets. Solid performance of neighbor-based methods on larger data sets could be explained by a larger number of neighbors to choose from when imputing missing values, which resulted in more reliable missing value estimates.
Global methods, BPCA, SVT, and MC, performed well on the ESP data set but poorly on a much larger chromosome biology data set. These methods assume the existence of a global covariance structure between all genes in the E-MAP score matrix. When this assumption is not appropriate, that is, when genes predominantly exhibit local similarity substructure, the imputation becomes less accurate. The comparable performance of SVT and MC across data sets was expected. Both methods solve related optimization problems and operate under the assumption that the E-MAP score matrix has low rank.
The superior performance of NG-MC models over other imputation methods can be explained by their ability to introduce circumstantial evidence into model inference. As a hybrid imputation approach, NG-MC can benefit from both global information present in the E-MAP data and local similarity structure between genes. One could vary the level of influence of global and local patterns on the imputation through
We studied the sensitivity of NG-MC to variations in algorithm parameters. In particular, we investigated how NG-MC imputation performance was affected as a function of parameters values. The parameters of NG-MC algorithm are the latent dimensionality of the factorized model (k), the degree of regularization of latent matrices (λ
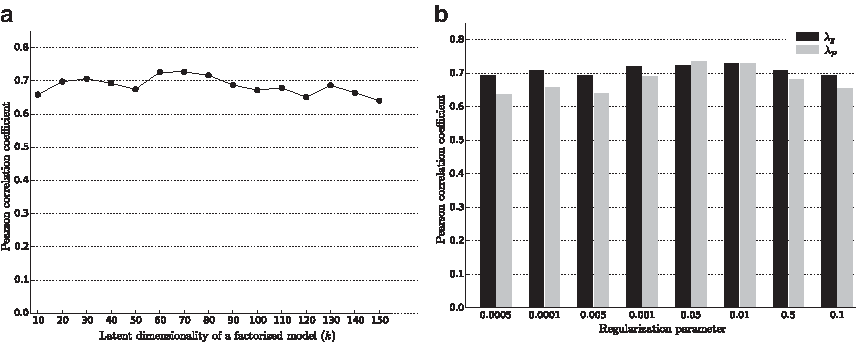
Impact of different values for latent dimensionality (
6.2. Missing value abundance and distribution
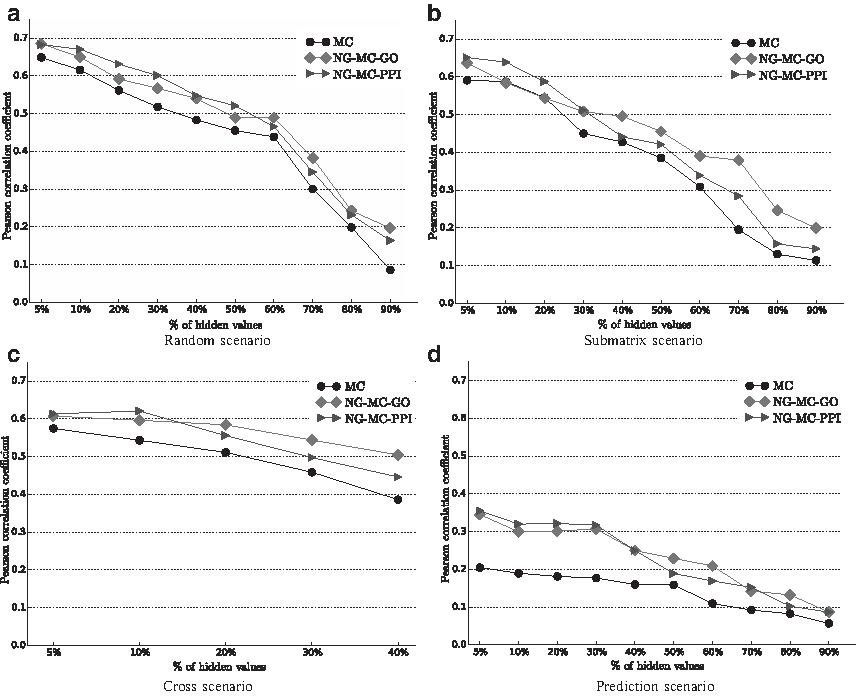
Ulitsky et al. (2009) described three different scenarios of missing values in E-MAP experiments (Fig. 3). The simplest and the most studied scenario is the random model for which we assume that missing measurements are generated independently and uniformly by a random process. The submatrix model corresponds to the case where all interactions within a subset of genes (e.g., essential genes) are missing. The cross model arises when interactions between two disjoint subsets of genes are missing. This model concurs with the situation when two E-MAP data sets that share a subset of genes are combined into a single large data set. We identified the fourth missing value configuration, which we call the prediction scenario (Fig. 4d). It occurs when complete GI profiles are missing. Learning in such a setting is substantially harder than learning with other missing value arrangements as genes with missing values in the prediction scenario do not have any associated interaction measurements. In the previous section, we compared the imputation methods using the random configuration, and we study other configurations in this section. Here we are interested in the effect that various missing data configurations have on NG-MC, and we compared the NG-MC algorithm to its variant, which does not use domain knowledge (MC).

The four configurations producing missing values in E-MAP data. Random configuration has hidden a subset of genetic interactions selected uniformly at random. Submatrix and cross configurations have hidden all interactions within a random subset of genes or between two random disjoint subsets of genes, respectively. In the prediction scenario, complete genetic interaction profiles of a gene subset are removed.
Performance of imputation methods (Pearson correlation coefficient) proposed in this article for different missing data rates and missing value configurations. Refer to the main text and Figure 3 for description of the missing value scenarios. MC denotes matrix completion approach (sec. 3.2). Network-guided matrix completion (sec. 3.3) is represented by NG-MC-GO and NG-MC-PPI. Performance was assessed for the early secretory pathway E-MAP data set, because it contains the least missing values. The cross configuration is not applicable when more than 50% of the values are missing.
Figure 4 reports on the predictive performance of our matrix completion approach obtained by varying the fraction of missing values in the four missing data scenarios presented in Figure 3. For
Imputation accuracy has improved (Fig. 4) when E-MAP data were combined with gene annotation (NG-MC-GO) or protein–protein interaction (NG-MC-PPI) networks. These results support findings from experimental studies (Tong et al., 2004; Collins et al., 2007; Costanzo et al., 2010) that showed that if two proteins act together to carry out a common function, deletions of their corresponding encoding genes may have similar GI profiles. Furthermore, gene ontology annotations and synthetic lethality are correlated with ∼12% and ∼27% of genes that genetically interact, having either identical or highly similar gene ontology annotations, respectively (Tong et al., 2004; Michaut and Bader, 2012). Our NG-MC-GO and NG-MC-PPI models could exploit these strong links between functionally similar genes, physically interacting proteins, and GIs. Performance of integrated models in Figure 4 suggests the importance of combining interaction and functional networks for prediction of missing values in E-MAP data sets.
We observed deterioration of imputation accuracy when complete genetic interaction profiles were removed and NG-MC could only utilize circumstantial evidence (Fig. 4d). Decreased prediction performance suggests that measured gene interactions are the best source of information for predicting missing values in the E-MAP data. However, when the proportion of missing interactions was increased, the inclusion of additional genomic data was more helpful. With the exception of the prediction model for which the opposite behavior was observed, the performance difference between MC and NG-MC was small (∼10%) as long as <50% of the data were removed, but rose to above 20% when ≥60% of the data were removed (Fig. 4).
6.3. Data imputation by integration of gene networks
We studied imputation performance of our proposed approach on the recent lipid E-MAP data set by Surma et al. (2013). Figure 5 shows the Pearson correlation between the imputed and true interaction measurements when different types of circumstantial evidence were considered and various amounts and distributions of genetic interactions were excluded from the training set. Similarly as in experiments with the ESP data set (Fig. 4), prediction models inferred from the lipid E-MAP data that included prior knowledge performed better than models, which considered only interaction measurements. Figure 5 also reveals that best performance was attained when our NG-MC approach collectively considered both protein–protein interaction network and network derived from gene functional annotation data (NG-MC-GO-PPI). The NG-MC can simultaneously consult multiple gene networks during model inference and modify gene weights in each of the networks to achieve better prediction accuracy. As such, it does not require substantial network preprocessing prior model inference and is able to adjust for network influence by taking into account entire collections of considered networks. Figure 5 also conveys that the inclusion of additional knowledge into prediction models is more pronounced in scenarios with high missing data rates and nontrivial structure of missing measurements. Good performance of our approach in such scenarios is an appealing property and hence, NG-MC seems to be an attractive data imputation approach.
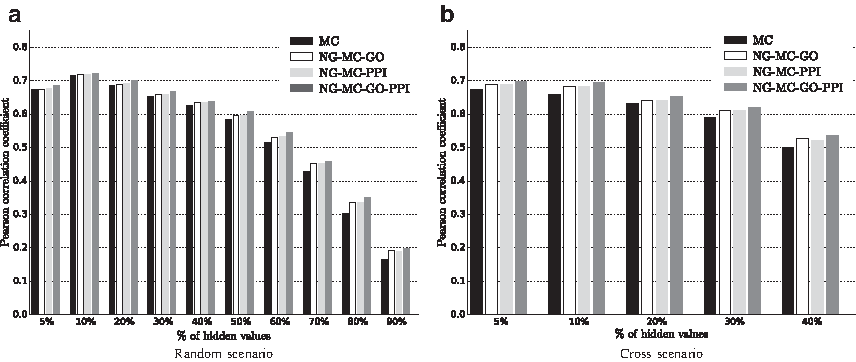
Imputation performance of network-guided matrix completion (NG-MC) for different fractions and distributions of missing values in the lipid E-MAP data set and for various sources of biological network information. Prior knowledge is included in the form of protein–protein interaction network (PPI), a network derived from gene ontology annotation data (GO) and collective consideration of both PPI and GO. Refer to Figure 3 for description of random and cross missing value configurations.
7. Conclusion
We have proposed a new missing value imputation method called network-guided matrix completion (NG-MC) that targets gene interaction data sets. The approach is unique in combining gene interaction and network data through inference of a single probabilistic model. Experiments with epistatic MAP interaction data sets show that inclusion of prior knowledge is crucial and helps NG-MC to perform better than a number of state-of-the-art algorithms we have included in our study. The results are encouraging and have potentially high practical value for prediction of genetic interactions that are otherwise unavailable to existing interaction measurements.
Footnotes
Acknowledgments
This work was supported by the Slovenian Research Agency (P2-0209, J2-5480), the National Institutes of Health (P01-HD39691), the European Commission (Health-F5-2010-242038), and the Fulbright scholarship.
Author Disclosure Statement
No competing financial interests exist.