
Abstract
Abstract
Tandem mass (MS/MS) spectrometry has become the method of choice for protein identification and has launched a quest for the identification of every translated protein and peptide. However, computational developments have lagged behind the pace of modern data acquisition protocols and have become a major bottleneck in proteomics analysis of complex samples. As it stands today, attempts to identify MS/MS spectra against large databases (e.g., the human microbiome or 6-frame translation of the human genome) face a search space that is 10–100 times larger than the human proteome, where it becomes increasingly challenging to separate between true and false peptide matches. As a result, the sensitivity of current state-of-the-art database search methods drops by nearly 38% to such low identification rates that almost 90% of all MS/MS spectra are left as unidentified. We address this problem by extending the generating function approach to rigorously compute the joint spectral probability of multiple spectra being matched to peptides with overlapping sequences, thus enabling the confident assignment of higher significance to overlapping peptide–spectrum matches (PSMs). We find that these joint spectral probabilities can be several orders of magnitude more significant than individual PSMs, even in the ideal case when perfect separation between signal and noise peaks could be achieved per individual MS/MS spectrum. After benchmarking this approach on a typical lysate MS/MS dataset, we show that the proposed intersecting spectral probabilities for spectra from overlapping peptides improve peptide identification by 30–62%.
1. Introduction
T
We address this issue as it relates to problem 2, where the probability of false peptides matching S with high score can become common when searching large databases, particularly for meta-proteomics (Chourey et al., 2013) and 6-frame translation (Castellana et al., 2008) searches, thus leading to higher-scoring false matches and stricter significance thresholds resulting in as little as 2% of all spectra being identified (Jagtap et al., 2012) since only the highest scoring PSMs become statistically significant even at 5% FDR.
Identifying peptides from a large database is less of a challenge than that of de novo sequencing, where the target database contains all possible peptide sequences. Yet, recent advances in de novo sequencing have demonstrated 97–99% sequencing accuracy (percent of amino acids in matched peptides that are correct) at nearly the same level of coverage (percent of amino acids in target peptides that were matched) as that of database search for small mixtures of target proteins (Guthals et al., 2012a, 2013). At the heart of this approach is the pairing of spectra from overlapping peptides (i.e., peptides that have overlapping sequences) to construct spectral networks (Bandeira et al., 2004; Guthals et al., 2012b) where a node represents an individual spectrum [or a consensus spectrum from a clustered set of spectra from the same precursor (Frank et al., 2008)] and edges denote pairs of spectra from peptides with overlapping sequences. It is then shown that de novo sequences assembled by simultaneous interpretation of multiple spectra from overlapping peptides are much more accurate than individual per-spectrum interpretations (Guthals et al., 2012a, 2013). Use of multiple enzyme digestions and strong cation exchange (SCX) (Edelmann, 2011) fractionation is becoming more common in MS/MS protocols to generate broader coverage of protein sequences and yield wider distributions of overlapping peptides, but current statistical methods still ignore the peptide sequence overlaps and separately compute the significance of individual peptides matched to individual spectra (Swaney et al., 2010).
Given that the set of all possible protein sequences is orders of magnitude larger than the human six-frame translation (or any other database), application of these de novo techniques to database search should substantially improve peptide identification rates, especially for large databases. Since the original generating function approach showed how de novo algorithms can be used to estimate the significance of PSMs for individual spectra, it is expected that advances in de novo sequencing should consequently translate into better estimation of PSM significance. It has already been shown that spectral networks can be used to improve the ranking of database peptides against paired spectra (Bandeira et al., 2007b), but it is still unclear how to accurately evaluate the statistical significance of peptides matched to multiple overlapping spectra. Intuitively, if it is known that these overlapping spectra yield more accurate de novo sequencing, then the probability of observing multiple incorrect high-scoring PSMs with overlapping sequences should be lower than the probability of single incorrect peptides matching single spectra with high scores. To this end, we introduce StarGF, a novel approach for peptide identification that accurately models the distribution of all peptide sequences against pairs of spectra from overlapping peptides. We demonstrate its performance on a typical lysate mass spectrometry dataset and show that it can improve peptide-level identification by up to 62% compared to a state-of-the-art database search tool.
2. Methods
2.1. Spectral probabilities and notation
We describe a method to assess the significance of overlapping PSMs based on the generating function approach for computing the significance of individual PSMs (Kim et al., 2008). Although traditional methods for scoring PSMs incorporate prior knowledge of N/C-terminal ions, peak intensities, charges, and mass inaccuracies, these terms are avoided here for simplicity of presentation, and later we describe how these features were considered for real spectra.
Let a peptide P of length n be a string of amino acids
Given a PSM (P, S) with score Score(P, S) = T, the spectral probability introduced by MSGF (Kim et al., 2008) computes the significance of the match as the aggregate probability that a random peptide P* achieves a Score(P*, S) ≥ T, otherwise termed as ProbT(S). The probability of a peptide
ProbT(S) is calculated from the SP matrix as follows:
2.2. Pairing of spectra
A pair of overlapping PSMs is defined as a pair (P, S) and (P′, S′) such that (1) both spectra are matched to the same peptide (P = P′) or (2) the spectra are matched to peptides with partially overlapping sequences: either P′ is a substring of P or a prefix of P′ matches a suffix of P. We also enforce that partially overlapping peptide sequences exist in the target database. For example, given the peptide pair PEPTIDE and PTIDES, we enforce that PEPTIDES is a substring of at least one protein in the database; otherwise, the pair is discarded. As mentioned above, spectral pairs can be detected using spectral alignment without explicitly knowing which peptide sequences produced each spectrum [as described previously (Pevzner et al., 2000; Bandeira et al., 2007a)]. Intersecting spectral probabilities (described below) are calculated for all pairs of spectra with overlapping PSMs. In addition, we use all neighbors of each paired spectrum to calculate the star probability for the center nodes in each subcomponent defined by S and all of its immediate neighbors.
2.3. Star probabilities
In the simplest case of a pair of overlapping PSMs (P, S) and (P′, S′), where P = P′, we want to find the aggregate probability that a random peptide matches S with score ≥ T and matches S′ with score ≥ T′ (denoted the intersecting spectral probability ProbT,T′ (S, S′)). A naïve solution is to simply take the product of ProbT(S) and ProbT′ (S′), but this approach fails to capture the dependence between ProbT,T′ (S, S′) induced by the similarity between S and S′. Intuitively, a high similarity between S and S′ should correlate with a high probability that both spectra get matched to the same peptide, regardless of whether it is a correct match.
ProbT,T′ (S, S′) can be computed efficiently by adding an extra dimension to the dynamic programming recursion SP, yielding a three-dimensional matrix ISPsame (i,t,t′) that tracks the aggregate probability that a random peptide P with mass i matches
ProbT,T′ (S, S′) is calculated from the ISPs matrix as follows:
To generalize intersecting spectral probabilities to include pairs of spectra from partially overlapping peptides, we define ISP (i,t,t′) to address the case where S′ is shifted in relation to S (see Fig. 1) by a given mass shift λ, which may be positive or negative. The shift λ defines an overlapping mass range between the spectra; in spectrum S, the range starts at mass b = max(0, λ) and ends at mass e = min(|S|, |S′| +λ), while in spectrum S′ the range starts at mass b′ = max(0, −λ) and ends at mass e′ = min(|S|, |S| − λ). Since partially overlapping spectra may originate from different peptides (λ ≠ 0 or |S| ≠ |S′|), the probabilities of peptides matching S must be processed differently from those matching S′. If one considers a peptide P matching S, only the portion of P from b to e (denoted as Povlp) can be matched against
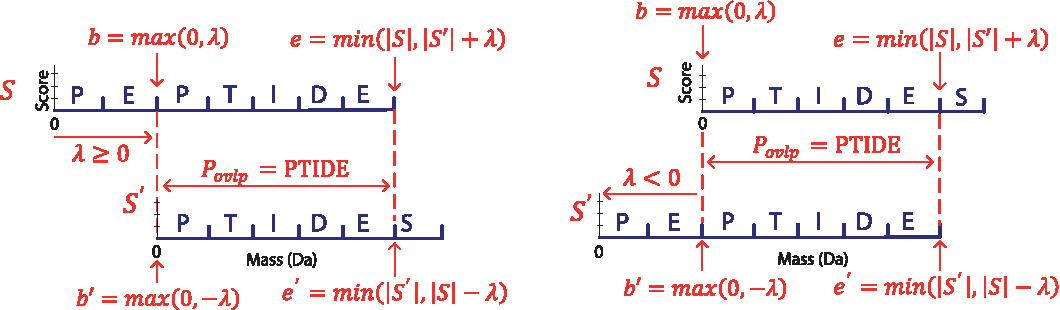
Illustration of Povlp and the overlapping mass range between overlapping spectra S and S′ matched to peptides (PEPTIDE, PTIDES) (left) and (PTIDES, PEPTIDE) (right), respectively.
The base case for ISP (i, t, t′) is the same as the base case for ISPs, but the recursion must be separated into three separate cases depending on whether i ≤ b, b < i ≤ e, or i > e. If i ≤ b, then ISP (i, t, t′) is tracking peptides matching
When i is inside the overlapping mass range of S, the matrix tracks peptides matching
When e < i ≤ |S| and, thus, i is outside the overlapping mass range, ISP (i, t, t′) is extending peptides P matching
If P matches S with score ≥ T and Povlp matches
Note that since λ may be positive or negative, the intersecting probability of a peptide P matching S′ with score ≥ T and Povlp matching
The term star is defined as the set of all spectra directly connected with spectrum S in the spectral network (Bandeira et al., 2007b). We are interested in the minimum
StarProbability(P,S):
T : = Score(P,S)
starP : = ProbT(S)
for all (S,S′) in the star of S:
λ : = mass shift of S′ in relation to S
T′ : = Score(Povlp,S′[b′ … e′])
if ProbT,T′(S, S′[b′ … e′]) > 0:
starP : = min(starP, ProbT,T′(S, S′[b′ … e′]))
return starP
2.4. Processing real spectra
Each MS/MS spectrum was transformed into a prefix-residue mass (PRM) spectrum (Dancík et al., 1999) with integer-valued masses and likelihood intensities
It is conceivable to further generalize star probabilities to include m > 2 networked PSMs by adding m − 1 more dimensions to the dynamic programming table (ISP) used to calculate intersecting spectral probabilities, but this would of course yield an exponential running time of O(|S|σ m |A|). Thus, it is possible that the results of the StarGF approach would further improve if further implementation efforts and compute time were invested into ways to approximate this calculation for larger components of networked spectra.
2.5. Generating candidate PSMs
A published set of ion-trap CID spectra acquired from the model organism Saccharomyces cerevisiae was used to benchmark this approach (Swaney et al., 2010). To aid in the acquisition of spectra from overlapping peptides, 12 SCX fractions were obtained for each of five enzyme digests. Three technical replicates were also run for each digest, but only spectra from the second replicate were used here. Thermo RAW files were converted to mzXML using ProteoWizard (Kessner et al., 2008) (version 3.0.3224) with peak-picking enabled and clustered using MSCluster (Frank et al., 2008) (version 2.0, release 20101018) to merge repeated spectra, yielding 255,561 clusters of one or more spectra.
MS-GFDB (Kim et al., 2010) (version 7747) was used to match spectra against candidate peptides from target and decoy protein databases. Two sets of target + decoy databases (labeled small and large) were used to evaluate the performance of individual versus StarGF spectral probabilities when searching databases of different size. The small target database consisted of all reference S. cerevisiae protein sequences downloaded from UniProt (Bairoch et al., 2008) (∼4 MB on 09/27/2013), while the large database contained all reference fungi UniProt protein sequences (∼130 MB on 09/27/2013). The large database (∼32 times larger) was used to represent searches against large search spaces, such as meta-proteomics (Chourey et al., 2013) or 6-frame translation (Castellana et al., 2008) searches. Separate small and large decoy databases were generated by randomly shuffling protein sequences from the target database (Elias and Gygi, 2007).
The 255,561 cluster-consensus spectra were separately searched against the small target, small decoy, large target, and large decoy databases with MS-GFDB (Kim et al., 2010) configured to report the top 10 PSMs for each spectrum. The “no enzyme” model was selected along with 30 ppm parent mass tolerance, “Low-res LCQ/LTQ” instrument ID, one 13C, two allowed nonenzymatic termini, and amino acid probabilities set to 0.05 (the same amino acid probabilities used by StarGF). Target and decoy PSMs were then merged by an in-house program that discarded decoy PSMs whose peptides were also found in the target database (allowing for I/L, Q/K, and M + 16/F ambiguities). Although variable posttranslational modifications (PTMs) were permitted in each initial search to reproduce typical search parameters (oxidized methionine and deamidated asparagine/glutamine), spectra assigned to modified PSMs were removed from consideration at this stage (the incorporation of PTMs into intersecting spectral probabilities is not considered here). The top-scoring peptide match for each remaining spectrum was then set to the target or decoy PSM with the highest matching score to the PRM spectrum. Each set of unfiltered target + decoy PSMs was evaluated at 1% FDR (Nesvizhskii, 2010) using star probabilities.
To benchmark StarGF, each set of MS-GFDB results was separately evaluated at 1% FDR using MS-GFDB's spectral probability (Kim et al., 2008) while allowing MS-GFDB to report the top-scoring PSM per spectrum. X!Tandem (Craig and Beavis, 2004) Cyclone (2011.12.01.1) was also run on the same set of MS/MS spectra in a separate search against each database, and results were filtered at 1% spectrum- and peptide-level FDR using the same target-decoy approach. X!Tandem search parameters consisted of 0.5 Da peak tolerance, 30 ppm parent mass tolerance, multiple 13C, and nonspecific enzyme cleavage (remaining parameters were set to their default values).
All raw and clustered MS/MS spectra associated with this study have been uploaded to the MassIVE public repository (Carver et al., 2013) while StarGF can be obtained from Carver et al., 2014.
3. Results
Two sets of pairwise alignments were used to demonstrate the effectiveness of StarGF: (1) the set of pairs obtained by spectral alignment in the spectral network (Bandeira et al., 2007b), and (2) to simulate the situation when maximal pairwise alignment sensitivity is achieved, pairs were also obtained using sequence-based alignment of the top-scoring peptide matches returned by the MS-GFDB searches. A pair of overlapping PSMs was retained if they shared at least seven overlapping residues and at least three matching theoretical PRM masses from the overlapping sequence. Networks of paired PSMs were generated using either one of these two pairing strategies, leading to two different star probability calculations for each PSM: one in which the star probability was selected as the minimum intersecting probability over all sequenced-based pairs (method 1), and the other where the star probability was selected as the minimum intersecting probability over all spectrum-based pairs (method 2). To eliminate the possibility of pairing unique peptides from different proteins, each target PSM pair was enforced to have at least one target protein containing the full sequence supported by the pair [e.g., the pair (PEPTIDE,PTIDES) must be supported by a protein containing the substring PEPTIDES].
Unless otherwise stated, results are reported after applying the sequence-based pairing strategy to 40,926 unmodified target PSMs from the small database (separately identified by MS-GFDB at 1% spectrum-level FDR), yielding 32,777 paired spectra in the network. Using these parameters, less than 1% of pairs contained at least one decoy PSM, while 5% of paired PSMs were decoys for the large database set. The significance of each PSM (P, S) was reported as the star probability of S. To evaluate the utility of intersecting probabilities, we separately assessed intersecting spectral probabilities for same-peptide pairs and partially overlapping pairs: we computed a same-peptide star probability (equal to the minimum
Figure 2 illustrates the substantial separation between individual spectral probabilities, same-peptide star probabilities, and partially overlapping star probabilities (top panel). Same-peptide star probabilities can be further separated into those where the minimum intersecting probability was selected for a pair of PSMs with equal precursor charge [higher correlation between MS/MS fragmentation patterns (Tabb et al., 2003)], and those where the minimum was selected for a pair with different precursor charge states (less-correlated MS/MS fragmentation). Due to repeated instrument acquisition of multiple spectra from the same peptide and charge state, it was expected that individual spectral probabilities would be approximately the same as intersecting probabilities for most same-peptide/same-charge pairs since duplicate spectra often have high similarity (Tabb et al., 2003). Nevertheless, star probabilities for same-peptide/same-charge pairs still prove valuable in improving spectral probabilities by an average of ∼2 orders of magnitude (Fig. 2, bottom left), while same-peptide/different-charge and partially overlapping pairs enable an even greater improvement in spectral probabilities by an average of ∼8 orders of magnitude.
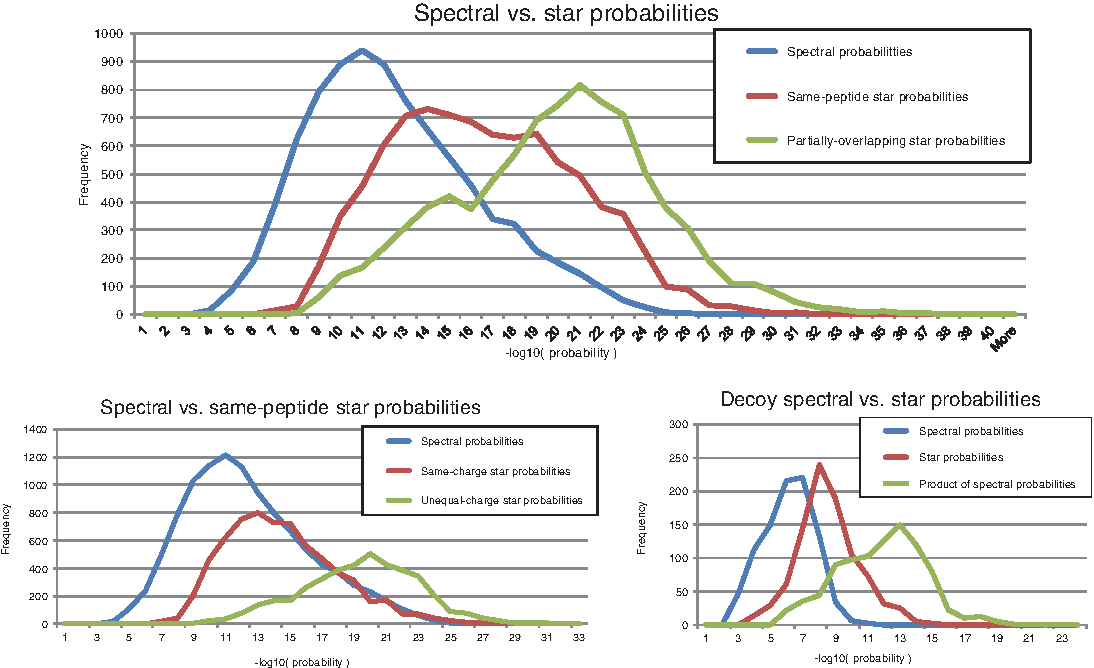
Spectral and star probability distributions of observed p-values. (Top) Distribution of the spectral, same-peptide star, and partially overlapping star probabilities for peptide–spectrum matches (PSMs) with at least one same-peptide pair and at least one partial overlapping pair. (Bottom left) Distribution of spectral, same-charge star, and unequal-charge star probabilities for PSMs from at least one same-peptide pair. (Bottom right) Distribution of spectral and star probabilities for all 919 small-database decoy PSMs found in the network where 480 had a same-peptide pair and 450 had a partially overlapping pair (11 had more than one pair). Also shown is the distribution of the product of individual spectral probabilities for the same decoys [where ProbT,T′ (S,S′) is computed as ProbT (S) * ProbT′ (S′)] to illustrate how it would substantially underestimate ProbT,T′ (S,S′) by ignoring the dependencies between repeated MS/MS spectra acquisitions from the same peptide with the same charge state.
The distributions of decoy spectral probabilities in the bottom right panel of Figure 2 illustrate the effect of star probabilities on paired decoy PSMs. It was rare for decoy PSMs to pair with others in the network (only 919 of 37,522 decoy PSMs were detected in a spectral pair), and those that did had their spectral probabilities improve by an average of ∼2 orders of magnitude, which is significantly less than that observed for correct PSM pairs. Also shown is the distribution of decoy star probabilities as computed by the product of probabilities (ProbT,T′ (S, S′) = ProbT(S)* ProbT′(S′)). As expected, the product of spectral probabilities ignores the dependencies between the spectra and severely under-estimates the true intersecting spectral probability by several orders of magnitude. This would likely lead to increased sampling of false-positive PSMs at any given star probability cutoff and thus result in an overall reduced number of identifications by requiring strict probability thresholds to achieve the same 1% FDR. This effect can be explained intuitively for a given pair of PSMs (P, S) and (P′, S′), where S = S′ and P = P′: if a random peptide matches S′ with a high score, then with probability 1 the same random peptide also matches S′ with an equally high score. Thus, in this special case, ProbT,T′(S, S′) should equal ProbT(S) = ProbT′(S′), not the product of the individual spectral probabilities.
Figure 3 compares every PSM's star probability to its optimal spectral probability, which is defined as the spectral probability of the same peptide matched against the subset of peaks from the spectrum that correspond to true PRM masses (i.e., a noise-free version of the spectrum). In general, star probabilities improved the least for spectral probabilities that were already close to optimal. But the vast majority of star probabilities improved past optimal, particularly for stars with same-peptide/unequal-charge and partially overlapping pairs. Star probabilities can improve past optimal when missing PRMs from one spectrum S are present in the overlapping region of the spectrum S is paired with, thus enforcing that high-scoring peptide matches contain prefix masses that would otherwise be missed. This demonstrates that StarGF probabilities can improve on spectral probabilities by orders of magnitude even if perfect separation between signal and noise peaks could be achieved for any given spectrum.
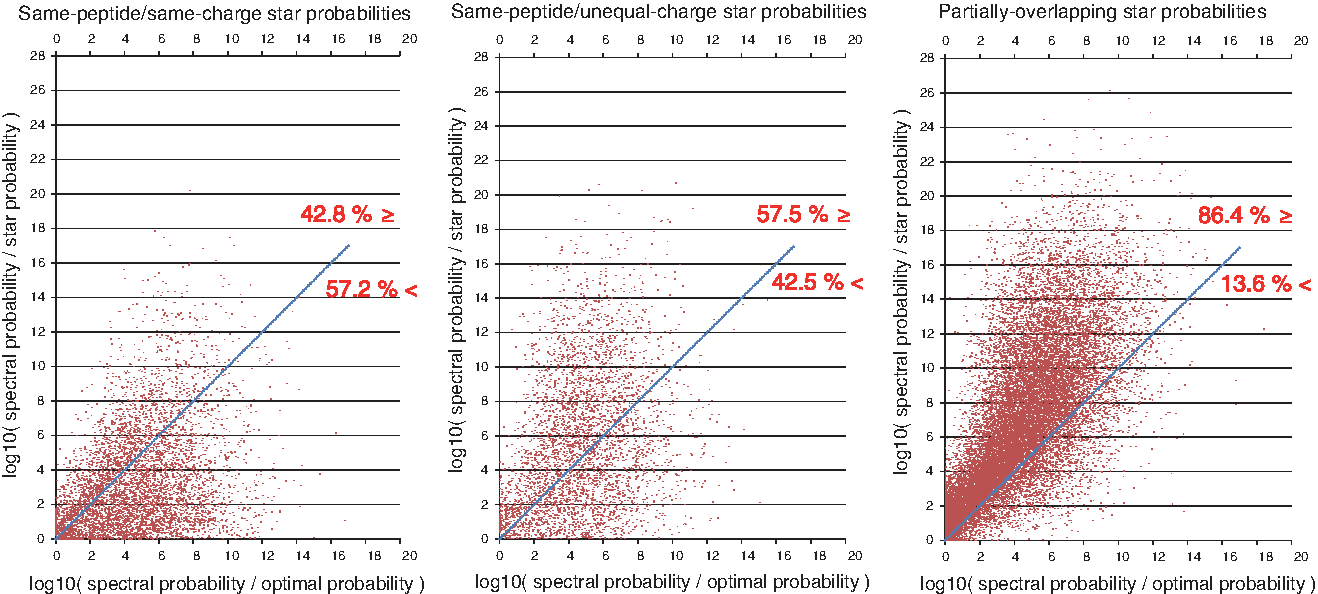
Reduction of star probability (y axis) with respect to optimality of starting spectral probability (x axis). Each red dot denotes either a same-peptide (left, middle) or partially overlapping (right) star probability. Values on the x axis that approach zero indicate a starting spectral probability that approaches optimal while larger values indicate suboptimal starting spectral probabilities (by orders of magnitude) due to the presence of unexplained PRM masses in the spectrum. Values on the y axis that approach zero indicate star probabilities that did not improve substantially over the original spectral probabilities, while larger values indicate star probabilities that are orders of magnitude smaller than spectral probabilities. The blue line is shown to indicate star probabilities that equal their optimal spectral probability; any data point above the blue line indicates a star probability that is more significant than optimal (see text for a detailed explanation). Red numbers next to the lines indicate the percentage of data points above and below each blue line.
Star probabilities of unfiltered target + decoy PSMs were evaluated at 1% FDR using both paired and unpaired PSMs (spectral probabilities were computed for unpaired PSMs). Paired PSMs that were identified by StarGF against the large database were verified to have an FDR of 1% (both at the spectrum level and peptide level) by considering any peptide identified against the fungi database to be a false positive if it was not present in the yeast database (allowing for I/L and Q/K ambiguities). Table 1 shows how many paired PSMs were identified by MS-GFDB (Kim et al., 2010) and StarGF using either spectral alignments or sequenced-based PSM alignments. Although sequenced-based alignment was effective here, it may prove difficult to pair spectra by top-scoring PSMs from very large databases (e.g., meta-proteomics databases or six-frame translations) where the highest-scoring PSMs are much less likely to be correct due to the increased search space. For these applications, spectral alignment may prove more effective at detecting pairs and using them to re-rank matching PSMs (as done by Bandeira et al., 2007b) before computing PSM significance by StarGF. Results for sequence-based alignments thus indicate the upper bound of improvement when perfect pairwise sensitivity is achieved by spectral alignment.
The “Small database” column indicates results using the UniProt reference yeast protein database (∼4 MB), while results on the right are from searching the larger UniProt reference fungi protein database (∼130 MB). Rows separate results by the type of alignment used to capture overlapping peptide–spectrum matches (PSMs): “Aligned spectra” indicates pairing by spectral alignment and “Aligned seqs.” indicates pairing by PSM sequence similarity.
Bold numerals indicate the increased percentage of PSMs/peptides captured by StarGF.
The 37% drop in MS-GFDB peptide identification rate of paired PSMs from the small to large database is expected since the larger search space allows decoy peptides and false matches to target to randomly match individual spectra with higher scores, thus decreasing the overall number of detected spectra/peptides at a fixed FDR. Using the same set of unfiltered PSMs as MS-GFDB, however, StarGF only lost 20% of paired peptides from the small database as it could identify 36–66% more spectra and 29–62% more peptides by significantly improving the significance of true overlapping PSMs while only marginally increasing the significance of decoy overlapping PSMs (see Table 1). Note that as described here StarGF could not identify any spectra that were matched to decoy peptides, but only re-rank them by their star probability. The drop in StarGF identification rate from the small to the large database is explained by this effect; of the 10,648 spectra identified in the small database search but missed in the large database, only 6% were assigned the same peptide from the large database and had their preferred neighbor (the paired PSM from which the lowest intersecting probability was selected) matched to the same peptide. The remaining PSMs were either matched to a different peptide (75%) or had their preferred neighbors matched to different peptides (19%). Thus, the majority (94%) of PSMs lost by StarGF from the small to the large database search could potentially be recovered by re-ranking candidate peptides against paired spectra [as done before in spectral networks using de novo sequence tags (Bandeira et al., 2007b)].
Although the results in Table 1 are over paired PSMs, StarGF still significantly improved spectrum- and peptide-level identification rate for all spectra since a large portion (89%) of all PSMs were paired (Table 2). Considering both paired and unpaired (unmodified) PSMs when searching against the small database, MS-GFDB was able to identify 40,926 spectra (34,165 peptides), while StarGF identified 50,310 spectra (35,521 peptides). However, when searching against the large database, MS-GFDB could identify only 27,128 spectra (22,782 peptides, 33% loss from the small-database search), while StarGF could identify 40,269 spectra (32,891 peptides, 16% loss from the small-database search) using PSM sequence alignments, an overall improvement over MS-GFDB of 48% more identified spectra (44% more identified peptides) and revealing StarGF to be nearly as sensitive when searching a 32 times larger database as MS-GFDB is when searching a small database.
The “Small database” column indicates results using the UniProt reference yeast protein database (∼4 MB), while results in the “Large database” column are from searching the larger UniProt reference fungi protein database (∼130 MB). (Top) Identification rates of all three search tools; numbers in bold indicate the increased percentage of IDs retained by StarGF compared to X!Tandem and MS-GFDB. (Bottom) Percent of PSMs and peptides lost by each search tool at 1% false-discovery rate as they moved from the small to large search space.
Figure 4 illustrates the overlap between peptides identified by MS-GFDB against the small database and peptides identified by StarGF. The majority (74%) of peptides identified by StarGF against the small database were also identified by MS-GFDB. The remaining peptides that MS-GFDB did not identify were predominantly found in PSM pairs (96%), and thus assigned higher significance by StarGF. Of the peptides identified by StarGF against the large database, nearly all matched peptides were “rescued” from sets of peptides identified against the small database by either MS-GFDB or StarGF.

Overlap of unique peptides identified at 1% peptide-level false-discovery rate. The top circle denotes peptides identified by MS-GFDB against the small database, while the left and right circles denote peptides identified by StarGF against the small and large databases, respectively. Peptides that only differed by I/L or K/Q ambiguities were counted as the same. Figure is not drawn to exact scale.
4. Discussion
While MS-GF (Kim et al., 2008) demonstrated how de novo sequencing techniques could be used to greatly improve the state of the art in peptide identification by rigorously computing the score distribution of all peptides against every spectrum, it still misses as many as 38% [ = ([26,689 − 16,525]/26,689) × 100] of identifiable (unmodified) peptides when searching large databases by ignoring the significance of overlapping PSMs (see Table 1). By now extending this principle using a multispectrum approach to compute the probability distribution of PSM scores for all peptides against every pair of overlapping spectra, StarGF is able to assign higher significance p-values to true PSMs while only marginally increasing the significance of false PSMs. Thus, where traditional database search loses sensitivity in searching larger databases, we now show that it is possible to regain nearly all peptides that are lost by MS-GFDB when searching a database 32 times the size. Although StarGF performs best when paired with MS/MS protocols that maximize acquisition of spectra from partially overlapping peptides, our results indicate that significant gains in identification rate can still be made by utilizing commonly observed pairs of spectra from the same peptide, particularly pairs of spectra with different precursor charge states.
Previous applications of multiple enzyme digestions have demonstrated significant gains in proteome coverage, but did not address how they could be used to improve peptide identification rates against larger search spaces (Swaney et al., 2010). The results presented in Figure 2 particularly demonstrate how independent MS/MS acquisitions of the same peptide sequence, whether they are from different charge states or overlapping peptides, dramatically reduce the probability of random peptides matching both spectra. This should give greater value toward the application of multiple enzyme digestions and further offset the elevated experimental costs associated with their application.
Although StarGF significantly outperforms a state-of-the-art database search tool (MS-GFDB) (Kim et al., 2010) in identifying tandem mass spectra at an empirically validated FDR of 1% (confirmed here using matches to nonyeast peptides in the large fungi database), it would be useful to thoroughly assess the limitations of the target/decoy approach when estimating FDR for searches against small databases, as previously done for MS-GFDB searches (Jeong et al., 2012). In some cases, the enforcement of overlapping PSMs may sometimes result in so few decoy PSMs that it becomes difficult to accurately estimate FDR (Gupta et al., 2011). A similar situation can also occur in searches with highly accurate parent masses since the number of high-scoring decoy peptides with a given parent mass becomes miniscule with decreasing parent mass tolerance.
While the generating function described here supports only unmodified peptides, it can be extended to analyze modified peptides by considering modified amino acid mass edges [as shown before (Kim et al., 2010)]. Further improvements are foreseeable with additional support for high-resolution MS/MS peak masses and incorporation of alternative fragmentation modes (e.g., HCD, ETD) to improve of the quality of PRM spectra, especially if from highly charged precursors (Guthals and Bandeira, 2012). Given that MS-GFDB supports multiple fragmentation modes and that we utilize PepNovo+ to transform MS/MS spectra to PRM spectra, it is possible for this approach to support any fragmentation mode since PepNovo+ can be trained to process new types of spectra (Guthals et al., 2013).
Footnotes
Acknowledgment
This work was partially supported by the National Institutes of Health Grant 8 P41 GM103485-05 from the National Institute of General Medical Sciences.
Author Disclosure Statement
No competing financial interests exist.