




Abstract
Abstract
Conventional computational approaches for protein function prediction usually predict one function at a time, fundamentally. As a result, the protein functions are treated as separate target classes. However, biological processes are highly correlated in reality, which makes multiple functions assigned to a protein not independent. Therefore, it would be beneficial to make use of function category correlations when predicting protein functions. In this article, we propose a novel Maximization of Data-Knowledge Consistency (MDKC) approach to exploit function category correlations for protein function prediction. Our approach banks on the assumption that two proteins are likely to have large overlap in their annotated functions if they are highly similar according to certain experimental data. We first establish a new pairwise protein similarity using protein annotations from knowledge perspective. Then by maximizing the consistency between the established knowledge similarity upon annotations and the data similarity upon biological experiments, putative functions are assigned to unannotated proteins. Most importantly, function category correlations are gracefully incorporated into our learning objective through the knowledge similarity. Comprehensive experimental evaluations on the Saccharomyces cerevisiae species have demonstrated promising results that validate the performance of our methods.
1. Introduction
D
Since many biological experimental data can be readily represented as networks, learning on graphs is one of the most natural ways to predict protein functions (Sharan et al., 2007). Neighborhood-based methods (Schwikowski et al., 2000; Hishigaki et al., 2001; Chua et al., 2006, 2007) assign functions to a protein based on the most frequent functions within a neighborhood of the protein, and they mainly differ in how the “neighborhood” of a protein is defined. Network diffusion-based methods (Nabieva et al., 2005; Weston et al., 2004) view the interaction network as a flow network, on which protein functions are diffused from annotated proteins to their neighbors in various ways. Other function prediction approaches via biological networks include graph cut–based approaches (Vazquez et al., 2003; Karaoz et al., 2004), and those derived from kernel methods (Liang et al., 2008). Recently, two graph-based protein function prediction methods (Wang et al., 2012, 2013) using protein–protein interaction (PPI) graphs were developed to take advantage of the function–function correlations by considering protein function prediction as a multilabel classification problem, which took the same perspective as ours in the current work. Jiang et al. (2008) also proposed to utilize function–function similarity, though not explicitly, through the tree approximation of gene ontology.
Experimental data from one single source are usually incomplete, sometimes even misleading (Whisstock and Lesk, 2004); therefore, predicting protein function using multiple biological data has also attracted increased attention. For example, Lanckriet et al. (2004) proposed a kernel-based data fusion approach to integrate multiple experimental data via a hybrid kernel and use support vector machine (SVM) for classification. Tsuda and Noble (2004) presented a locally constrained diffusion kernel approach to combine multiple types of biological networks. Artificial neural network was employed in Shi et al. (2009) to integrate different protein interaction data.
All above conventional computational approaches usually consider protein function prediction as a standard classification problem (Lanckriet et al., 2004; Shin et al., 2007; Sun et al., 2008). That is, these approaches predict one function at a time, fundamentally. As a result, the classification for each functional category is conducted independently. However, in reality most biological functions are highly correlated, and protein functions can be inferred from one another through their interrelatedness. The function category correlations, albeit useful, are not fully utilized in predicting protein function in the earlier works. In this study, we explore this special characteristic of the protein functional categories and take advantage of the function–function correlations to improve the overall predictive accuracy of protein functions.
1.1. Multilabel correlated protein function prediction
Because a protein is usually observed to play several functional roles in different biological processes within the same organism, it is natural to annotate it with multiple functions. Therefore, protein function prediction is a multilabel classification (Wang et al., 2009, 2010a, 2011a) problem. The essential difference between single-label classification and multilabel classification lies in that (Wang et al., 2009, 2010a, 2011a) classes in the former are assumed to be mutually exclusive, while those in the latter are generally correlated to each other. Multilabel data, such as those used in protein function prediction, present a new opportunity to improve classification accuracy through label correlations, which are absent in single-label data. For example, when applying Functional Catalogue (FunCat) annotation scheme (version 2.1) (Mewes et al., 1999) on Saccharomyces cerevisiae genome, we observe that there is a big overlap between the proteins annotated to function “Cell Fate” (ID: 40) and those annotated to “Cell Type Differentiation” (ID: 43). As shown in the left panel of Figure 1, among 268 proteins annotated with function “Cell Fate” in S. cerevisiae genome, 168 proteins are also annotated with function “Cell Type Differentiation,” whereas the average number of proteins annotated with other functions is only about 51. From this observation, we can reasonably speculate that these two functions are statistically correlated in a stronger way. That is, if a protein is known to be annotated with function “Cell Fate” by either experimental or computational evidences, we have high confidence to annotate the same protein with function “Cell Type Differentiation” as well.
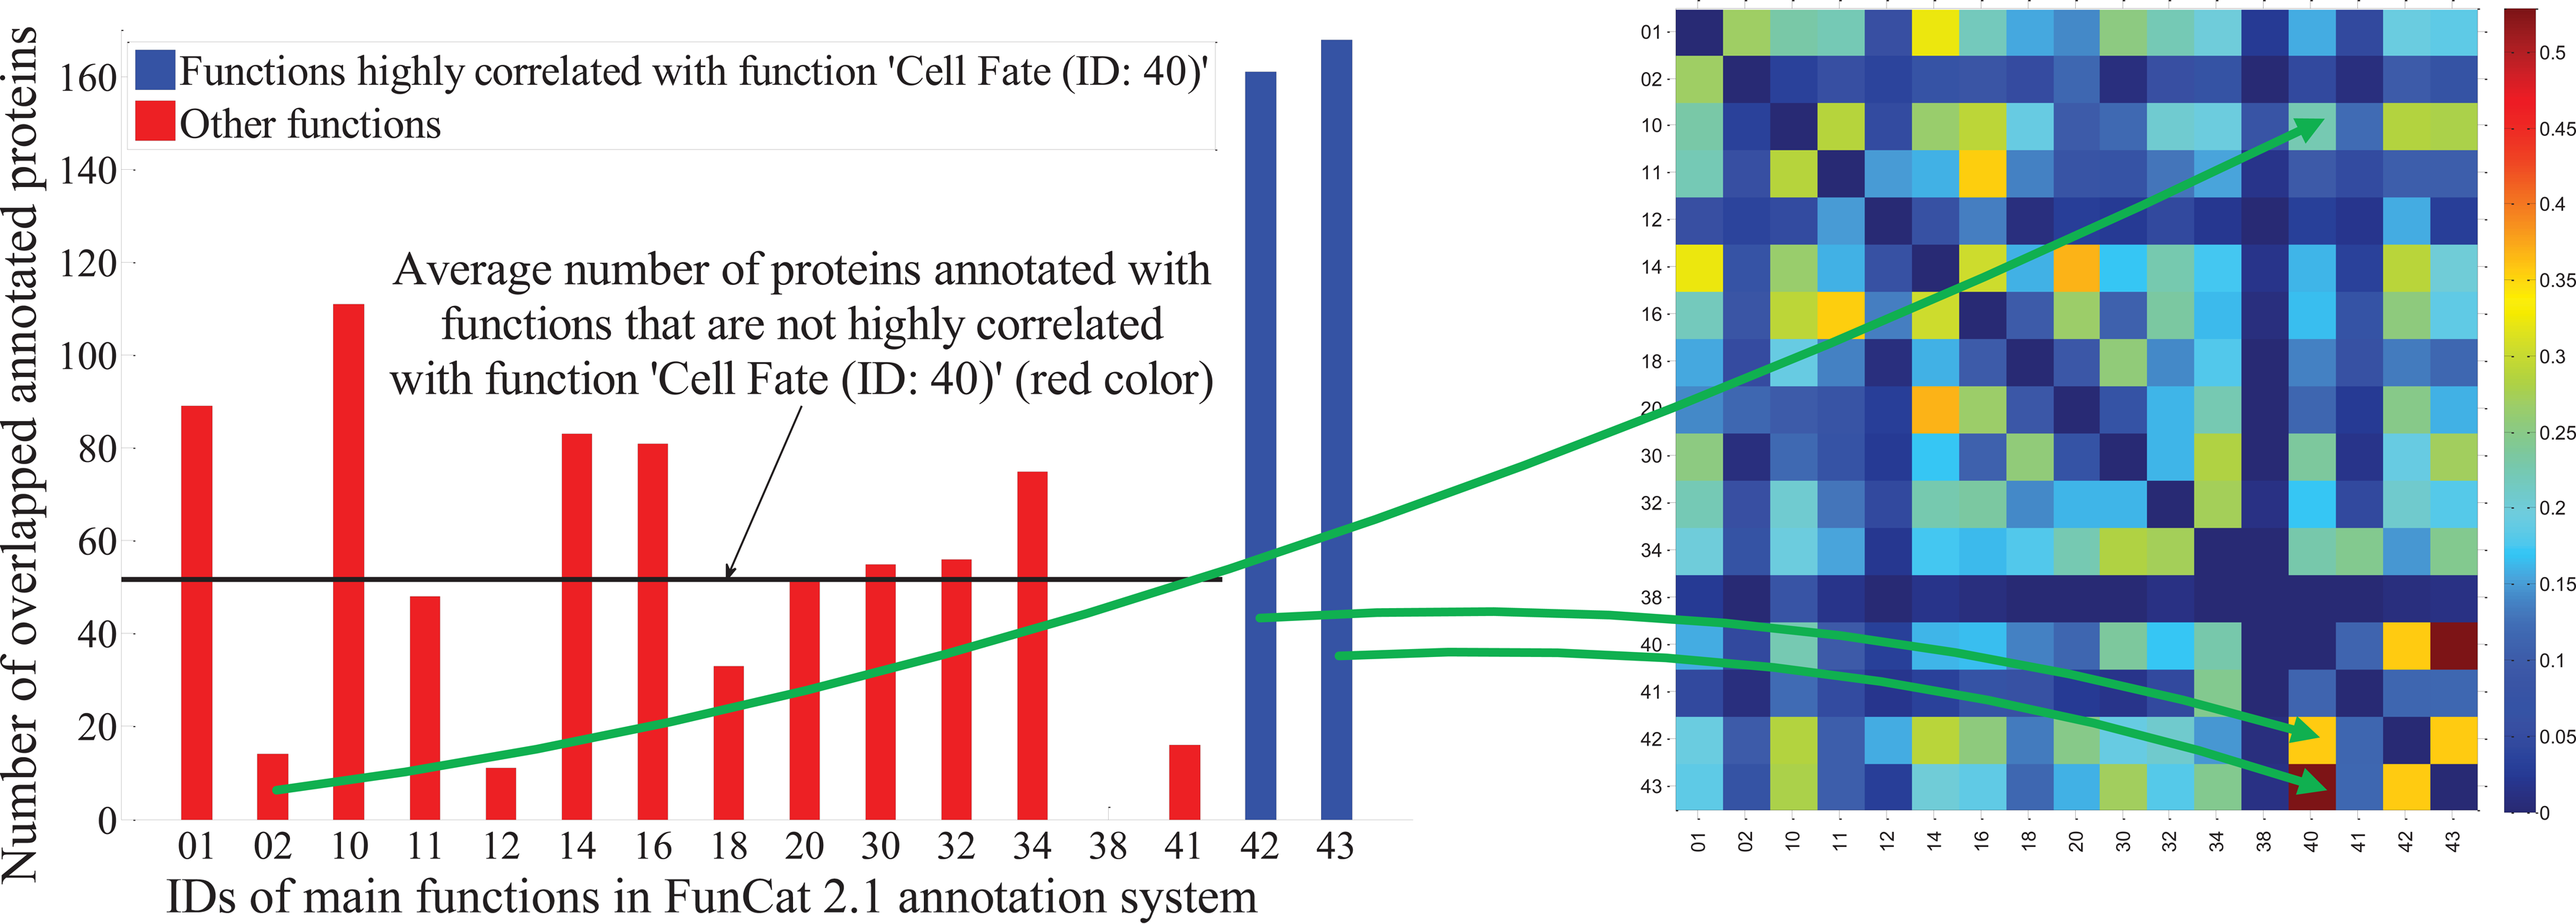
(Left) Number of proteins annotated with both function “Cell Fate” (ID: 40) and one of the other functions. (Right) Visualization of the correlation values defined by Equation (2) among the 17 main functions defined in FunCat 2.1 to the S. cerevisiae genome.
1.2. Data-knowledge consistency and our motivations
In protein function prediction, we need both experimental data and biological knowledge. Here we refer to data as original experimental measurements or results, such as protein sequences, PPI networks measured by yeast two-hybrid screening, gene expression profiles, etc. On the other hand, knowledge refers to human-curated research findings recorded in well structured databases or documented in biomedical literatures, such as human-encoded annotation databases, ontologies, etc.
In most existing approaches for protein function prediction, knowledge is routinely used as supervision in the classification tasks, that is, protein annotations are interpreted as labels assigned to data points. In this study, we employ knowledge information from a new perspective. Motivated by the observation that label indications in a multilabel classification task (i.e., protein function annotations in protein function prediction problems) convey important attribute information (Wang et al., 2010b), we use the function annotations of a protein as its description and assess pairwise protein similarities upon such descriptions. The key assumption of our work is that two proteins are likely to have large overlap in their annotated functions, if they are highly similar according to experimental data. More precisely, let
With this assumption, we may determine the optimal function assignments to unannotated proteins by minimizing the difference between these two sets of similarities, that is, maximizing the consistency between experimental data and biological knowledge. In this article, we formalize this assumption by proposing our Maximization of Data-Knowledge Consistency (MDKC) approach. Through the knowledge similarity
1.3. Notations and problem formalization
In protein function prediction, we are given K biological functions and n proteins. Without losing generality, we assume the first l proteins are annotated, and our goal is to predict functions of the rest n−l unannotated proteins.
Let
2. Formulation of Function Category Correlations
Before we proceed to the algorithm development of our new approach, we first explore and formalize the function category correlations, because they are one of our most important mechanisms to boost protein function prediction performance.
As shown in the left panel of Figure 1, proteins assigned to two different functions may overlap. Statistically, the bigger the overlap, the more closely two functions are related. Therefore, functions assigned to a protein are no longer independent. Instead, they can be inferred from one another. In the extreme case, such as in parent–child hierarchy of protein function annotation systems, once we know a protein is annotated to a child function, we can immediately annotate all the ancestor functions to the same protein.
Using cosine similarity, we define a function category correlation matrix,
where
Using FunCat annotation scheme on S. cerevisiae genome, function correlations defined in Equation (2) are illustrated in the right panel of Figure 1. The high correlation value between functions “Cell Fate” and “Cell Type Differentiation” shown in the figure implies that they are highly correlated, which agrees with the observations shown in the left panel. In addition, as can be seen in the right panel of Figure 1, some other function pairs are also highly correlated, such as “Transcription” and “Protein with Binding Function or Cofactor Requirement,” “Regulation of Metabolism and Protein Function,” and “Cellular Communication/Signal Transduction Mechanism,” etc. All these observations strictly comply with the biological truth, which firmly justifies the correctness of our formulation for function category correlations in Equation (2) from the biological perspective.
3. Maximization of Data-Knowledge Consistency (MDKC) Approach
We assume that two proteins tend to have large overlap in their assigned functions if they are very similar in terms of some experimental data. In order to predict protein functions upon this assumption, we evaluate the similarity between two proteins in the following two ways, one by experimental data called as data similarity, and the other by biological knowledge called as knowledge similarity. We denote the former as
where the constraint in Equation (4) fixes the functions assigned to annotated proteins to be ground truth. The optimization objective in Equation (3) minimizes the overall difference between the two types of similarities, which thereby maximizes the data-knowledge consistency.
3.1. Optimization framework of the MDKC approach
In protein function prediction, the data similarity is already known a priori. Namely,
Now we consider knowledge similarity. The simplest method to evaluate the knowledge similarity is to count the number of common annotated functions of two proteins:
where, for notation brevity, we denote A=C−1 in the sequel.
Note that compared to the inner product similarity defined by
Utilizing the knowledge similarity defined in Equation (5), we can formalize the data-knowledge consistency assumption in Equation (3) by the following optimization problem:
In standard classification problems in machine learning, Fik (1≤i≤l)are fixed for labeled data points. Specifically, a big Fik indicates that data point
where α>0 controls the relative importance of this penalty. Following the experiences in graph-based semi-supervised learning (Wang et al., 2009, 2012), we empirically set α=0.1 in all our experiments.
Finally, we write our objective in a more compact way using matrices to minimize the following:
where
We call Equation (9) as our proposed Maximization of Data-Knowledge Consistency (MDKC) approach. Upon solving Equation (9), we can assign putative functions to an unannotated protein—say, the i-th protein—via
3.1.1. A more in-depth look at MDKC approach
Equation (9) reveals the insight of our MDKC approach, that is, we attempt to approximate the data similarity using the knowledge similarity. The former is already known in biological experiments thereby fixed, while only part of the latter is known for annotated proteins and our task to identify the part for unannotated proteins. When non-negativity is enforced to F, min ‖W–FCFT‖2 is a non-negativity matrix factorization (NMF) problem (Lee and Seung, 2001; Ding et al., 2010) as Wij>0 by definition.
The true power of our approach lies in that NMF is equivalent to spectral clustering when W is the edge weight matrix of a graph. This equivalence has been proved by Ding et al. (2006, 2010). Therefore, our approach can be seen to seek the shared structures of function assignments upon the topological modularity of an input graph from experimental data. Compared to traditional spectral clustering algorithms, which are unsupervised and their annotation information cannot be used, our approach is able to exploit the information conveyed by both labeled and unlabeled data. Most importantly, function category correlations are taken into account, thereby more information is used for protein function prediction.
3.2. Computational algorithm of the MDKC approach
Mathematically, Equation (9) is a regularized NMF problem (Cai et al., 2008; Gu and Zhou, 2009; Cai et al., 2010). Although the optimization techniques for the NMF problem and its variants have been extensively studied in literature (Ding et al., 2006, 2010; Cai et al., 2008; Gu and Zhou, 2009; Cai et al., 2010), solving Equation (9) is very challenging. Most, if not all, existing algorithms to solve NMF problems are only able to deal with rectangle input matrices (a rectangle matrix is a matrix whose number of the rows is different from that of its columns) or asymmetric square matrices, but not symmetric input matrices such as the one used in our objective in Equation (9). This is because the latter involves a fourth-order term due to the symmetric usage of the factor matrix F (Wang et al., 2011b,c), which inevitably complicates the problem. Traditional solutions to symmetric NMF typically rely on heuristics (Ding et al., 2006; Li et al., 2007), hence we propose a principled solution via proving a new generic matrix inequality as presented below. We introduce a new algorithm to solve Equation (9) in Algorithm 1. We prove its correctness and convergence as follows.
3.2.1. Correctness of the algorithm
The following theorem guarantees the correctness of Algorithm 1.
where we exploit the properties of W=WT, A=AT, VT=V, and for any matrix M we have
Then by removing the constant terms, we take the derivative of JMDKC (F) with respect to F as follows:
Then the Karush-Kuhn-Tucker (KKT) conditions for nonnegativity of F is
which is the fixed point relationship that the solution must satisfy.
On the other hand, at the convergence of Algorithm 1, F(∞)=F(t+1)=F(t), thus we can derive:
which is identical to Equation (12) and proves Theorem 1. ■
3.2.2. Convergence of the algorithm
We use the auxiliary function approach (Lee and Seung, 2001) to prove the convergence of Algorithm 1. Here, we first introduce the definition of auxiliary function (Lee and Seung, 2001).
The following inequality is also useful in our following proofs.
Lemma 2 can only be used to deal with NMF with rectangle matrices or asymmetric square matrices, but not symmetric matrices, such as those used in our objective in Equation (9). As one of our theoretical contributions, we prove the following generic matrix inequality in Equation (15) to analyze objective functions involving fourth order matrix polynomials.
Now, switching indexes: i ⇔ j, p ⇔ q, r ⇔ k, we obtain
The second term in RHS of Equation (15) is
Now, switching indexes: i ⇔ j,p ⇔ q, and r ⇔ k, we obtain
Careful examination of the RHS of Equations (16) (19) shows that they are identical except u4 terms. Thus, the RHS of Equation (15) is
The LHS of Equation (15) is
Based on Lemmas 1–3, now we prove the convergence of Algorithm 1 by the following theorem.
then the following function
is an auxiliary function of J (G). Furthermore, it is a convex function in G and its global minimum is
By Lemma 3, we have
Because of Lemma 2 and the inequality 2ab≤a2 + b2, we have
Because z≤1 + log z, ∀ z>0, we have
Summing over all these bounds, we get Z (F, F′), which clearly satisfies (1) Z (F, F′)≥J (F) and (2) Z (F, F)=J (F).
Following the same derivations as in Ding et al. (2010, 2006) and Gu and Zhou (2009), the Hessian matrix of Z (F, F) is positive definite. Thus Z (F, F′) is a convex function of F. We obtain the global minimum of Z (F, F′) by setting dZ (F, F′) / dFij=0 and solving for F, from which we can get Equation (10) in the main text. This completes the proof of Theorem 2. ■
Because J (F) in Eq. (9) is obviously lower bounded by 0, Lemma 1 and Theorem 2 guarantee the convergence of Algorithm 1.
Note that Lemma 3 and Equation (23) is the key step to prove the convergence of the proposed algorithm. Due to the symmetric usage of the side factor matrix F, the optimization objective Equation (9) involves a fourth-order term of F. Compared to the quadratic term involved in traditional NMTF for rectangle (asymmetric) input matrix, optimizing Equation (9) is definitely much harder. As a result, in existing works Ding et al. (2005, 2006;) and Li et al. (2007), heuristics are routinely used to tackle this difficulty. Only until our recent works (Wang et al., 2011b,c), by proving the generic matrix inequality in Lemma 3, we are able to rigorously derive an iterative algorithm as in Algorithm 1 and prove its convergence.
4. Results and Discussion
We evaluate the proposed MDKC approach on S. cerevisiae genome data and apply it on PPI network data, protein sequence data, and an integration of these two types of experimental data, respectively.
We use MIPS Functional Catalogue (FunCat) system (Mewes et al., 1999) to annotate proteins, which is an annotation scheme for the functional description of proteins from prokaryotes, unicellular eukaryotes, plants, and animals. Taking into account the broad and highly diverse spectrum of known protein functions, FunCat (version 2.1) consists of 27 main functional categories that cover general fields such as cellular transport, metabolism, cellular communication, etc. The main branches exhibit a hierarchical and treelike structure with up to six levels of increasing specificity; 17 main function categories in FunCat annotation scheme are involved to annotate the yeast genome as listed in Table 1.
4.1. Evaluation on PPI network data
We first evaluate our MDKC approach on PPI network data, as they are the most popularly used experimental data for protein function prediction (Sharan et al., 2007). We compare our MDKC approach to four broadly used graph-based protein function prediction approaches: (1) Majority Voting (MV) approach (Schwikowski et al., 2000), (2) Iterative Majority Voting (IMV) approach (Vazquez et al., 2003), (3) χ2 approach (Hishigaki et al., 2001), and (4) Functional Flow (FF) approach (Nabieva et al., 2005). We use precision-recall curves to assess prediction performance, which is the most widely used performance metric in existing literature.
4.1.1. Data preparation
We download PPI data for the S. cerevisiae species from BioGRID (version 2.0.56) (Stark et al., 2006). By removing the proteins connected by only one PPI, we end up with 4403 annotated proteins with 86167 PPIs. We represent the protein interaction network as a graph, with vertices corresponding to the proteins and edges corresponding to PPIs. The adjacency matrix of the graph is denoted as B ∈ {0, 1}n×n where n=4403, such that Bij=1 if proteins
The adjacency matrix B itself measures the similarity among proteins in the sense that two proteins are related if they interact. However, two critical problems prevent us from directly using B as data similarity
where |V | is the number of vertices in the PPI graph, PR
k
(i, j) is the path ratio of the paths of length k between proteins
where (·)
ij
denotes the ij-th entry of a matrix, and the following (Pei and Zhang, 2005)
where di=∑ j Bij is the degree of the i-th vertex, and N (i) denotes its neighboring vertices. The detailed explanation of TM measurement can be referred to Pei and Zhang (2005).
4.1.2. Improved precision-recall performance
In order to generate the precision-recall curves for evaluation, we randomly select half of the proteins as annotated proteins and the rest as unannotated ones. The optimal result F* of our MDKC produces a ranking list to indicate prediction confidence. Varying threshold, we obtain a precision-recall curve. Precision-recall curves for other compared approaches are produced following Chua et al. (2006). For MV approach, the k most frequent functions appearing in a protein's neighbors are assigned as the k most likely function, such that a precision-recall curve is obtained by varying k. For χ2 approach, we take the k largest χ2 statistics as the k most likely function to build the precision-recall curve. Because the solution to IVM approaches are not unique for every trial, we repeat the experiment several times to obtain the precision-recall pairs. FF produces a ranking list, which are used to generate the precision-recall curve.
The prediction results for function “Metabolism” are shown as in Figure 2(a), which has 1397 annotated proteins in the original data before random selection (the biggest number of annotated proteins among all 17 functional categories). The prediction results for two other functions “Cellular Transport, Transport Facilitation and Transport Routes” and “Cell Type Differentiation” are shown in Fig. 2b and c, which have 995 and 437 annotated proteins respectively. The precision-recall curves for other functions can not be presented due to space, from which the same observations can be seen. All these results show that the proposed MDKC approach significantly improves the prediction performance, which validates the effectiveness of our approach when the data similarity is derived from PPI network data.

Precision-recall curves by the five compared approaches for three functional categories in FunCat 2.1.
In addition to reporting the protein function prediction performances over each individual biological function of the compared methods as above, we also report their average predictive capabilities over all the 17 biological functions. As shown in Figure 2, every compared method produces a precision-recall curve for a single biological function when we vary the thresholds, thus every curve comprises many different pairs of precision and recall corresponding to setting a threshold value, where one pair corresponds to a point of the curve. In order to compare the overall predictive performance of the compared methods, from each precision-recall curve for a single biological function we pick up the precision-recall pair (point) that produces the best F1 score. Then we average the 17 best F1 scores from all the biological functions for a compared method and report it in Table 2. Obviously, the results in Table 2 demonstrate the better predictive capability of our new method.
FF, functional flow; IMV, iterative majority voting; MDKC, maximization of data-knowledge consistency; MV, majority voting.
4.2. Evaluation on protein sequence data
Because sequence is the most fundamental form to describe a protein, which contains important structural, characteristic, and genetic information, we evaluate the proposed MDKC approach using protein sequences. We compare the predictive accuracy of our approach against the (1) functional similarity weight (FS) approach (Chua et al., 2006) and (2) kernel-based data fusion (KDF) approach (Lanckriet et al., 2004). We also report the performance of majority voting (MV) approach (Schwikowski et al., 2000) as a baseline. We employ broadly used average precision and average F1 scores (Chua et al., 2006) as performance metrics.
4.2.1. Adaptive decision boundary for prediction
Although the evaluation through precision-recall curves in section 4.1 makes sense in scientific research, it does not make explicit predictions. In practice, however, specific putative functions for unannotated proteins are required for further post-genomic researches and applications, therefore a decision boundary (threshold) is necessary.
In many semisupervised learning algorithms, the threshold for classification is usually selected as 0, which, however, is not necessary to be the best choice. We use an adaptive decision boundary to achieve better predictive performance, which is adjusted such that the weighted training errors on annotated proteins are minimized.
Considering the binary classification problem for the k-th functional category, we denote bk as the decision boundary, S+ and S− as the sets of positive and negative samples for the k-th class, and e+(bk) and e−(bk) as the numbers of misclassified positive and negative training samples. The adaptive (optimal) decision boundary is given by the Bayes' rule as follows:
And the decision rule to assign a function to protein x
i
is given by:
4.2.2. Data preparation
We obtain sequence data from GenBank (Benson et al., 2006) and describe a protein sequence through one kind of its elementary constituents, that is, trimers of amino acids. Trimer, a type of k-mer (when k=3) broadly used in sequence analysis, considers the statistics of one amino acid and its vicinal amino acids, and regards any three consecutive amino acids as a unit to preserve order information, for example “ART” is one unit and “MEK” is another one. The trimer histogram of a sequence hence can be used to characterize a protein x
i
, which is denoted as Pi. Because histogram indeed is a probability distribution, we use Kullback-Leibler (KL) divergence (Kullback and Leibler, 1951), a standard way to assess the difference between two probability distributions, to measure the distance between two proteins, which is defined as:
where k denotes the index of the k-th trimer. Because KL divergence is nonsymmetric, that is,
Finally, the pairwise data similarity W is defined by converting the symmetrized KL divergences through the standard way:
4.2.3. Improved predictive capability
We perform standard five-fold cross validation to evaluate the compared approaches and report the average performance of five trials in Table 3. For FS approach, because it does not supply a threshold, we use the one giving the best F1 score to make the prediction. We implement two versions of our method to evaluate the contributions of each of its components. First, we solve Equation (9) by Algorithm 1, which is the proposed method. Second, we solve a degenerate version of the problem in Equation (9) by not incorporating the correlations between functional categories. Specifically, we replace FAFT in Equation (9) by FFT, which is denoted by MDKC-S.
FS, functional similarity weight; KDF, kernel-based data fusion.
The results in Table 3 show that our MDKC-S and MDKC approach clearly outperform the other compared approaches, which concretely quantify the advantage of our approaches. The improvement on classification performance of the MDKC approach over the MDKC-S approach clearly justifies the usefulness of function–function correlations in predicting putative protein functions.
We further study the proposed method by using the knowledge similarity learned by using Gene Ontology (GO) (Consortium et al., 2008) terms. We randomly pick up 30 terms from every one of the three domains of GO and use the selected 90 terms to annotate the same set of proteins as above. We compute the function similarity using the following two different approaches. The first approach is the cosine similarity proposed in section 2, where we compute the function similarities using the training data (four folds out of the five folds) of each of the five experimental trails in the cross-validation. In addition, we also compute the function similarity using the semantic similarity between terms as proposed in Dotan-Cohen et al. (2009).We compare the proposed method against the same set of competing methods as before and report the results in Table 4. From the results, we can see that our new method once again performs better, especially when functional similarity is utilized. In addition, the classification performances of our method do not change much when using different function similarities, which demonstrates the robustness of our new method.
4.3. Evaluation on integrated biological data
As mentioned earlier, biological data from one single experimental source only convey information for certain aspects, which are usually incomplete and sometimes misleading. For example, similar sequences do not always have similar functions. In the extreme case, proteins with 100% sequence identity could perform different functional roles (Whisstock and Lesk, 2004). Therefore, integration of different biological data is necessary for more robust and complete protein function inferences. In general, results learned from a combination of different types of data are likely to lead to a more coherent model by consolidating information on various aspects of the same biological process. In this subsection, we evaluate the predictive performance using the integrated data from both PPI networks and protein sequences. We compute the data similarity for each individual data in the same ways as in section 4.1 and section 4.2, which are denoted as WPPI and Wsequence respectively. The integrated data similarity W is hence computed as follows:
where γ is a balance parameter and empirically selected as
We compare the predictive performance of our MDKC approach to two data integration based–protein function prediction approaches, (1) the kernel-based data fusion (KDF) approach (Lanckriet et al., 2004) and (2) the locally constrained diffusion kernel (LCDK) approach (Tsuda and Noble, 2004), and two baseline approaches, (3) the majority voting (MV) approach (Schwikowski et al., 2000) and (4) the iterative majority voting (IMV) approach (Vazquez et al., 2003). The function-wise prediction performance measured by average precision and average F1 score in standard five-fold cross validation is reported in Figure 3.
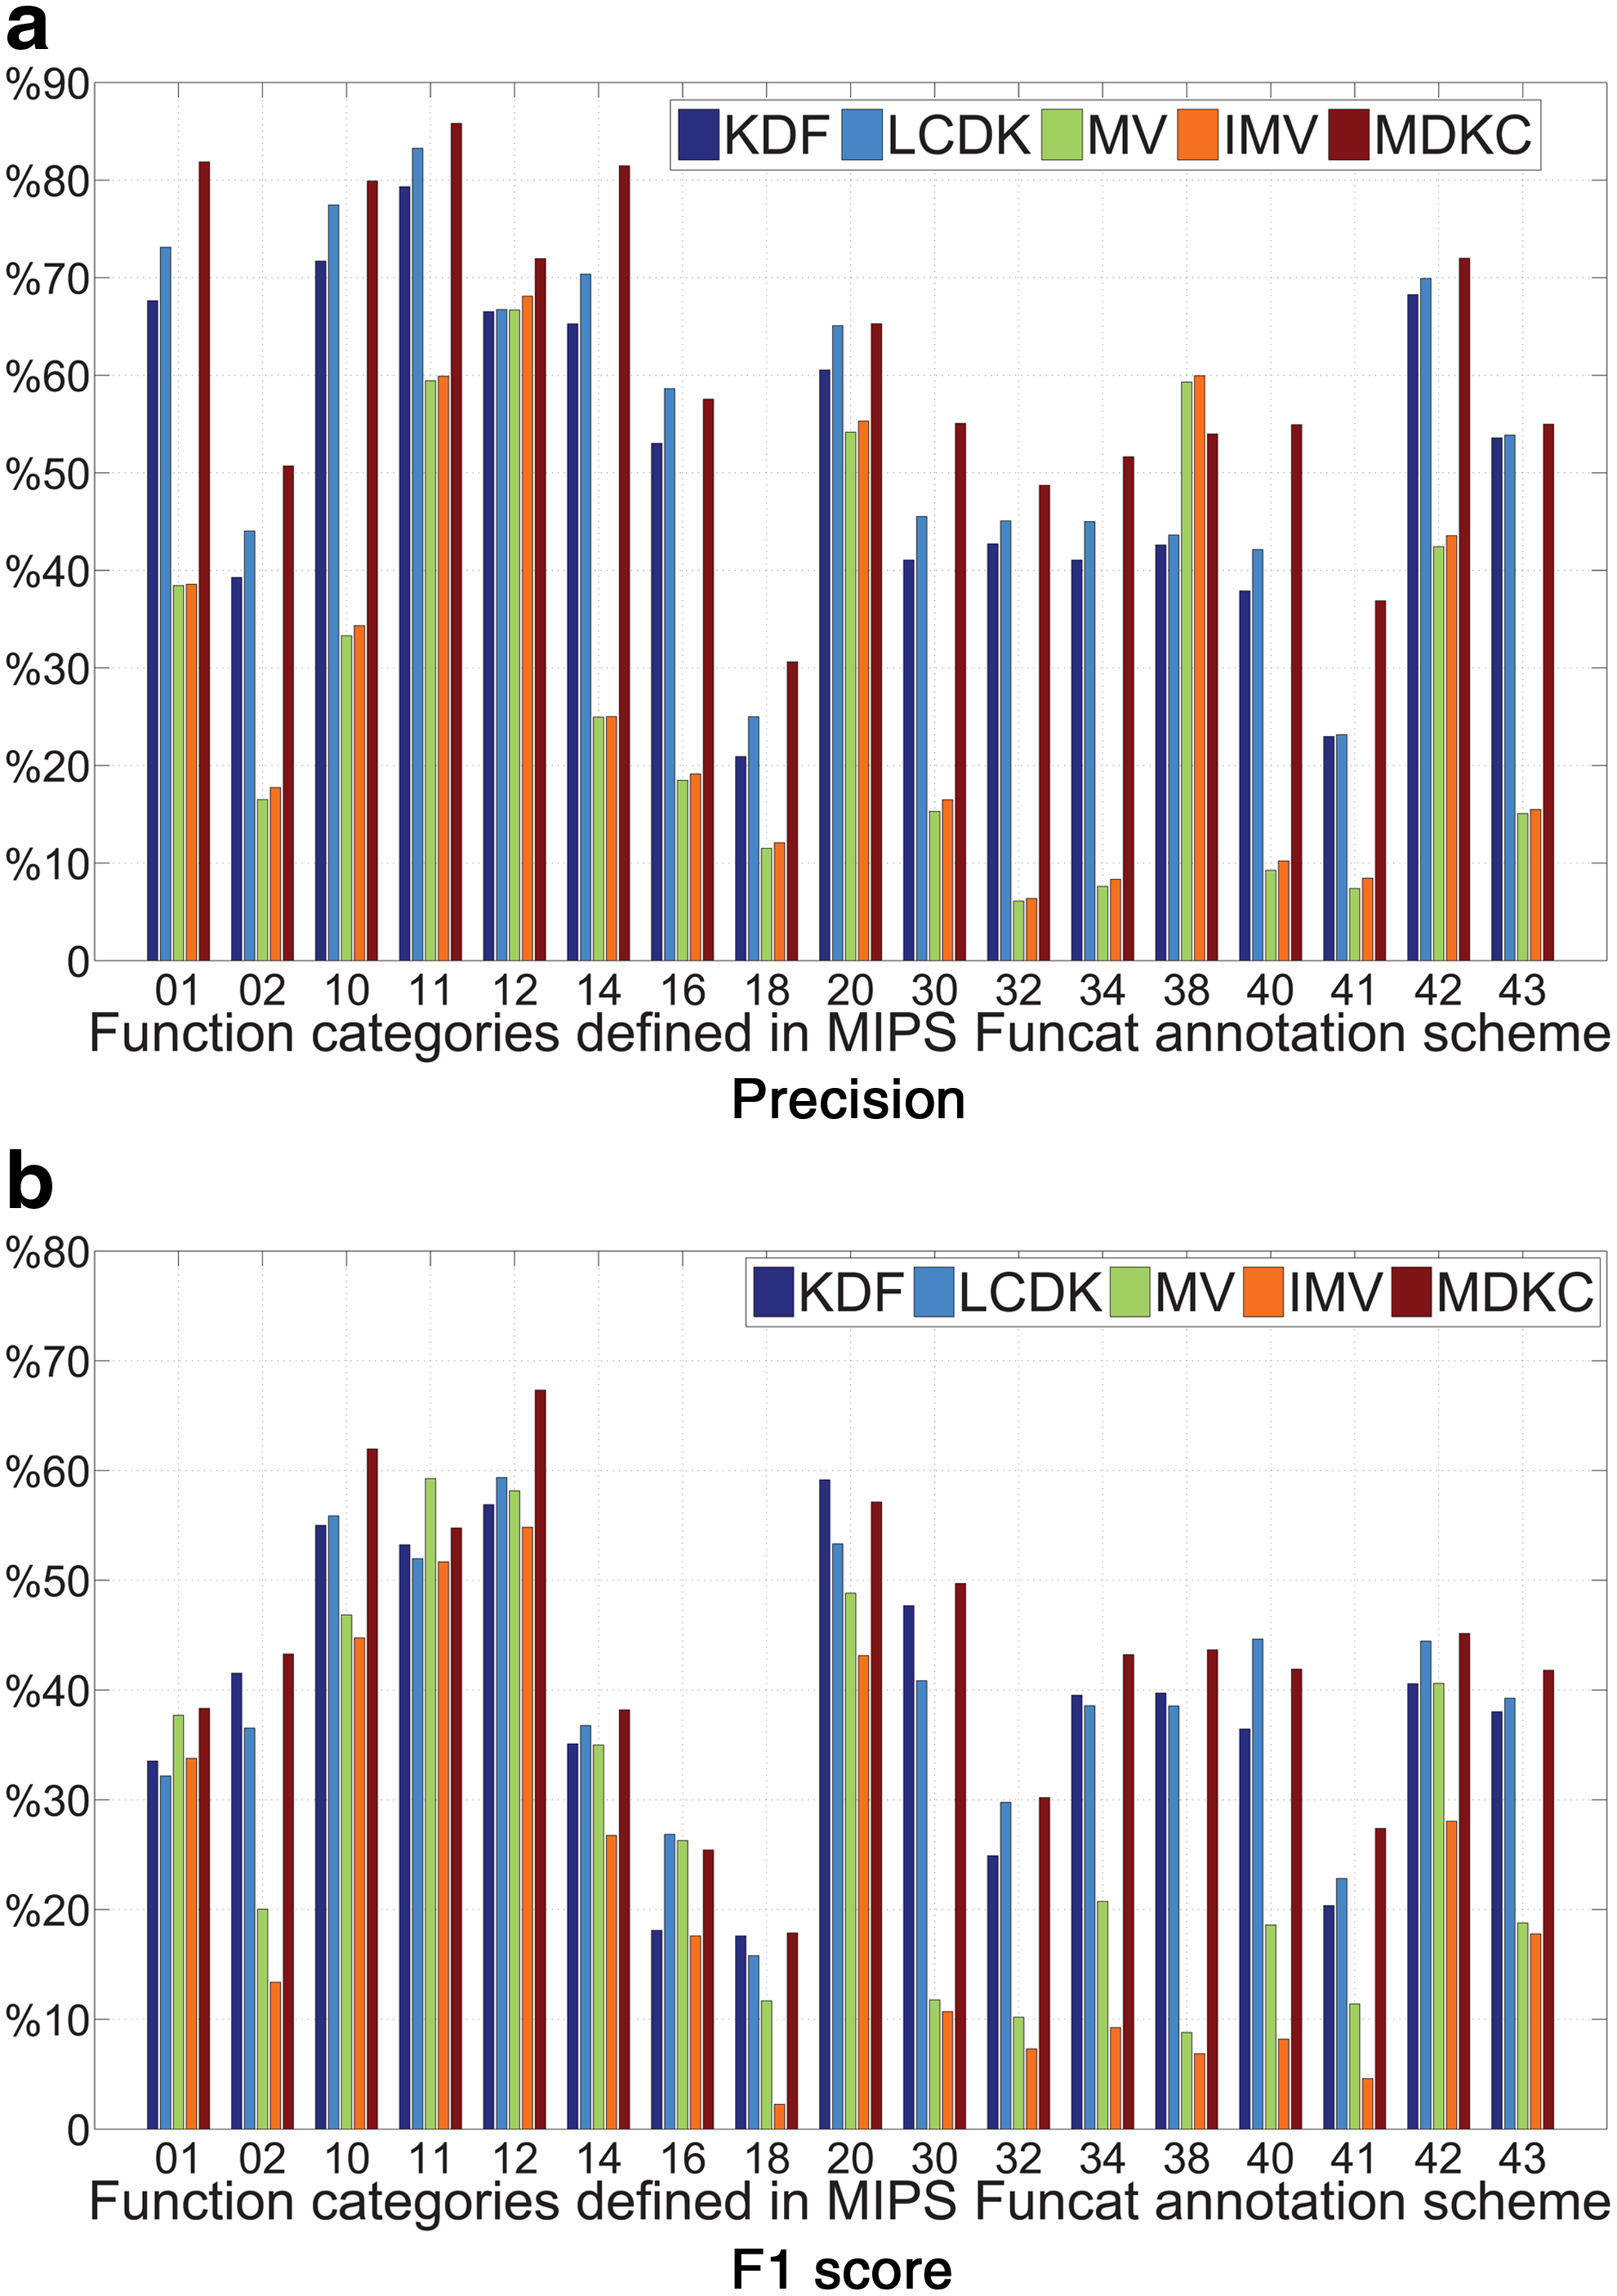
Performance of five-fold cross validation for the 17 main functional categories in FunCat annotation scheme (version 2.1) by KDF, LCDK, MV, GMV, and the proposed MDKC approach.
From the results in Figure 3a and Figure 3b, we can see that the proposed MDKC approach is consistently better than other compared approaches, sometimes very significantly, which again demonstrates the superiority of our approach.
A more careful examination on the results in Figure 3 shows that, although our approach outperforms the compared approaches in most functional categories, but not always, for example, the average precision for the function “Transposable Elements, Viral and Plasmid Proteins” (ID: 38). By scrutinizing the function category correlations, defined in Equation (2) and illustrated in the right panel of Figure 1, we can see the average correlation of the function “Transposable Elements, Viral and Plasmid Proteins” with other functional categories is among the lowest. As a result, the presence/absence of this function category can not benefit from other functional categories, because it only has weak correlations with them. In contrast, prediction for the function categories with high correlations to others generally can benefit from our approach. This observation firmly testifies the importance of function category correlations in predicting protein function.
5. Conclusions
In this article, we presented a novel Maximization of Data-Knowledge Consistency (MDKC) approach to predict protein function, which attempts to make use of function category correlations to improve the predictive accuracy. Different from traditional approaches in predicting protein function, which routinely use protein annotations as labels assigned to data points, we employed annotation knowledge in a completely different way to measure pairwise protein similarities. By maximizing consistency between the knowledge similarity computed from annotations and the data similarity computed from biological experimental data, optimal function assignments to unannotated proteins are obtained. Most importantly, function category correlations are incorporated in a natural way through the knowledge similarity. Using kernel mechanism, we further extend our approach to better fit more specific data for improved prediction performance. Comprehensive empirical evaluations have been conducted on S. cerevisiae genome using PPI network data, protein sequence data, and an integration of both of them respectively, promising results in the experiments justified our analysis and validated the performance of our methods.
Footnotes
Acknowledgments
This work was partially supported by NSF-IIS 1117965, NSF-IIS 1302675, NSF-IIS 1344152, NSF-DBI 1356628, and NSF-IIS 1423591.
Author Disclosure Statement
The authors declare that no competing financial interests exist.