
Abstract
Abstract
Studying epigenetic landscapes is important to understand the condition for gene regulation. Clustering is a useful approach to study epigenetic landscapes by grouping genes based on their epigenetic conditions. However, classical clustering approaches that often use a representative value of the signals in a fixed-sized window do not fully use the information written in the epigenetic landscapes. Clustering approaches to maximize the information of the epigenetic signals are necessary for better understanding gene regulatory environments. For effective clustering of multidimensional epigenetic signals, we developed a method called Dewer, which uses the entropy of stationary wavelet of epigenetic signals inside enriched regions for gene clustering. Interestingly, the gene expression levels were highly correlated with the entropy levels of epigenetic signals. Dewer separates genes better than a window-based approach in the assessment using gene expression and achieved a correlation coefficient above 0.9 without using any training procedure. Our results show that the changes of the epigenetic signals are useful to study gene regulation.
1. Introduction
T
To cluster epigenomic data more effectively using their statistical characteristics, we developed a new approach called Dewer. Dewer uses the measurement of entropy of epigenetic signals for clustering. Entropy is the expected value of the information contained in a random variable (Shannon, 1948). Entropy has been widely used in many areas, including information theory, signal processing, and biology (Yogesan et al., 1996; Swartz et al., 1999; Li et al., 2004; Shin et al., 2007; Daily et al., 2010; Menayo et al., 2014). Previously, entropy has been applied to genome-wide datasets to check tissue specificity and colocalization of signals (Sun et al., 2011; Won et al., 2013). A quantitative method named QDMR also used entropy to identify differentially methylated regions (DMRs) (Zhang et al., 2011). However, these studies were limited to studying variation across samples or tissues in a defined genomic position. Compared with the previous approaches, Dewer employed sophisticated ways of calculating the entropies in both original and wavelet domain for better discriminative power in clustering genes. Using entropy as a metric, Dewer fully uses the information contained in the distribution of the multidimensional epigenetic data, rather than condensing the data to mere statistics as in traditional window-based approaches.
To apply entropy effectively, Dewer detects areas enriched for multiple histone marks. The stacked histone marks in a region forms a two-dimensional (2D) data. Exploiting 2D spaces is important to fully understand the spatial combinatorial histone modification patterns for gene regulation. Most of border detectors have been developed to use only a single mark (Zang et al., 2009; Rashid, et al., 2011; Song and Smith, 2011; Micsinai et al., 2012). To identify enriched regions from multiple histone modification marks, Dewer upgraded SeqW (Nguyen et al., 2014b), a method developed by our group for better border detection. Entropy is then applied to the identified enriched regions. In this article, we show that both entropy and border detection contribute to the Dewer's discriminative power for gene clustering.
We found that the clusters identified by Dewer have a superior discriminative power over a window-based approach when we compared the gene expression levels among the clusters. Interestingly, gene expressions levels were highly correlated with the entropy levels, suggestive of the importance of the shape of epigenetic signals in studying gene regulation.
2. Methods
To calculate the entropy from multiple histone modification signals, Dewer uses two-directional information retrieved from epigenomic data such as entropy and stationary wavelet (SW) entropy in the detected areas enriched inside histone modification signals.
2.1. Data preprocessing
For clustering analysis, we used activating marks at around transcription start sites (TSSs) H3K4me1, H3K4me2, H3K4me3, H3K9ac, H3K18ac, H3K27ac, and H4K91ac from human fetal lung fibroblasts (IMR90) (Bernstein et al., 2010). Tags were normalized using reads per kilo base per million (RPKM) for 10 bp bins.
We also used histone marks enriched in active gene body: H3K36me3 in murine adipocytes (3T3L1) (Mikkelsen et al., 2010) and H3K36me3, H3K79me1, and H3K79me2 in IMR90 (Bernstein et al., 2010).
2.2. Identifying segments
We further upgraded SeqW (Nguyen et al., 2014b), our previous border detector, to detect borders of multiple histone modification signals. To reduce computational cost, Haar wavelet moving (HWM) (Nguyen et al., 2014a) borrowed from SeqW is still used in Dewer to detect domains, which represent larger regions with epigenetic signals. Inside each domain, instead of detecting border directly in SeqW, Dewer estimates border indirectly by obtaining many segments by assessing signal enrichment against input. Neighboring segments are combined to form enriched regions. A domain usually has a number of enriched regions. Histone modification signals can be written as
where f (t) is a function to normalize tag counts at a genomic position t of a histone modification mark m. Compared with SeqW, we used M(m), which shows relative enrichments across m histone modification marks. With this new representation in Equation 1, Dewer can detect borders from multiple marks.
Assuming a mixture of Gaussians (MoG) for a nucleosome marked by histone modification signals as in (Nguyen et al., 2010, 2014a,b), we obtain
where μi, and σi are the center and the standard deviation of a peak of a nucleosome, respectively. To estimate the borders of MoG signals, Dewer uses the zero-crossing lines across the multiwavelet scale. A zero-crossing is a point where the sign of a function changes. A zero-crossing line is obtained by connecting the zero-crossing points obtained over the wavelet scale s (Nguyen et al., 2014a).
Wavelet transform converts signals to the WD using a convolution operator.
where s denotes the scale, u is the genome position in WD, and
As described more in detail in (Nguyen et al., 2014a), we obtain
The inverse fast Fourier transform of Equation 4 becomes
where
To detect the borders of a peak, we use the second derivative wavelet (n = 2) (DOG2) instead of DOG3 in SeqW, where n = 1,2,3 correspond to each order of derivative.
The zero-crossing points are the parameters of the Gaussians when
Wf (u0, s, 2) = 0. Then we have
If s is small compared with σ
i
, Equation 7 becomes
In summary, u0 (s) in Equation 7 draws a line over the scale s. Equation 8 indicates that the zero-crossing line approximates to σ away from the center of a peak. Equations 7 and 8 were used to detect the border of the peaks. We regarded a segment as the region defined by the borders of an MoG. In the regions where nucleosomes are packed, histone modification signals can be represented with a number of segments. To remove falsely predicted segments, each segment is assessed using false discovery rates (FDRs) after considering enrichment against background (input).
2.3. FDR control
We used the mattes and the mafdr functions in Matlab R2012a to calculate the statistical significance of the signals in a segment against background (input) after dividing a segment into three subsegments. p-Values were calculated by applying t-test (Huber et al., 2002) on these subsegments. FDRs were obtained from these p-values (Storey, 2002). Segments with an FDR greater than 0.01 were removed. After this step, adjacent segments were combined to form an enriched region.
2.4. Gene clustering using entropy and SW entropy
Dewer used Shannon's entropy (Shannon, 1948) for gene clustering. Shannon's entropy has been widely used in signal processing to measure the expected value of the information contents contained in a signal. Entropy H(x) for a given signal x can be estimated by
where P represents the histogram of the normalized intensity of histone modification signals inside the detected enriched regions around TSS (1–5 Kbps, 5 Kbps is default value).
Stationary wavelet transform (SWT) (Mallat, 2009) is a time–frequency analysis that has been widely used in image processing applications such as de-noising (Wang et al., 2003), enhancement (Demirel and Anbarjafari, 2011), segmentation (Deng et al., 2014), and image retrieval (Agarwal et al., 2013). Especially, we used the extracted information from decomposed scales of SWT. SWT (Fig. 1) with two levels has eight scales: LL1, LH1, HL1, HH1, LL2, LH2, HL2, and HH2. The SW entropy is obtained from these eight scales. The SW entropy levels are used as the input of clustering. Decomposition part of SWT can be formatted as follows:
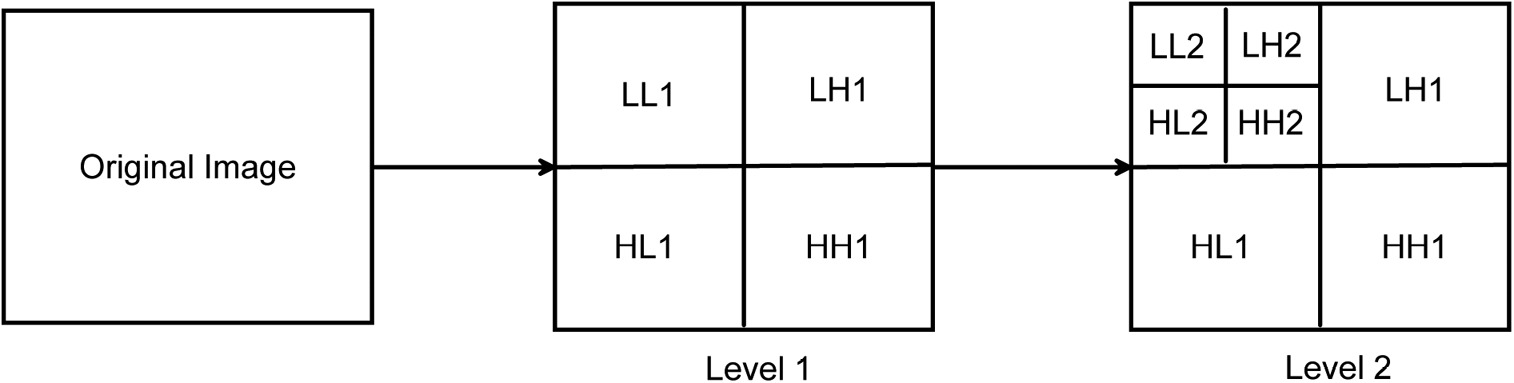
Stationary wavelet transform with two levels. LL1, LH1, HL1, HH1, LL2, LH2, HL2, and HH2 are the eight scales. L means low frequency. H means high frequency. LH1 means low frequency in horizontal and high frequency in vertical at level 1.
where Ll is low pass filter at level l, Hl is high pass filter at level l, LL0 is original image, and ↑ 2 is the up-sampling operation by 2.
Dewer used agglomerative cluster algorithm (Szekely and Rizzo, 2005), a hierarchical clustering approach where each object starts from its own cluster, and pairs of clusters are merged as one move up the hierarchy.
3. Result
3.1. Dewer overview
Dewer clusters genes based on the entropy features inside enriched regions. Figure 2a shows the five domains identified using seven types of histone modification marks (H3K4me1, H3K4me2, H3K4me3, H3K9ac, H3K18ac, H3K27ac, and H4K91ac) in IMR90. A domain contains a number of enriched regions. The derivative wavelet method detects the border of the segments after modeling a segment. p-Values and FDRs were calculated to measure the enrichment of epigenetic signals against control input. We applied an FDR cutoff of 0.01 (Fig. 2b). The neighboring segments were combined to form a final enriched region. Figure 2c shows two enriched regions around the promoter regions of Ccnl2 and Mrlp20. Entropies were calculated in these regions around the TSS. Also, SW entropies were estimated inside eight scales. A hierarchical clustering method is applied to the obtained entropies as the input features.
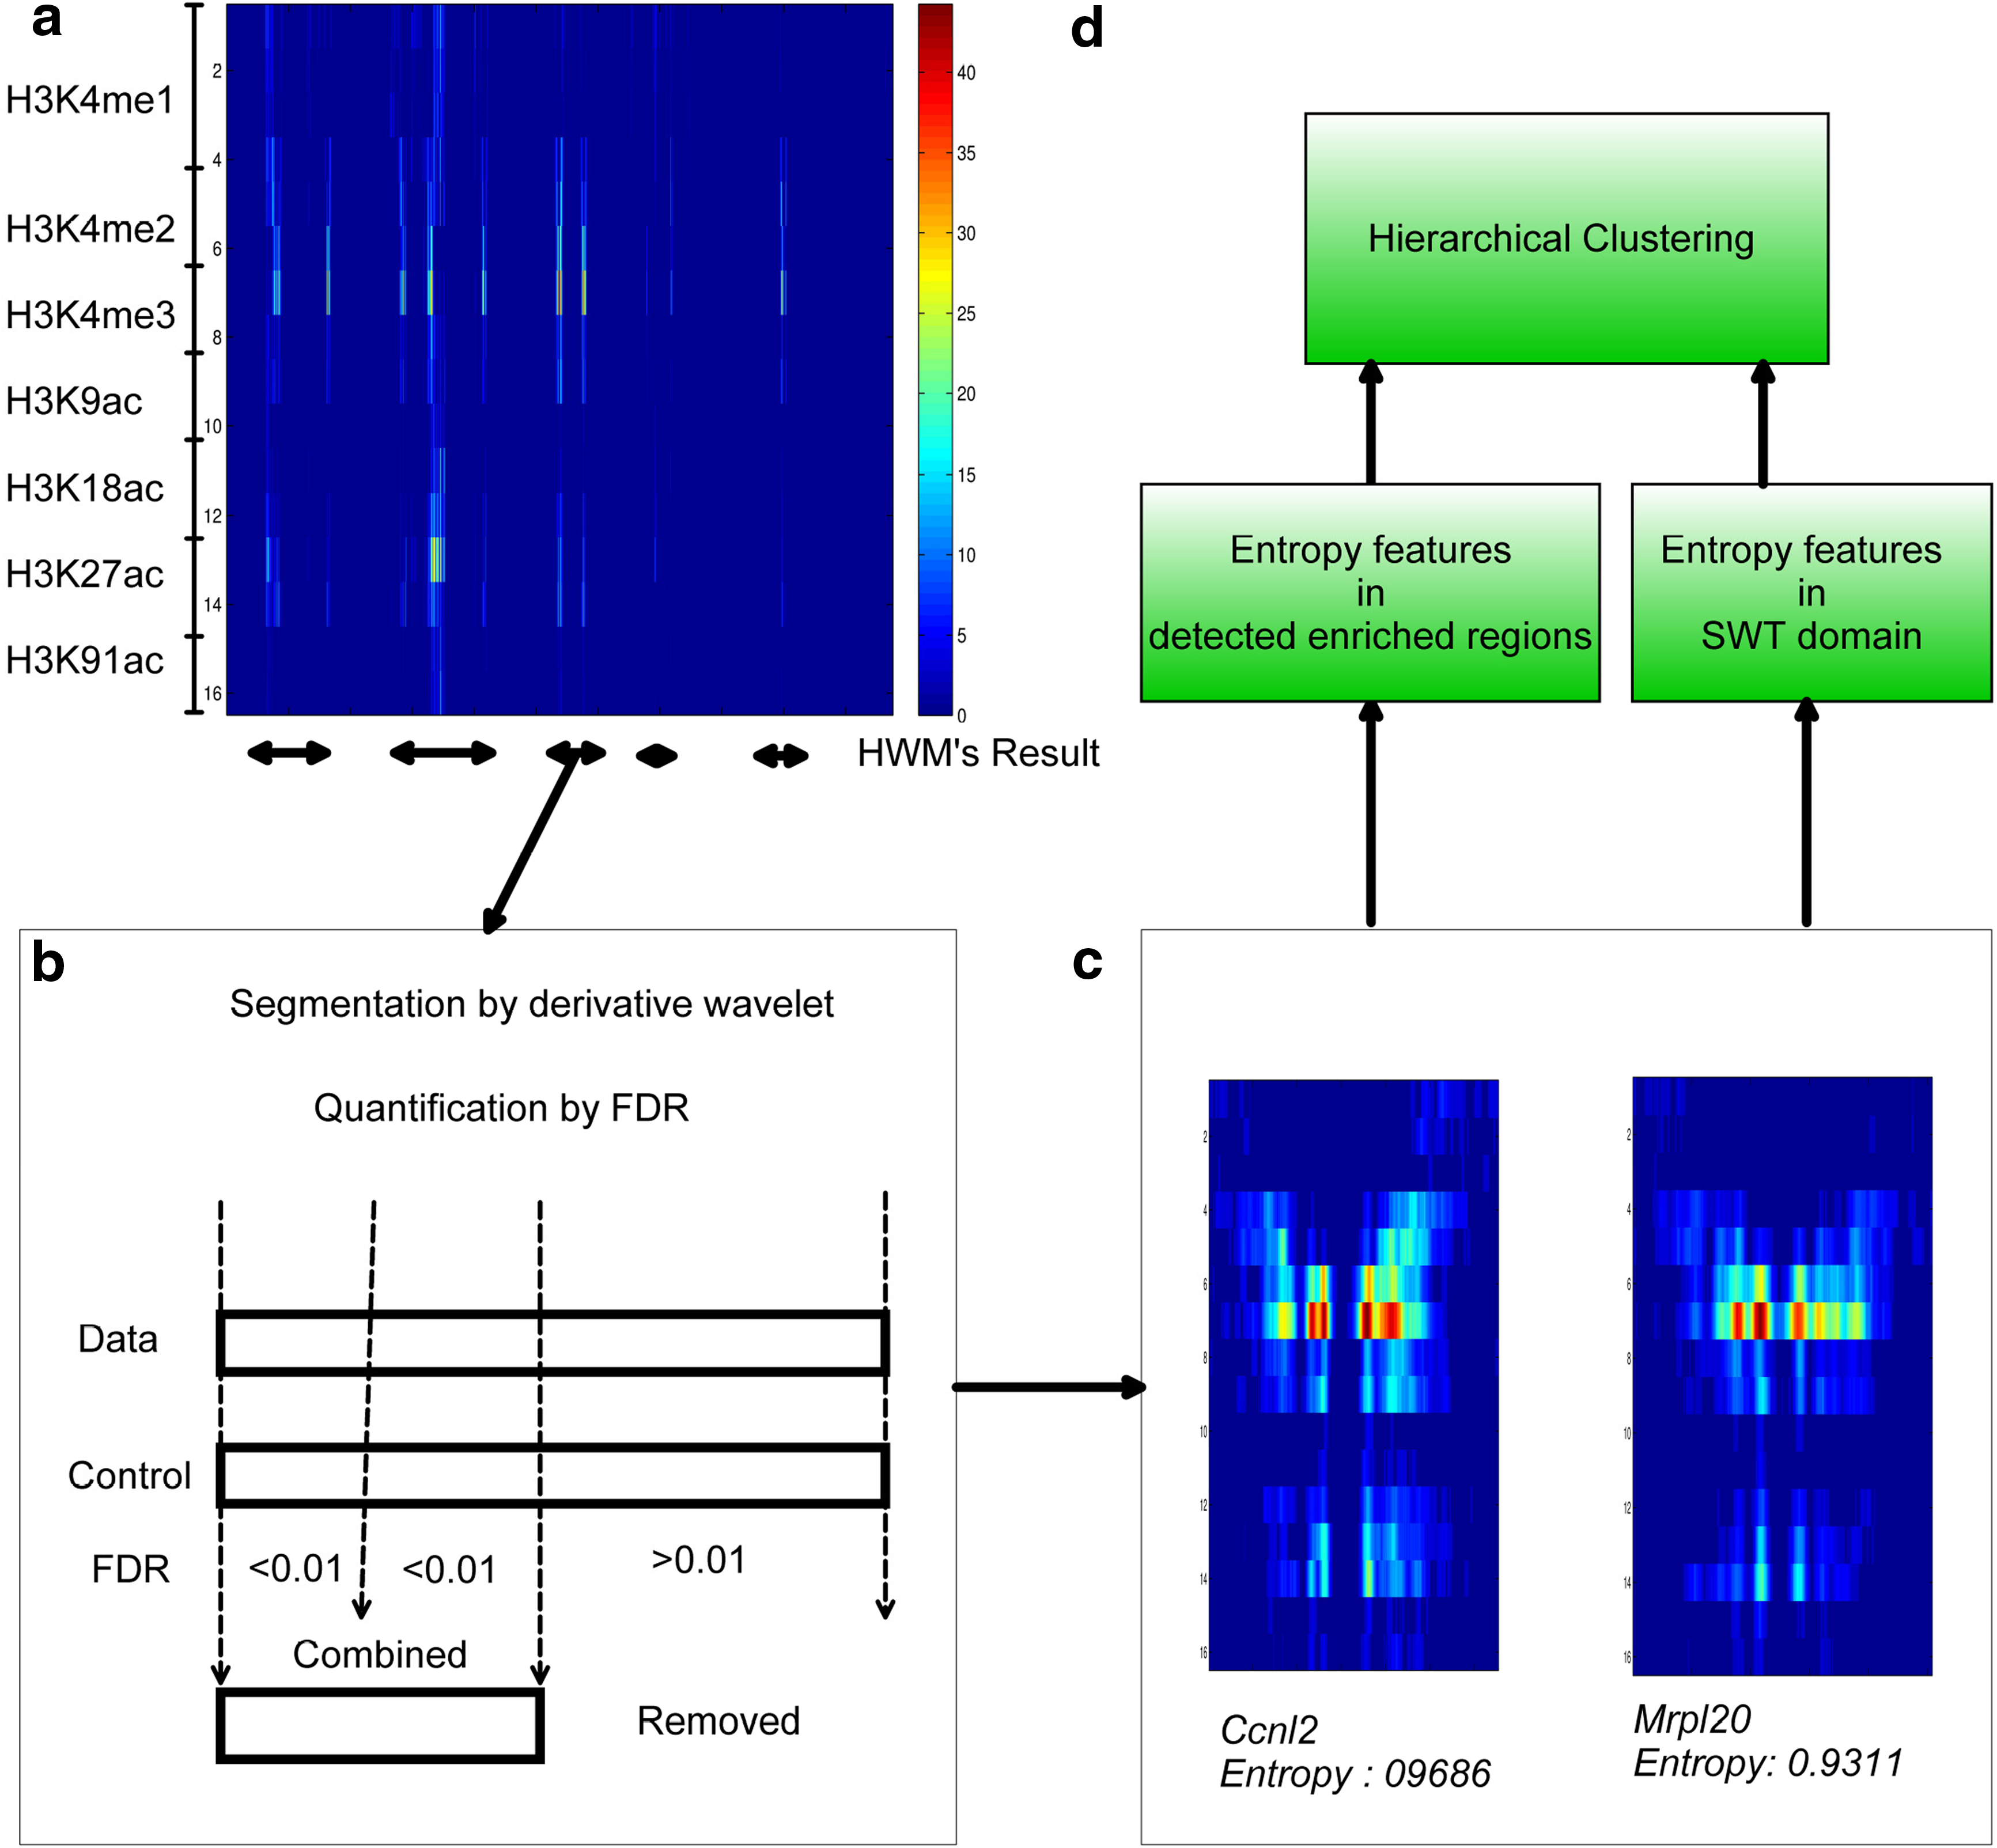
The Dewer procedure.
3.2. Assessing the performance of enriched region detection
Detecting enriched region is an important component as estimating entropy in Dewer. In this section, we evaluate the performance of enriched region detection.
To evaluate the performance of enriched region detection, we compared Dewer with previous broad region detectors, including SeqW (Nguyen et al., 2014b), Sicer (Zang et al., 2009), RSEG (Song and Smith, 2011), and QESEQ (Micsinai et al., 2012). We also included ChromHMM (Ernst et al., 2010) because it annotates the genome using multiple histone modification marks, even though it was not originally designed for enriched region detection. For this assessment, we used H3K36me3 in murine adipocytes (3T3L1) and evaluated using the annotated genes in GENCODE (Harrow et al., 2012). Only the bodies of the active genes whose gene expressions are higher than averaged value were used.
Figure 3 shows the true-positive rates against false-positive rates. For this test, only a single H3K36me3 (day −2) was used for QESEQ, Rseq, Sicer, and SeqW and four H3K36me3 were used for Dewer and ChromHMM (day −2, 0, 3, and 7). In our test, QESEQ performed better than Rseq and Sicer, in agreement with the previous observations in (Micsinai et al., 2012). QESEQ performed better than ChromHMM using four H3K36me3 marks. It is not surprising because ChromHMM is originally not designed to predict enriched regions.

Performance comparison for enriched region detection using 3T3L1 datasets. H3K36me3 data from 3T3L1 cells were used for each detector. For ChomHMM and Dewer, H3K36me3 in four time points during adipogenesis was used. Dewer outperformed other predictors in this test.
Dewer performed even better than SeqW, suggesting that Dewer uses multidimensional epigenetic signals effectively. ZINBA (Rashid et al., 2011) was not included in this comparison because of its exhaustive running time.
Additionally, we tested the performance using active marks for gene body (H3K36me3, H3K79me1, and H3K79me2) in IMR90 (Fig. 4). For this test, we compared Sicer, QESEQ, and SeqW as they performed better than other predictors in our previous test. A single mark (H3K36me3) was used for SeqW, Sicer, and QESEQ. Dewer used H3K36me3, H3K79me1, and H3K79me2. The test also confirmed that Dewer has a solid performance in detecting the regions enriched for epigenetic signals.

Assessing the performance of detecting enriched region using IMR90 datasets. SeqW performed Sicer and QESEQ when using H3K36me3. Dewer using H3K36me3, H3K79me1, and H3K79me2 performed best.
3.3. Gene clustering using Dewer
3.3.1. The clusters identified by Dewer well discriminate gene expression levels
We assessed the performance of gene clustering by comparing Dewer with a conventional window-based approach. Window sizes have been selected from 1 to 5 Kbps. With Dewer, window sizes help to narrow selected enriched regions. Using seven histone modification marks in IMR90, we performed clustering and generated 6–10 clusters. We used gene expression as a surrogate to check if the identified clusters separated gene groups effectively.
After performing clustering, we evaluated the expression levels of the genes for each cluster and measured if they are different from each other using the Student's t-test. For this test, we also investigated the effectiveness of the two algorithms that Dewer employed (detection of enriched regions and calculating entropy). Specifically, to assess the advantages of using enriched regions, we compared the performance of using entropy with/without enriched region detection. We also tested if entropy improves discriminative power in a given window. Figure 5 compares the averaged p-values of all clustering pairs in the tested clustering algorithms. For rigorous assessment, we investigated the averaged p-values while we increased the size of a window around TSSs and calculated the mean value and the entropy of the signals. Table 1 compares the performance of various wavelet filters, including Daubechies, Coiflets, Symlets, Discrete Meyer, Biorthogonal, and Reverse Biorthogonal (Mallat, 2009). Eight scales (LL1, HL1, LH1, HH1, LL2, HL2, LH2, and HH2) of SWT for each filter were tested. We found that HH2 of Sym10 performed best. Sym10 is a symmetric filter, suggesting that symmetry and high frequency of Sym10 may be suitable for capturing the characteristics of histone modification signal.

Comparison of the algorithms Dewer used for its clustering. We compared the algorithms of Dewer (entropy and enriched regions). We used entropy in a window and used the mean value in the enriched region. We also compared the performance using the classical mean value in a window for gene clustering.
In eight SWT scales, L means low frequency and H means high frequency; 1 and 2 are levels of SWT. Daubechies (db1–db10), Coiflets (coif1–coif5), Symlets (sym2–sym11), Discrete Meyer (dmey), Biorthogonal (bior1.1–bior2.8), and Reverse Biorthogonal (rbio1.1–rbio2.8) are the used wavelet filters. SWT, stationary wavelet transform.
The performances were improved in general as we increased the size of a window around the TSSs except for the case when we used the mean value of the enriched regions (Fig. 5). This may be caused by the high intensity of the signals in some local enriched regions. After 5 Kbps, all performances went down (not shown here). The comparison of using entropy and the mean value in a given window clearly demonstrated that entropy is a good measure for clustering against the window-based method. Calculating the mean value performed worst in our test. Dewer, which used both entropy and the enriched region, performed best in this assessment. This test emphasizes that both enriched region and entropy provide discriminative power for gene clustering.
3.3.2. Entropy levels correlate with gene expression levels
Next, we studied the association of gene expression with entropy in 16 clusters. We also tested the association of gene expression of the clusters obtained using the mean value in a window. The averaged gene expression levels for all the clusters were identified for each configuration: the average value of a window (Fig. 6), the entropy of a window (Fig. 7), and Dewer (the entropy in the enriched regions) (Fig. 8). All clusters were sorted based on their averaged feature values.
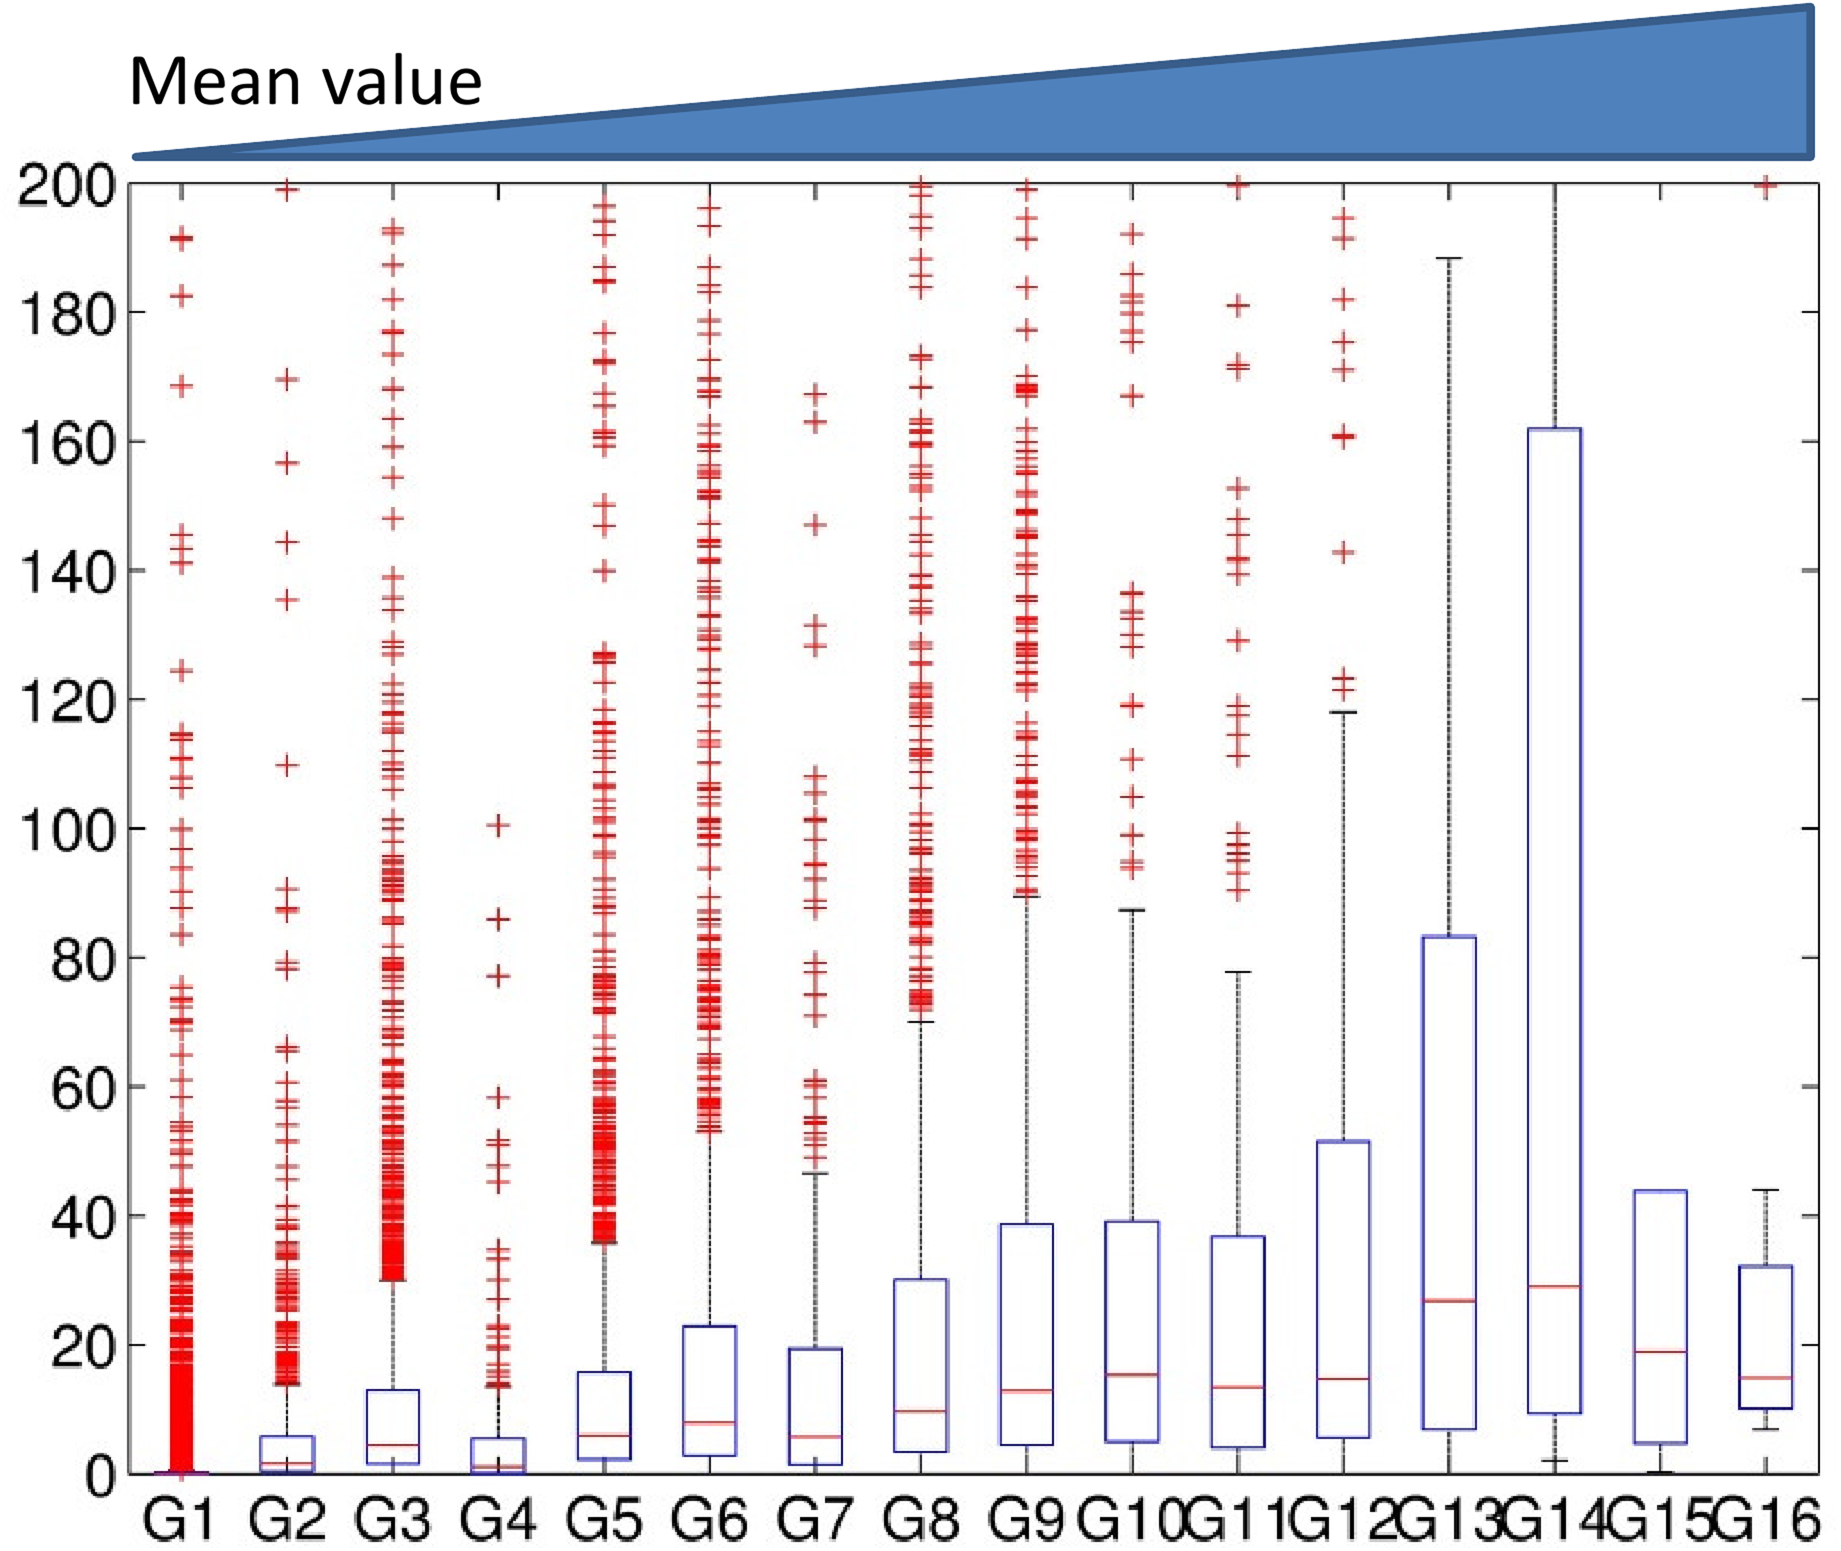
The association of gene expression levels with the mean levels when using window method. We generated 16 clusters using a window-based approach. Clusters were sorted based on their strength of the features. The expression levels for each cluster were investigated.
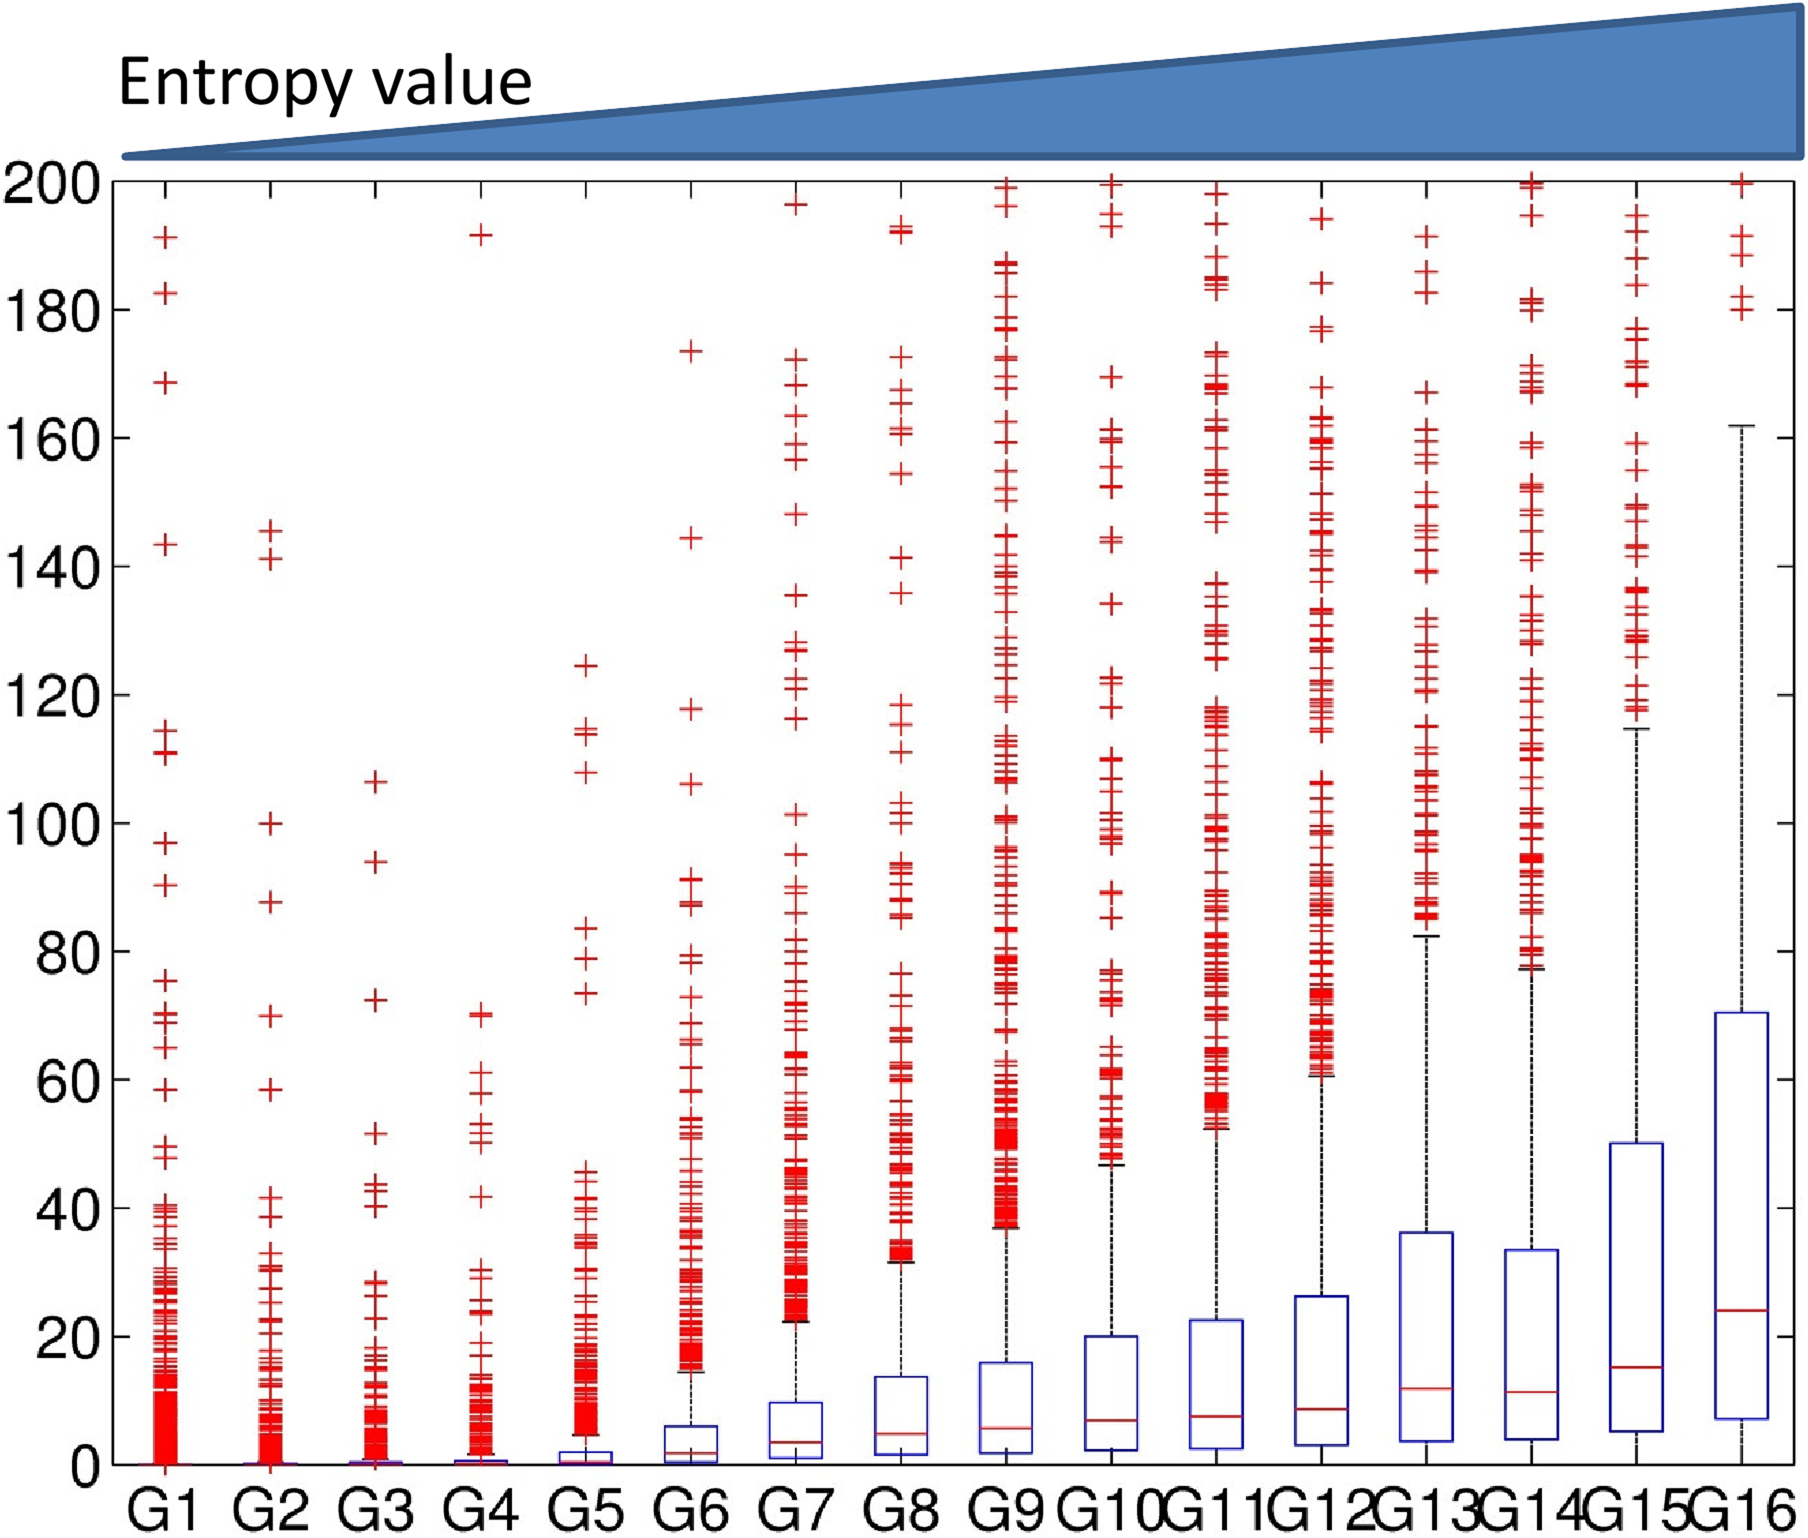
The association of gene expression levels with the entropy levels when using window method. We generated 16 clusters using a window-based approach. Clusters were sorted based on their strength of the features. The expression levels for each cluster were investigated.
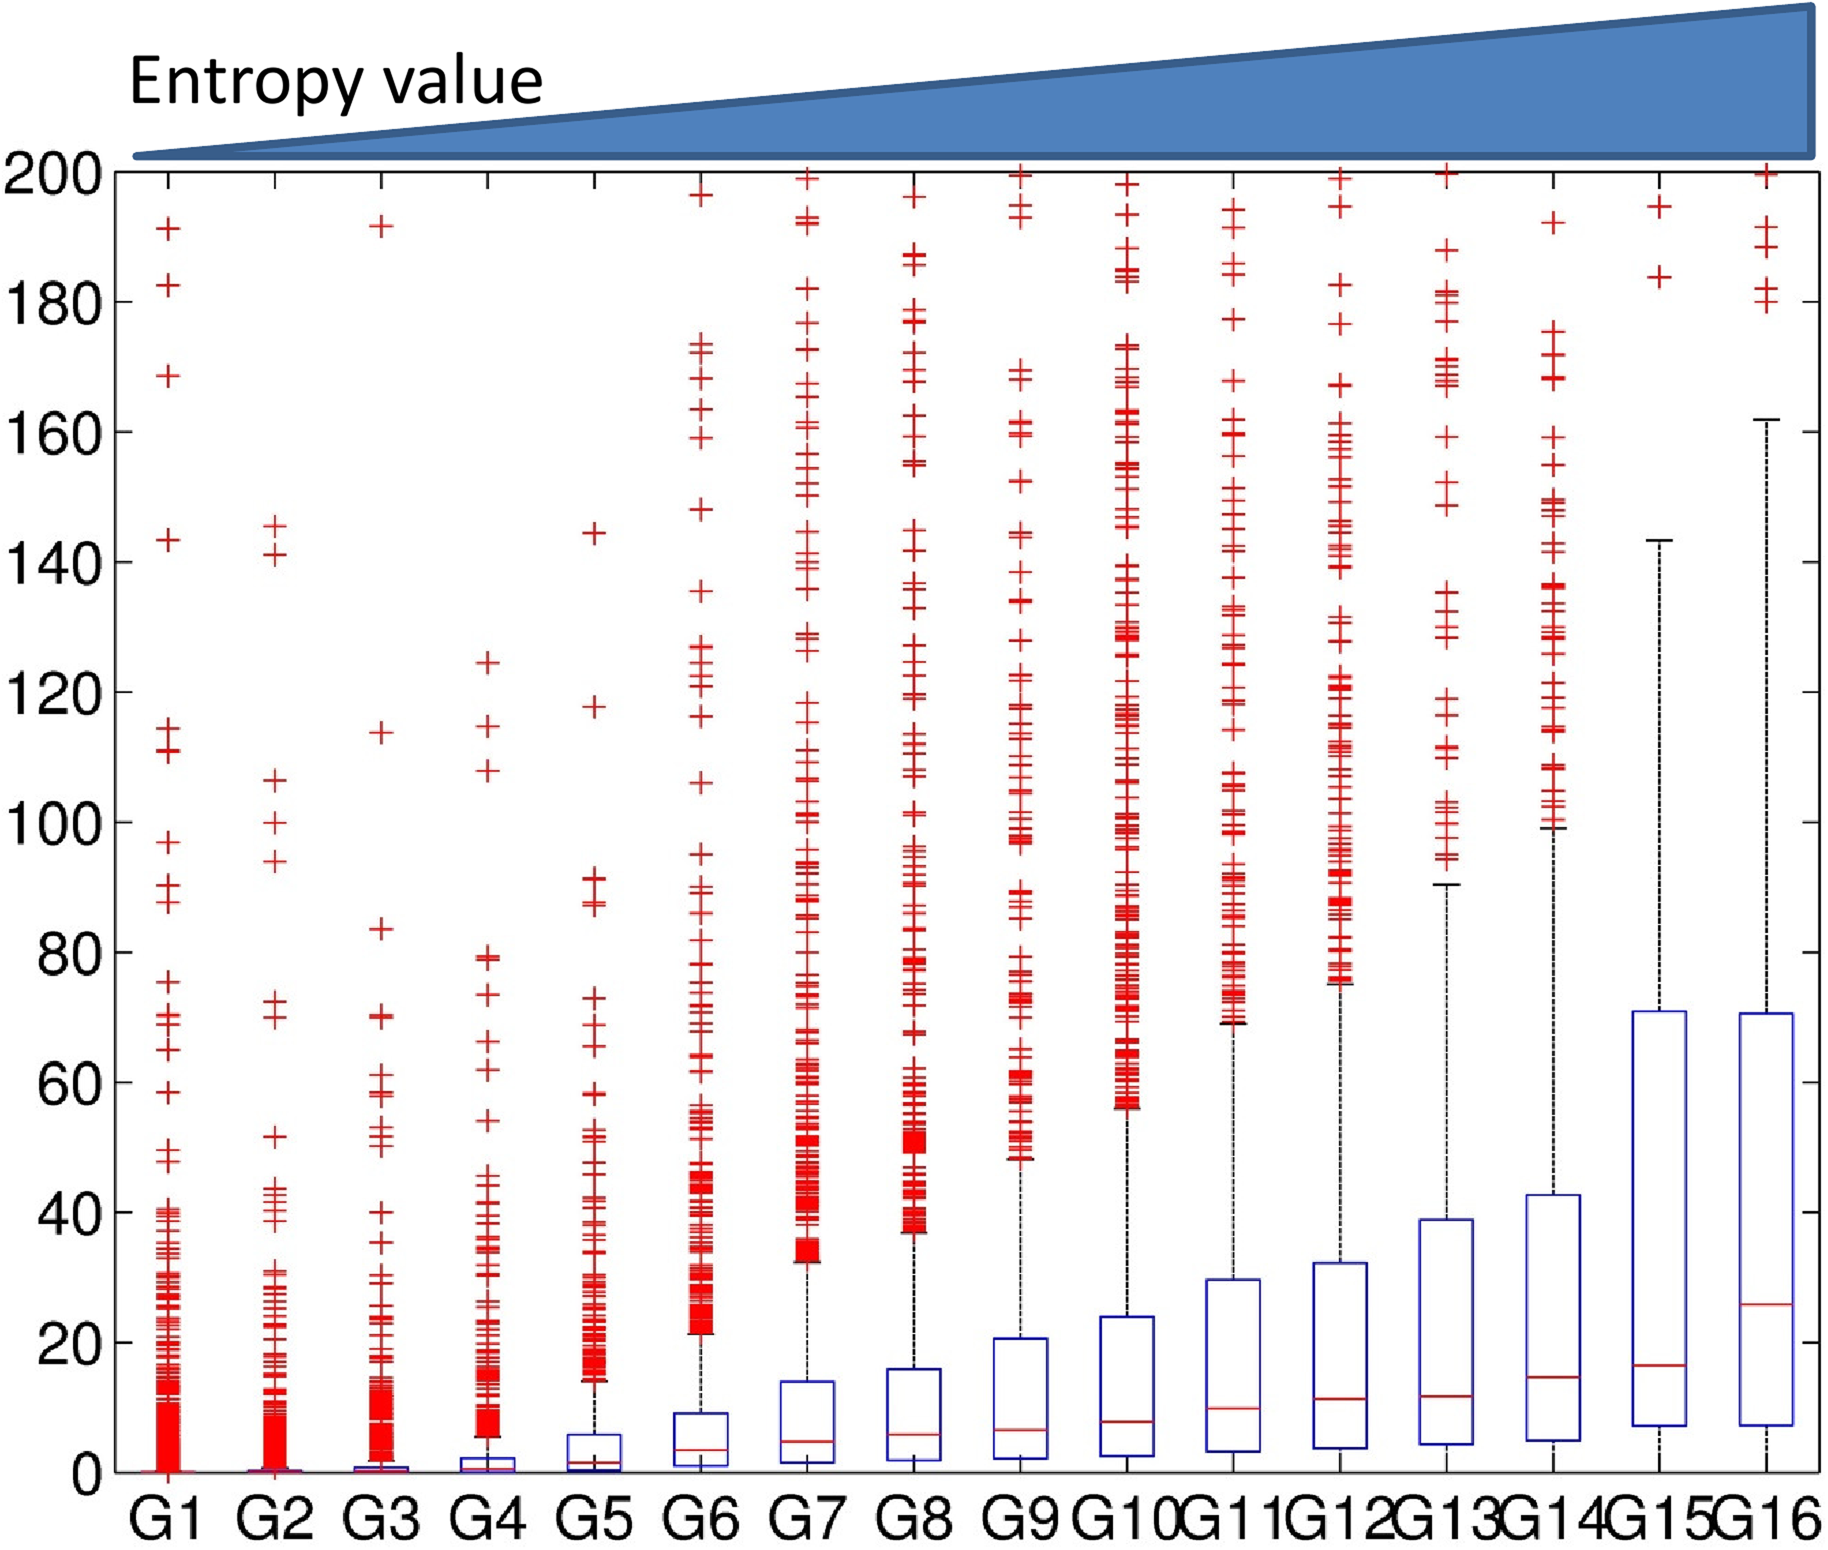
The association of gene expression levels with the entropy levels when using Dewer method. We generated 16 clusters using Dewer. Clusters were sorted based on their strength of the features. The expression levels for each cluster were investigated.
We observed gradual increase of gene expression levels in association with the entropy levels (Figs. 7 and 8). In Figure 6, the expression level of G14 was higher than that of G15 and G16 in the window-based approach despite its lower mean value level. When we used entropy in a window (Fig. 7), we observed a better correlation than using the averaged values. Dewer showed the best correlation in our test (Fig. 8), and suggested that both entropy and enriched region detection are useful in clustering.
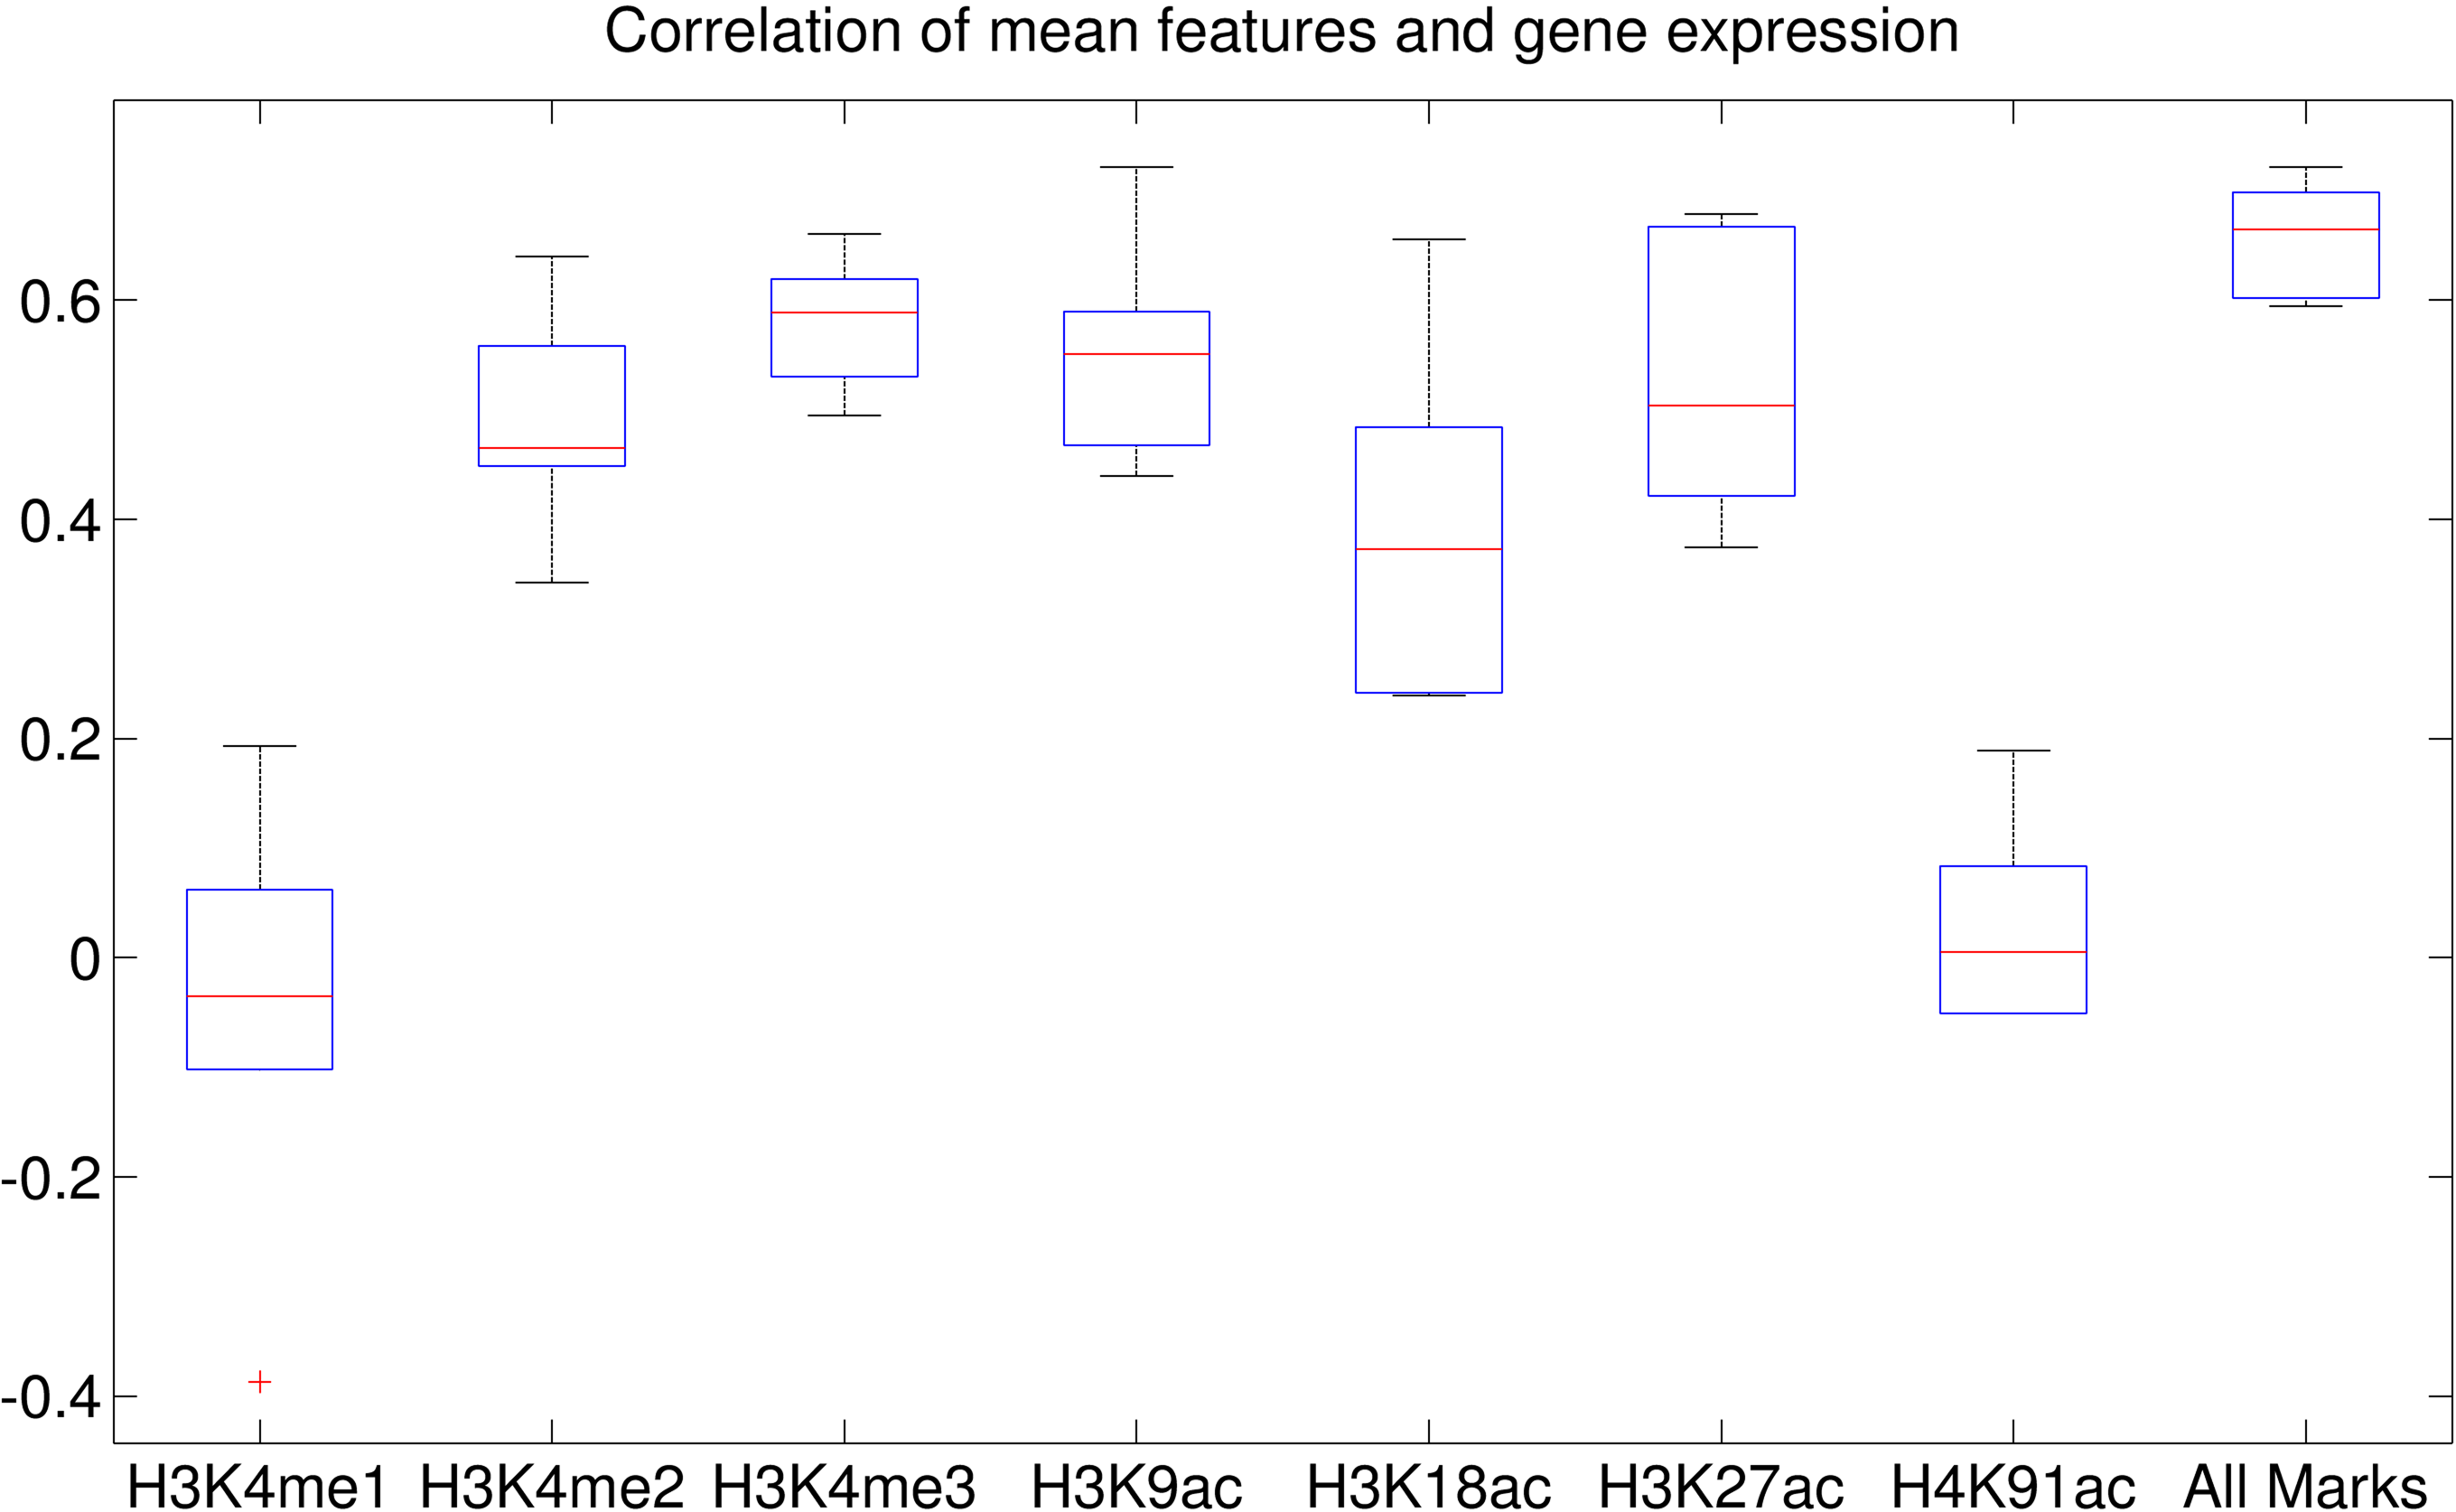
We observed similar phenomena when using 32 clusters. We investigated the correlation coefficient (CC) of the clusters when we used the epigenetic data 1–5 Kbps around TSSs (Figs. 9 and 10). The CC between expression levels and the entropy levels reached 0.9 when using Dewer (Fig. 10). We further analyzed the contributions of each histone modification mark for gene expression (Fig. 9). When mean values were used, the contributions of H3K4me1 and H4K91ac for gene expression prediction were very weak (Figs. 11 and 12). This is mainly because of the low intensity of the signals. When all marks were combined, the window-based method resulted in a correlation of approximately 0.6. The same comparison using the entropy levels resulted in much stronger correlation in general even when using H3K4me1 only. Even though entropies of H3K4me2 and H3K4me3 were the highest, their associations with gene expression were relatively low, especially for H3K4me3. This may be because H3K4me3 is also enriched for transcriptionally paused genes (Guenther et al., 2007). We observed that the correlation was the highest when using H3K27ac, consistent with previous studies (Karlic et al., 2010). H3K9ac and H3K18ac also had high correlation though the signal of H3K18ac was very weak (Figs. 11 and 12). Using all marks giving the highest CC may suggest that Dewer makes use of multiple marks effectively by employing entropy.
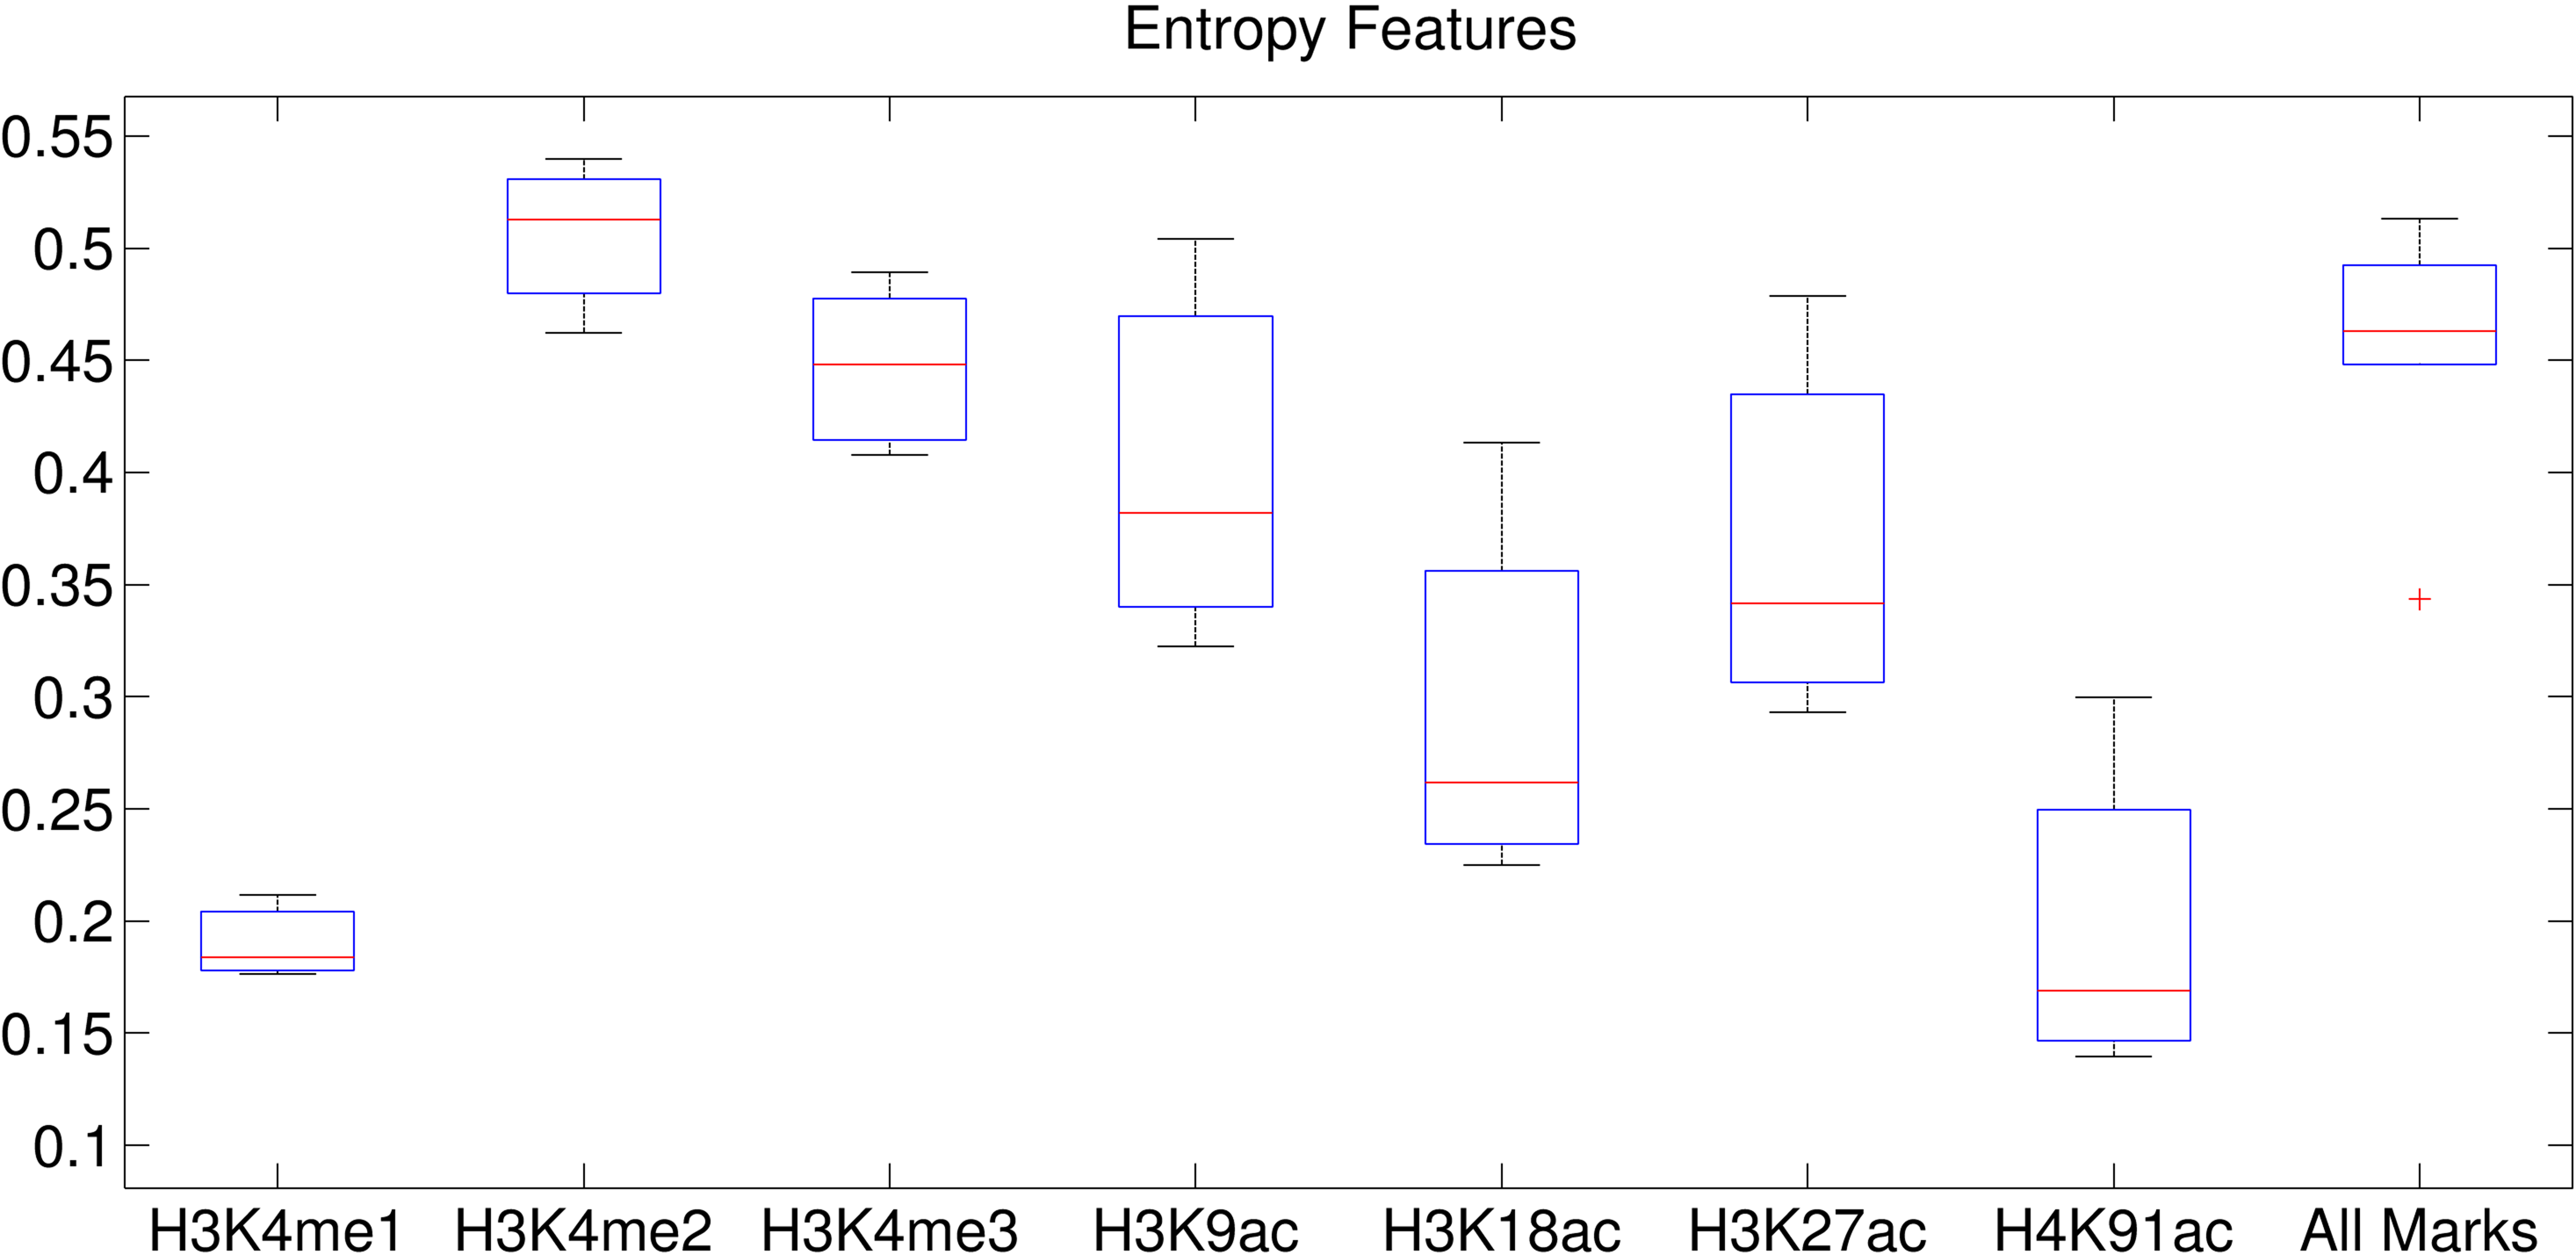
The entropy value of each histone modification mark using Dewer.
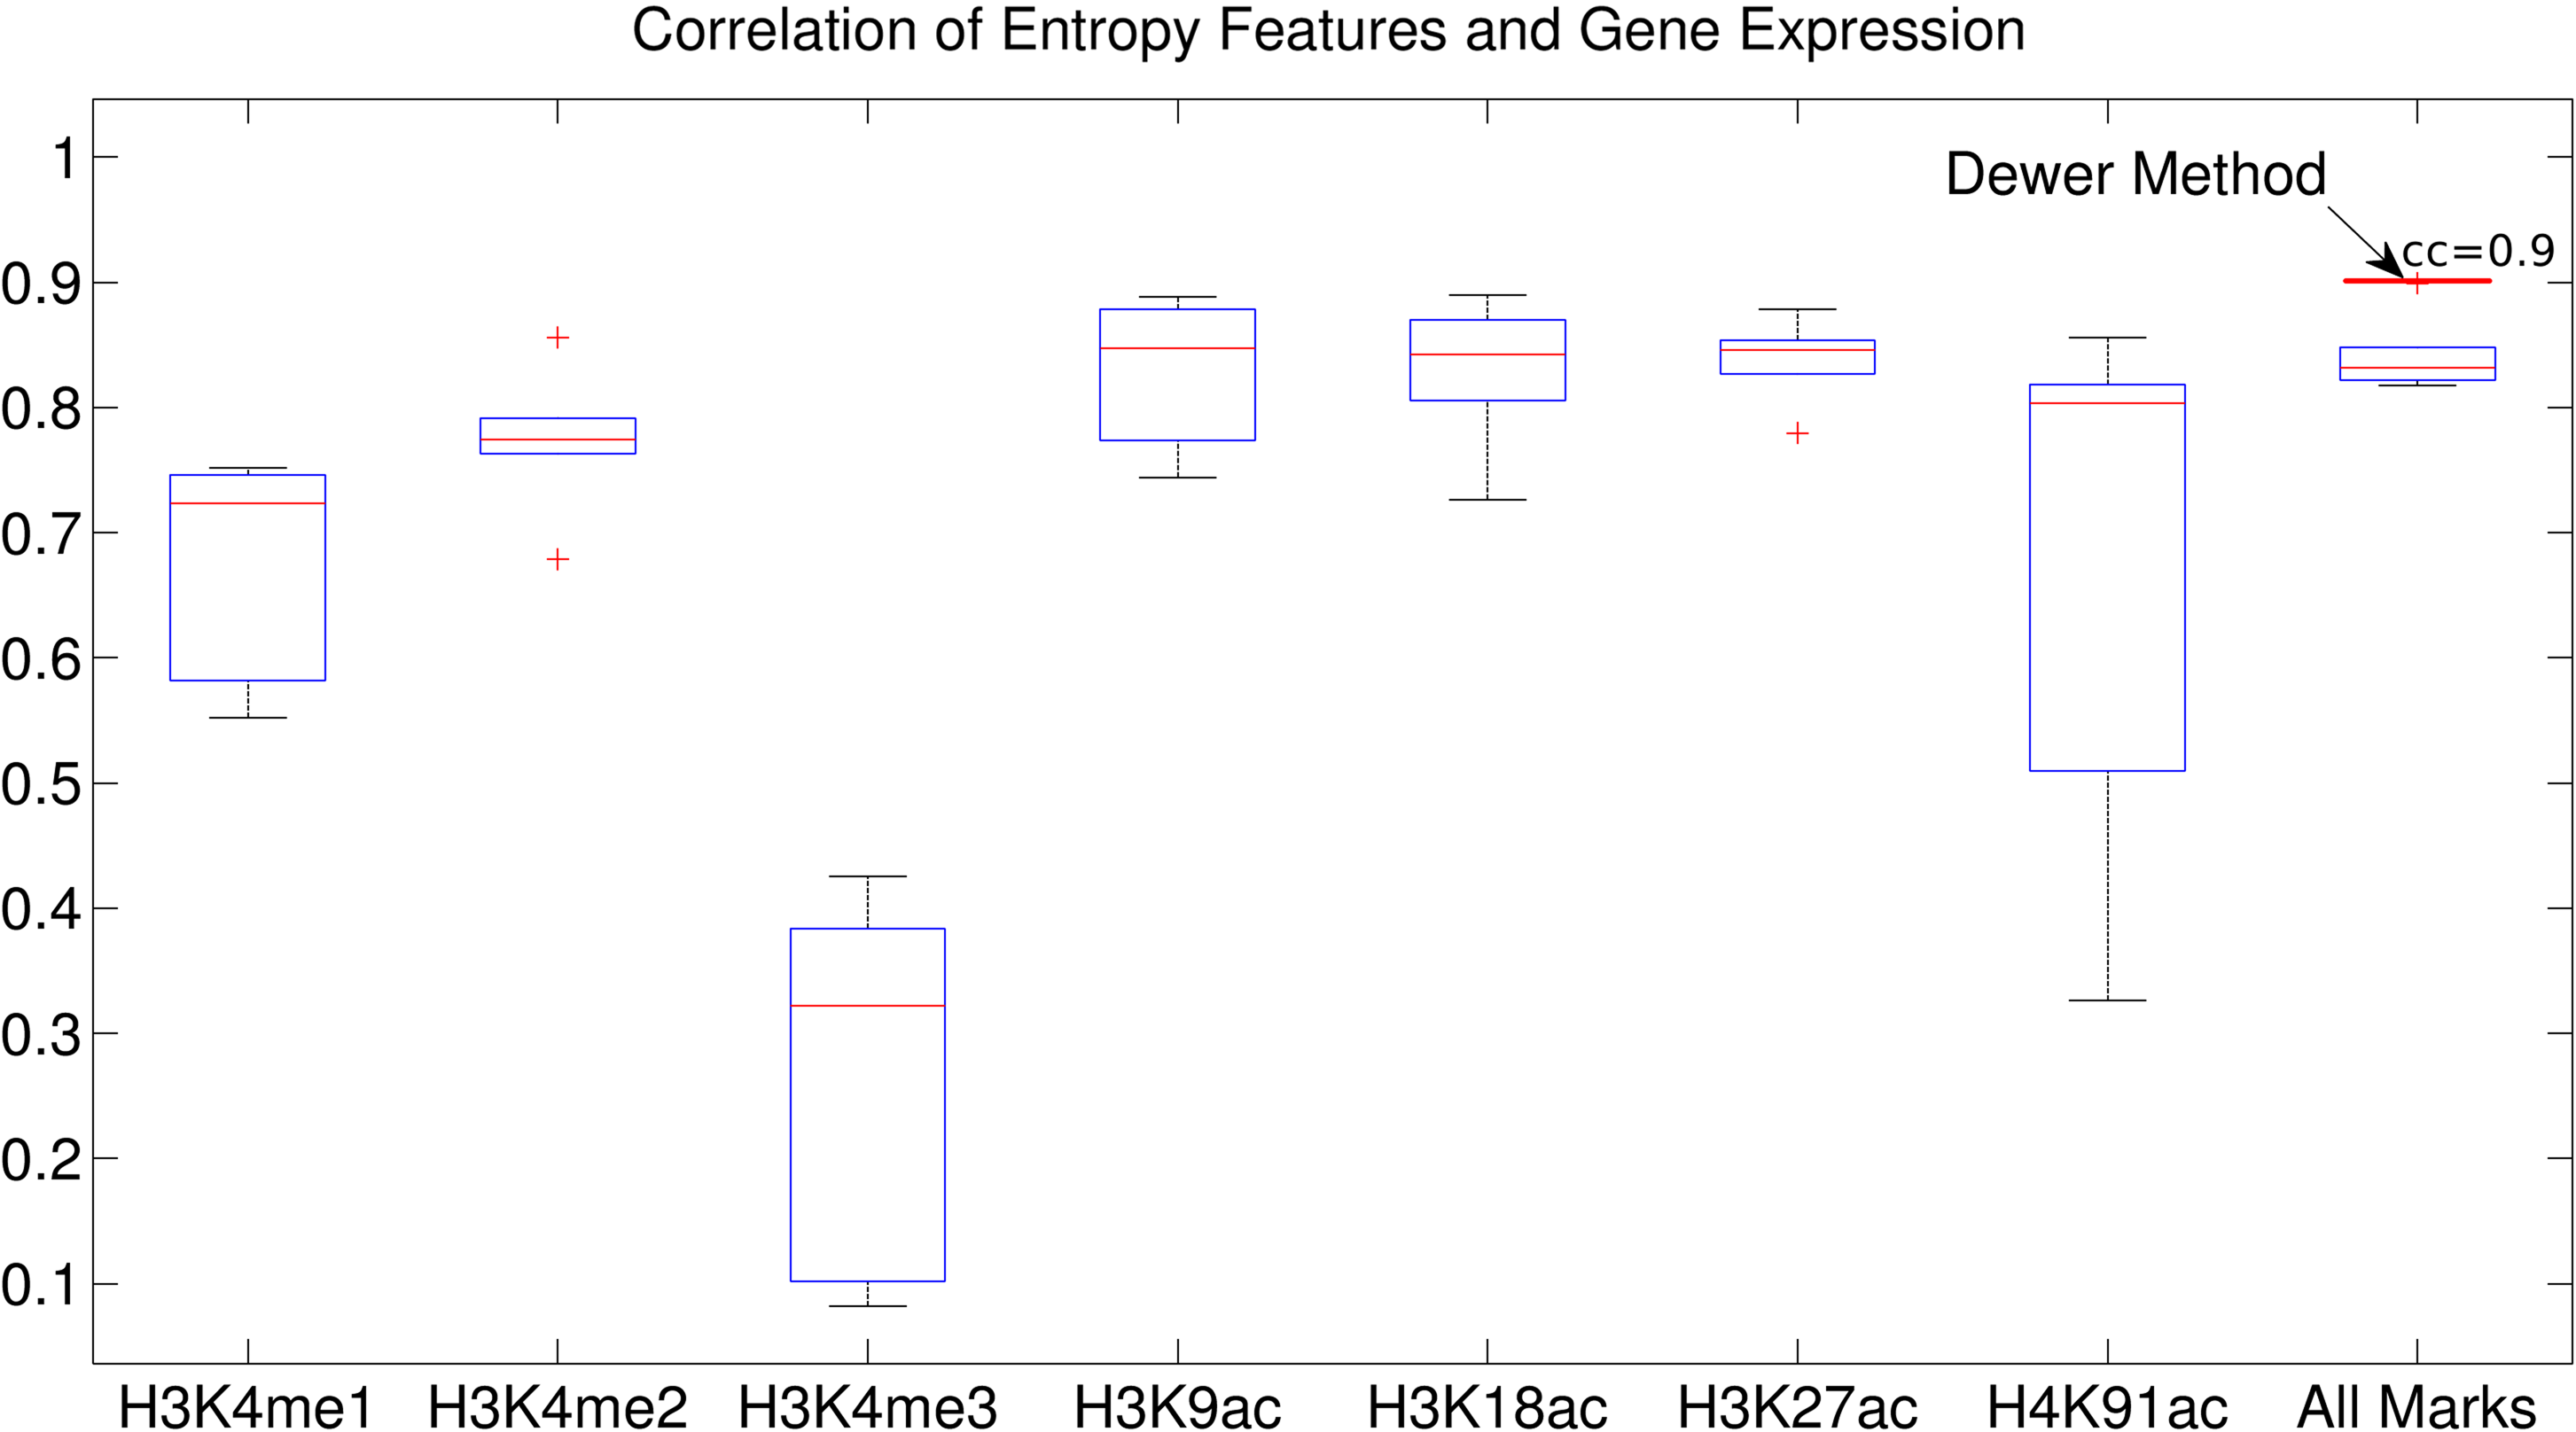
The entropy value and its association for each histone modification mark. Correlation coefficients (CCs) between expression levels and the entropy levels for the clusters were calculated when using the epigenetic data 1–5 Kbps around the transcription start sites (TSSs). The CC of Dewer reached to 0.9.
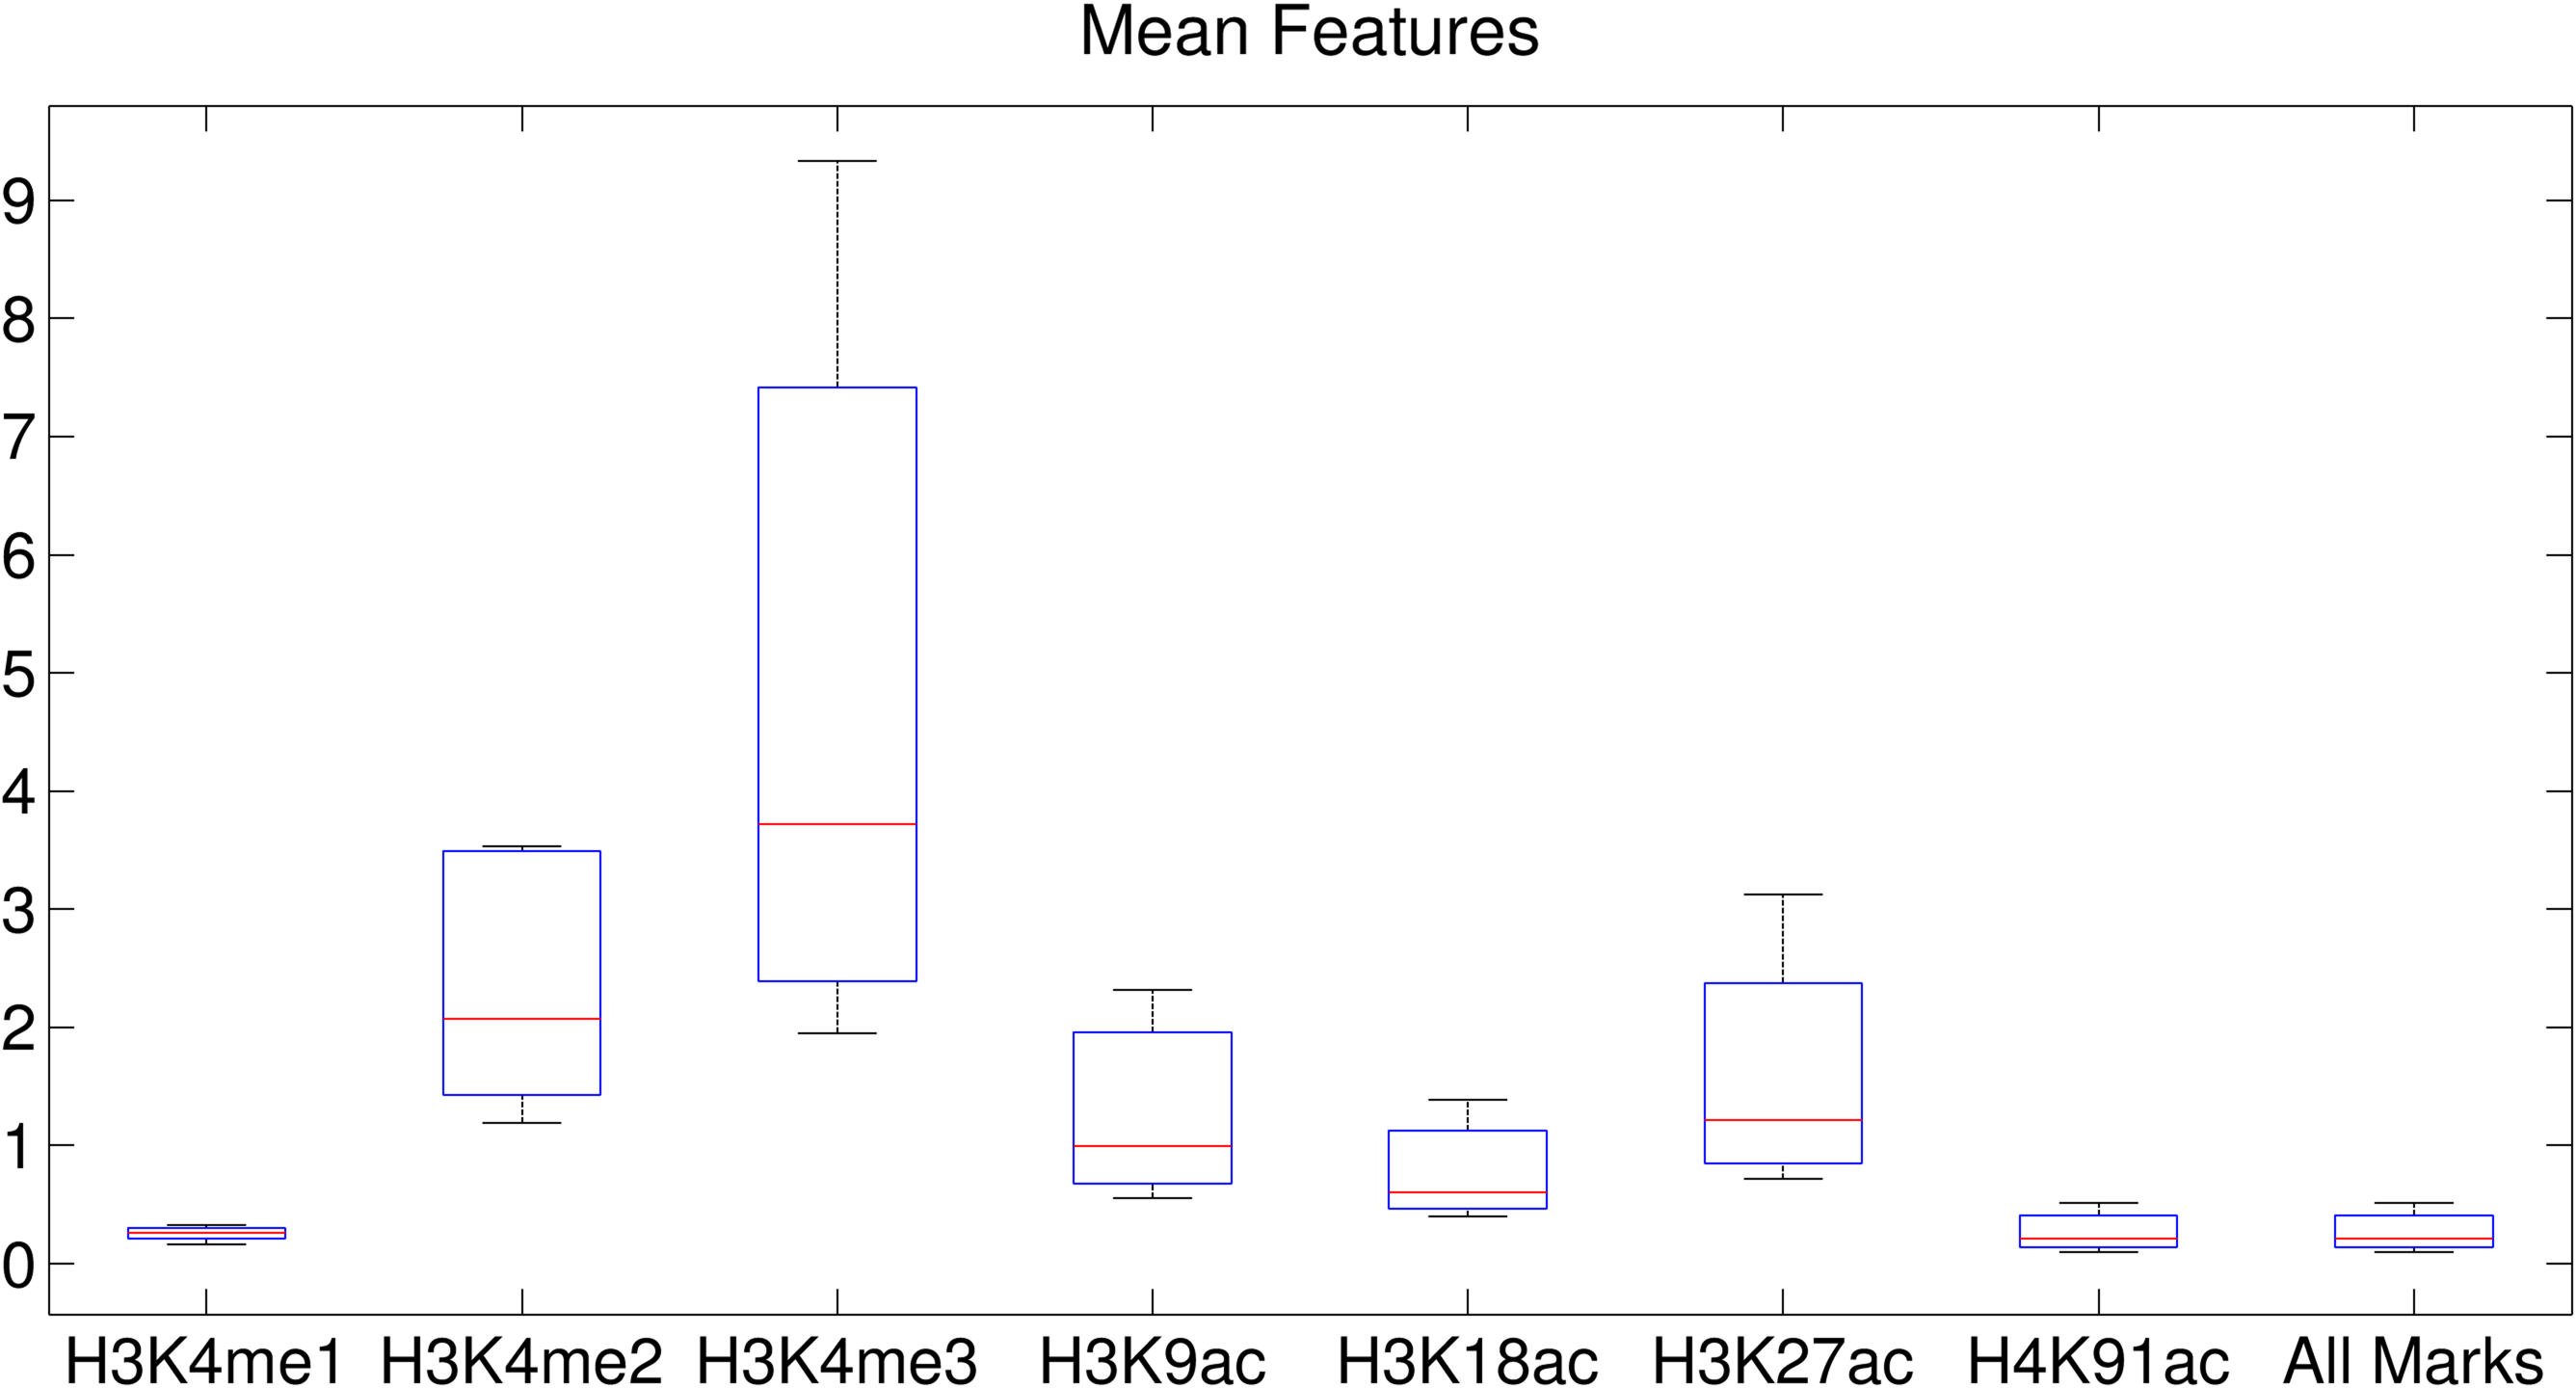
The mean value of each histone modification mark using the window method.
The mean value and its association for each histone modification mark. CCs between expression levels and the mean levels for the clusters were calculated when using the epigenetic data 1–5 Kbps around the TSSs.
Figure 13 shows an example of the epigenetic landscapes around the TSS of Cd151 and Orc1 in IMR90. Though Orc1 had a higher mean value around the TSS, its expression was much lower compared with Cd151. The entropy of Cd151 was much higher, which correlated well with their gene expression levels. These examples as well as our results suggest that entropy is a good marker for evaluating gene expression
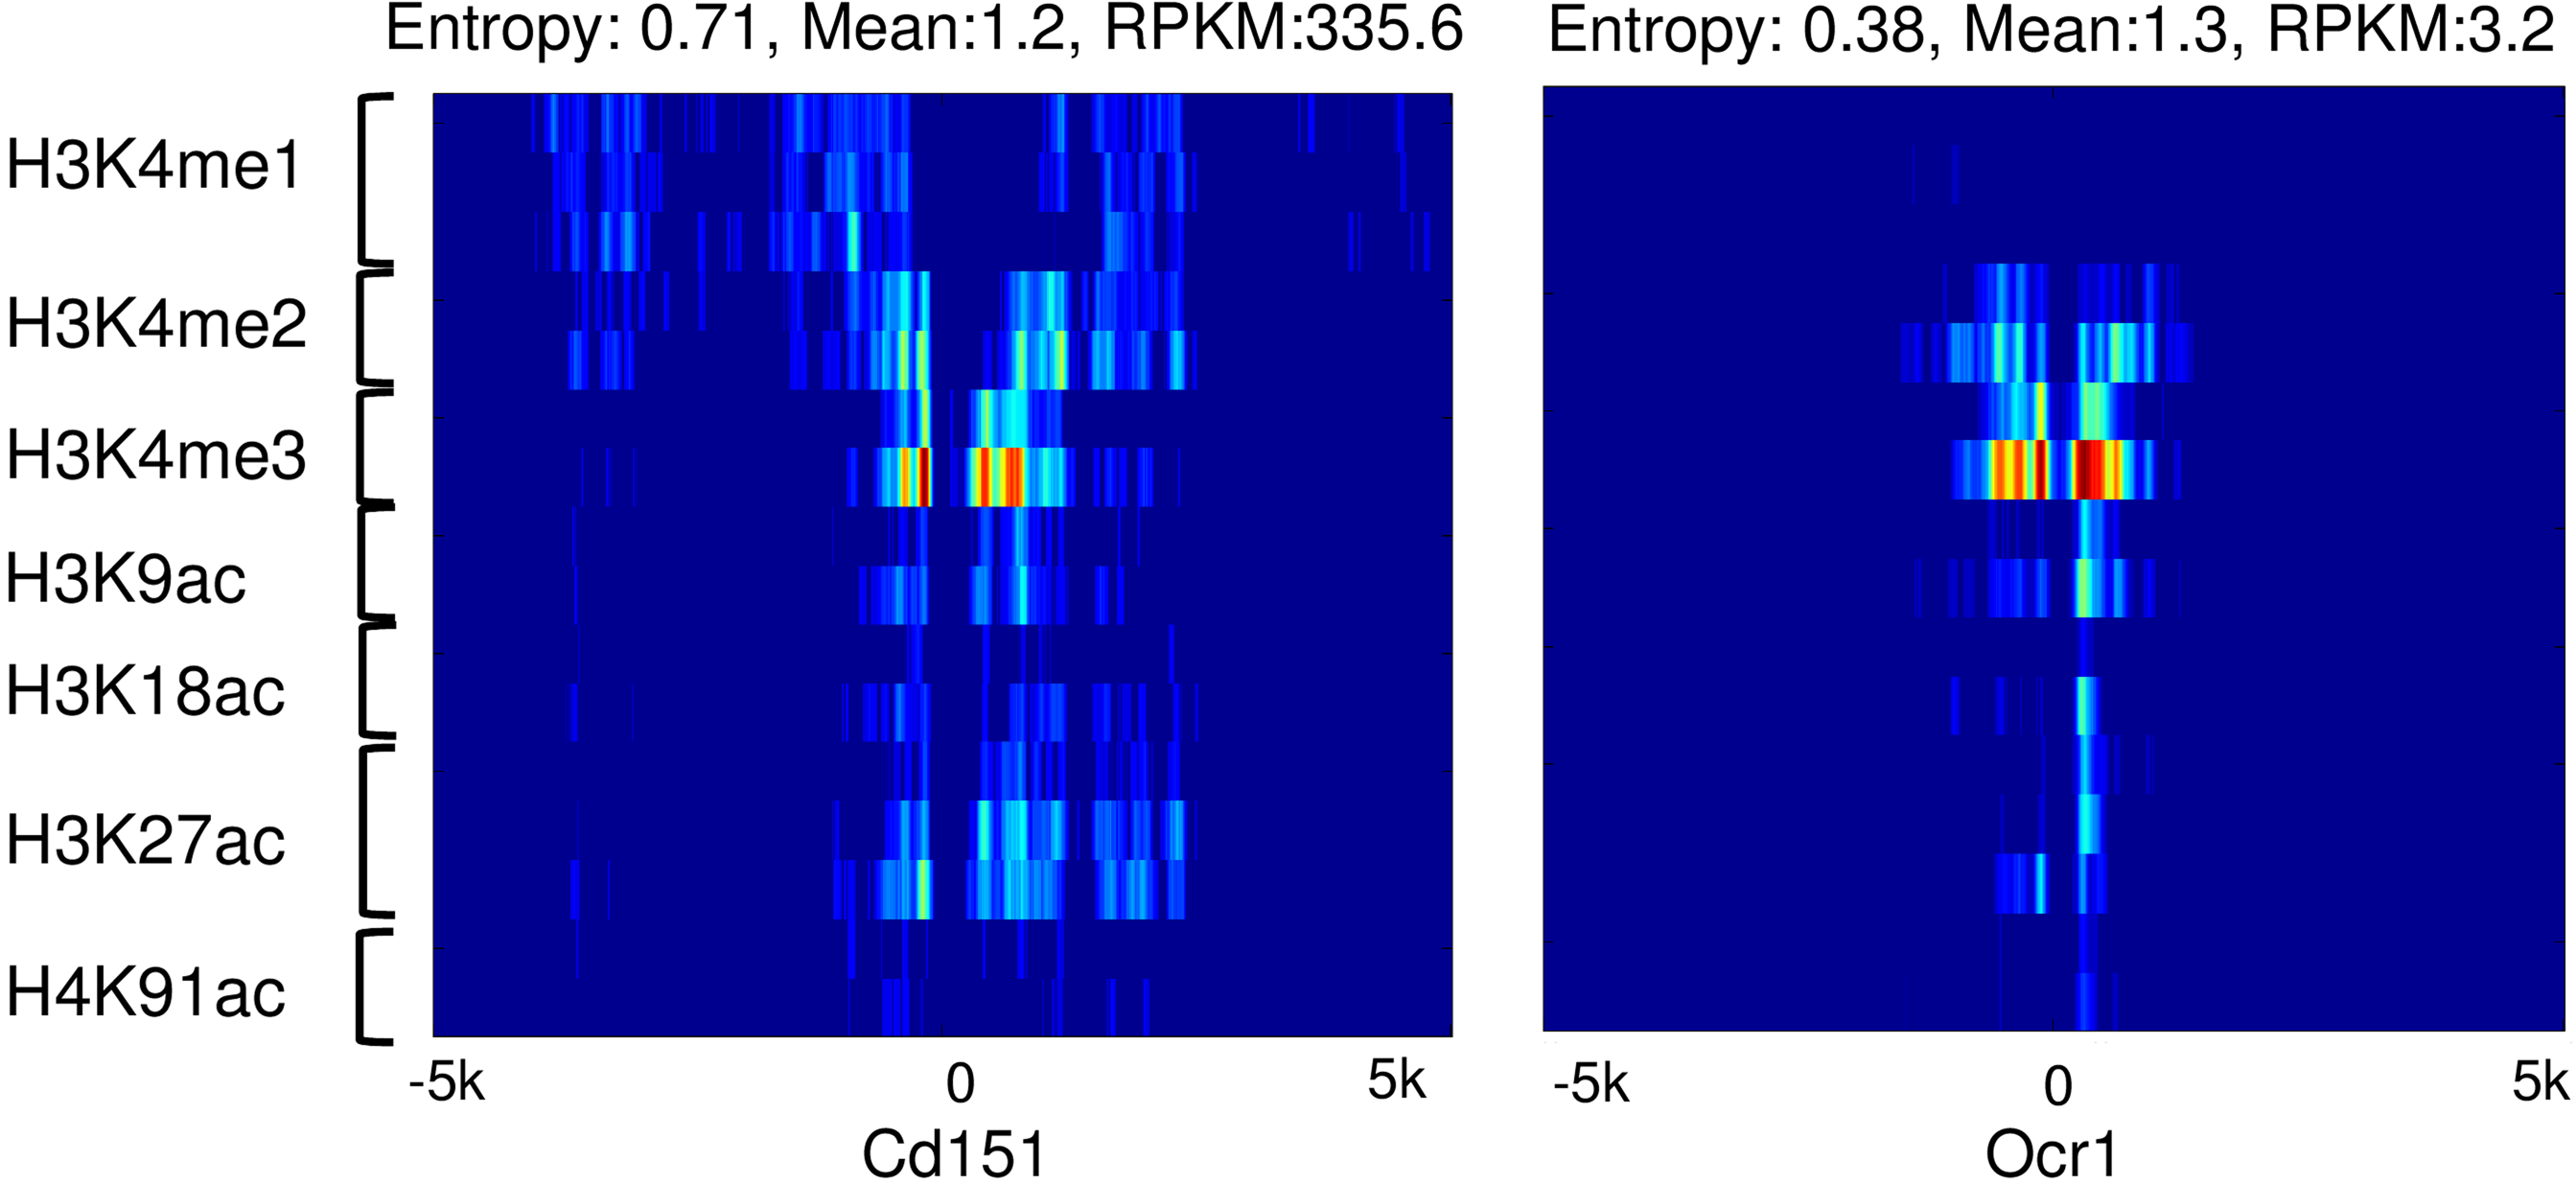
The epigenetic landscapes around the promoter of Cd151 and Ocr1. The entropy, mean value, and expression levels (reads per kilo base per million, RPKM) are compared in association with epigenetic landscapes.
4. Discussion
Understanding of the complex nature of epigenomic signals is still a challenging problem. Gene clustering has been successfully applied to study epigenetic regulation. In this article, we introduce a method to improve the clustering performance by using the signal processing approaches. Dewer effectively uses the nature of epigenetic signals for clustering by employing the entropy from the SW. We found that the genes clustered by Dewer better dissected the gene groups in terms of gene expression. Interestingly, gene expression levels well correlated with the entropy levels of epigenetic data. Our results showed that signal processing approaches effectively use the characteristics of epigenetic signals for gene clustering.
Our tests showed a number of advantages of using entropies. Particularly, entropy can be applied even when the signal intensity is low. This suggests that using entropy or SW entropy is a more robust way to study gene regulation than using mean-based approaches. Also, entropy can be obtained from multiple histone modification marks. We found that using the entropy performed best when using all marks together. This is because the relationships among histone modification marks are well stored in the entropy of the 2D epigenetic images.
Dewer was not designed to predict gene expression using histone modification (Karlic et al., 2010; Dong et al., 2012; Kumar et al., 2013). We used gene expression as a surrogate to show the discriminative power of Dewer in clustering. Our results, at least, suggest that statistical features such as entropy can be a good measure to predict gene expression.
To apply entropy effectively, we restricted entropy to the enriched regions for histone modification signals. SW entropy in HH2 scale produced the best performance, suggesting that the information in high-frequency scale is important for gene clustering. This further suggests that the shape of epigenetic signal is more important than the averaged signals (low frequency) for gene clustering.
Clustering analyses have identified various histone codes, including bivalent promoters (Bernstein et al., 2006), poised enhancers (Creyghton et al., 2010; Rada-Iglesias and Wysocka, 2011), and alternative splicing (Luco et al., 2010; Luco and MisteLi, 2011). Computational approaches have been applied to identify co-enriched histone modifications (Ucar et al., 2011; Rajagopal et al., 2013; Santoni, 2013; Nguyen et al., 2014a). While previous approaches identified combinatorial patterns, it is hard to interpret the clusters obtained using entropy using the same manner. Instead, we use the information contents residing in epigenetic signals for clustering. The results provide us with a good measurement to detect gene expression. Though we restricted our study to promoter regions to investigate the relationships with genes, our approach can easily be applied to distal regulatory regions.
Footnotes
Acknowledgments
This work was supported by R21-DK098769 and P30-DK19525 from the National Institutes of Diabetes, as well as Digestive and Kidney Diseases and the Diabetes Research Center at the University of Pennsylvania.
Author Disclosure Statement
No competing financial interests exist.