
Abstract
Abstract
Identifying high-confidence candidate genes that are causative for disease phenotypes, from the large lists of variations produced by high-throughput genomics, can be both time-consuming and costly. The development of novel computational approaches, utilizing existing biological knowledge for the prioritization of such candidate genes, can improve the efficiency and accuracy of the biomedical data analysis. It can also reduce the cost of such studies by avoiding experimental validations of irrelevant candidates. In this study, we address this challenge by proposing a novel gene prioritization approach that ranks promising candidate genes that are likely to be involved in a disease or phenotype under study. This algorithm is based on the modified conditional random field (CRF) model that simultaneously makes use of both gene annotations and gene interactions, while preserving their original representation. We validated our approach on two independent disease benchmark studies by ranking candidate genes using network and feature information. Our results showed both high area under the curve (AUC) value (0.86), and more importantly high partial AUC (pAUC) value (0.1296), and revealed higher accuracy and precision at the top predictions as compared with other well-performed gene prioritization tools, such as Endeavour (AUC-0.82, pAUC-0.083) and PINTA (AUC-0.76, pAUC-0.066). We were able to detect more target genes (9/18/19/27) on top positions (1/5/10/20) compared to Endeavour (3/11/14/23) and PINTA (6/10/13/18). To demonstrate its usability, we applied our method to a case study for the prediction of molecular mechanisms contributing to intellectual disability and autism. Our approach was able to correctly recover genes related to both disorders and provide suggestions for possible additional candidates based on their rankings and functional annotations.
1. Introduction
D
The availability of such massive amounts of information, however, poses additional challenges, which include, inter alia, the need for the integration of heterogeneous data from multiple sources and the extraction of the most critical information from the high dimensional feature space. In this study, we address these challenges by introducing a novel approach for predicting new high-confidence genetic factors contributing to disease phenotypes. Our approach, enrichment-based conditional random field (CRF), prioritizes the candidate genes by utilizing different types of information coming from network and annotations and allows us to fully explore the available information. This prioritization of candidate genes was achieved by rank-ordering a list of candidates with respect to their relevance to an input gene list based on current knowledge.
Multidimensional biological information was acquired from our in-house Lynx knowledge base (Sulakhe et al., 2014), which integrates various classes of information from over 35 public databases and private collections (NCBI databases, EMBL, UniProt, TIGR); molecular pathways (e.g., Reactome, BioCarta, KEGG, NCI pathways); phenotypic databases (OMIM, disease ontology, phenotype ontology databases); and ontologies [Gene Ontology (GO)(Ashburner et al., 2000), BioPAX, phenotype ontology, disease ontology, MI- PSI, etc.]. Here, a novel way to prioritize candidate genes is introduced by using both gene annotations and reliable information that describe gene–gene interactions based on natural fusion of an underlying gene interaction network (Szklarczyk et al., 2011), as well as various classes of biological information (Sulakhe et al., 2014). Network information and annotations were retained in their original form without manually converting them into each other.
We validated our approach with independent benchmark studies, which revealed an AUC value of 0.86 and a 22% error reduction rate compared with previous tools, including Endeavour (Tranchevent et al., 2008) and PINTA (Nitsch et al., 2011). Finally, we applied our method to a case study for the identification of genetic factors contributing to autism and intellectual disability, and predicted novel promising candidate genes for these phenotypes.
2. Related Work
Gene prioritization is the process of assigning similarity or confidence scores to genes, and ranking them based on the probability of their association with the disease of interest. In the past, several bioinformatics tools for gene prioritization were developed, including but not limited to Toppgene (Chen et al., 2009), Endeavour (Tranchevent et al., 2008; Aerts et al., 2006), Suspects (Adie et al., 2006), and PROSPECTR (Adie et al., 2005) [for a detailed review see the Gene Prioritization Portal (Tranchevent et al., 2010)]. These tools are based on the assumption that the genes that share functionality or interact with each other would be involved in similar phenotypes. Tools such as ToppFun (Chen et al., 2009), GATHER (Chang and Nevins, 2006), and Endeavor used high-dimensional features to prioritize candidate gene lists; for example, ToppFun uses a statistical enrichment process and summarizes a representative profile of training genes with 17 categories (e.g., GO, human and mouse phenotype, text mining results), while Endeavour applies a statistical approach to build profiles for attribute-based features and term frequency inversed document frequency (TFIDF), and recently implemented a kernel-based version. Suspects, Toppgene, and Endeavour compare candidate genes with the extracted representative features by fuzzy similarity measurement (Chen et al., 2009), Pearl correlation (Aerts et al., 2006), or kernels (Aerts et al., 2009) to produce similarity scores for candidate genes that can be combined through order statistics or kernel-based methods (Aerts et al., 2009). The other tools, including ToppNet (Chen et al., 2009) and PINTA (Nitsch et al., 2011), rather than relying on high-dimensional features instead utilize networks and prioritize candidate genes by using an underlying global protein interaction network [e.g., String (Szklarczyk et al., 2011; Jensen et al., 2009) or D2I (Brown and Jurisica, 2005].
3. Approach Overview
In this study, we present a novel gene prioritization approach that ranks promising disease candidate genes based on the modified conditional random field (CRF) model that simultaneously uses both gene annotations and gene interactions, while preserving their original representation. The major flow of our method consists of five main steps (Fig. 1). First, a training set is acquired from the user input (i.e., a set of genes known to be associated with a certain disease or phenotype, which is referred to as user input or training/seed genes). Second, these training genes are annotated using various classes of information (e.g., GO terms) from LYNX knowledge base (Sulakhe et al., 2014) to obtain a union of annotations for the user input genes. Here, the union of annotations per source is the feature set for the individual source. Subsequently, an enrichment analysis is performed on each feature in the feature set with respect to the training genes to extract the most important features and to remove irrelevant annotations from the model. This enrichment analysis attaches importance scores to all features, while a gene interaction network is acquired to extract pairwise interactions for the CRF model in order to build edge factors. To combine annotations and network information, the filtered features with importance scores and the underlying network are formulated as factors in the general CRF model. The joint probability is the factorization of all the factors divided by a normalization parameter. The probability of labels on the candidate genes can be inferred from the model. Finally, the probabilities for all candidate genes are combined from multiple LYNX sources into overall scores. To assess the significance of the overall scores on the genes, a permutation is performed to calculate a p-value for each candidate gene in the list.
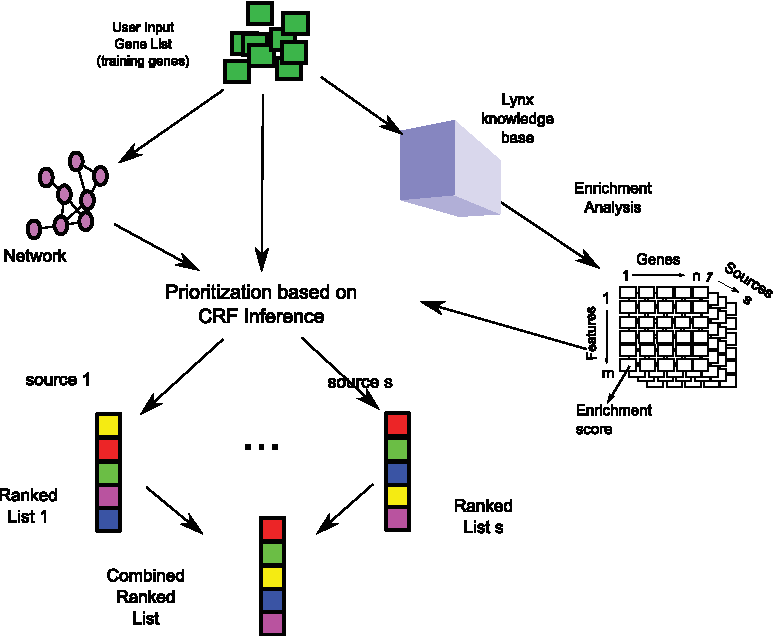
For a given list of genes, our approach uses both network and multisource feature information from the LYNX knowledge base to build the CRF model and produces the final prediction based on combined scores.
4. Enrichment Embed Conditional Random Field for Prioritization
In this section, we introduce an enrichment-based CRF method for gene prioritization that ranks a list of candidate genes based upon a list of genes with known disease association, using information including gene–gene interactions and gene annotations. The enrichment analysis is used for feature selection and feature weighting. The CRF is used to integrate gene interaction network information and gene-centric features.
4.1. Conditional random fields
Conditional random field (CRF) is a probabilistic graphical model that can estimate the probability of an unknown label set Y from a given observation set X. In the setting of gene prioritization, X is the set of known disease genes, and Y is the remaining genes for which we would like to predict their disease association. Let G(V, E) denote the gene–gene interaction network where V is the set of genes in the graph and E is the set of edges (i.e., interactions). A factor graph was constructed by integrating gene level annotations over G. Figure 2 shows an example of using CRF modeling a small-scale network with 6 nodes (genes) and 7 edges (interactions). In total there are 13 factors including 6 node factors and 7 edge factors. There are multiple annotations associated with genes, hence the node factors are also associated with those multidimensional features. A global feature is initialized to represent the background probability of random gene associated with any disease. Edge factors share one feature, which represents the scenario that two nodes in the same edge agree or disagree. The nodes with observed labels are colored in red while the labels of the remaining nodes are to be determined. Then the probability of unknown associations between lighter nodes and the disease can be modeled using the CRF. The conditional probability in CRF can be computed by the summation of all exponential factors on the nodes V and edges E, and the factors can be further parameterized by features on the factors as shown in Equation (1):
where X is the set of genes known to be associated with a certain disease, Y is the set of genes in the rest of the genome, Z is the normalization parameter, V| S is the set of nodes in both node set V and subgraph S. Note that in this setting, S is either a single node or a pair of nodes. A node feature function fk is equal to 1 when gene i is associated with the kth feature and labeled with disease, and 0 otherwise. Edge feature g is equal to 1 when both nodes in the edge have the same label, and 0 otherwise; μk is the weight for the kth node feature, and λ is the weight for the edge feature.
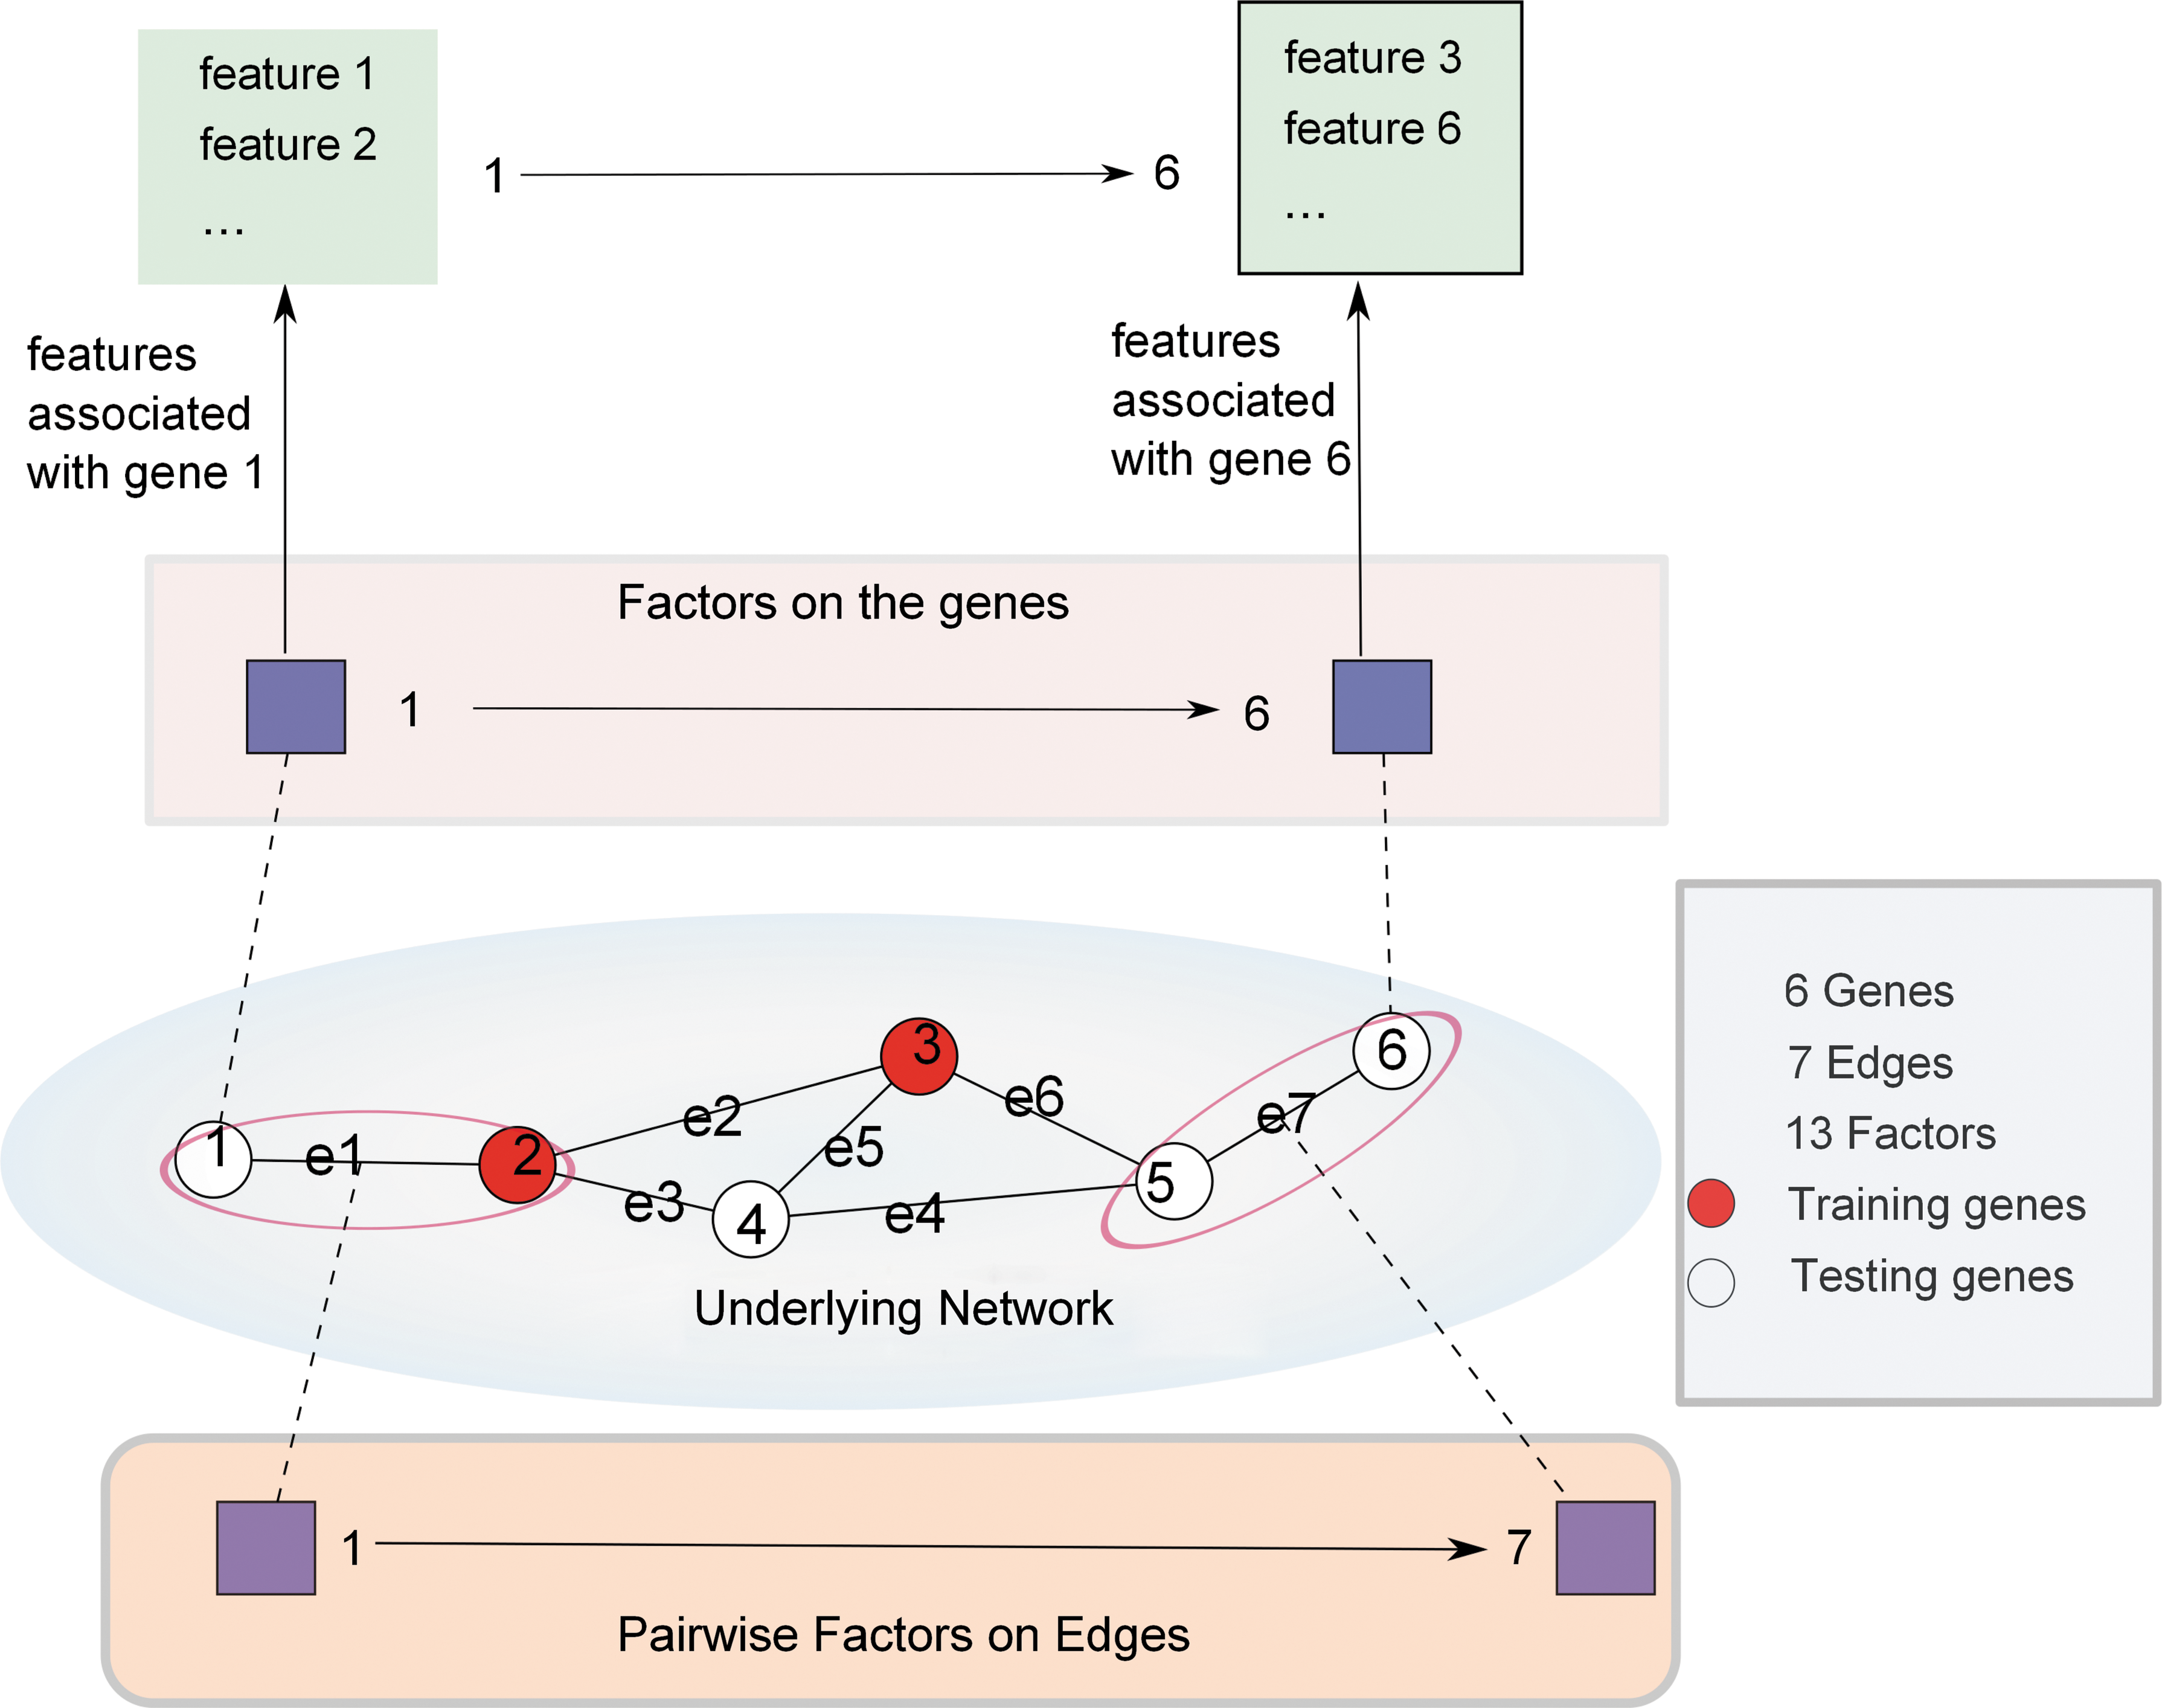
An example CRF model with 6 nodes (genes) and 7 edges (interactions). There are in total 13 factors including 6 node factors and 7 edge factors. Each node factor is associated with a list of features.
After constructing the CRF model, a global inference was performed to determine the marginal probability of each test node. Exact inference is computationally hard for an arbitrary graph structure (Sutton and McCallum, 2010), therefore, approximate inference method, loopy belief propagation (LBP), was used to perform the inference.
4.1.1. Annotation and enrichment
In previous studies (Xie et al., 2013), weights were learned from training examples, which was a time-consuming task and may not converge to the global optimum. To obtain meaningful weights for the factors, features were categorized into two groups: the edge features and the node features. Note that all edge factors shared one feature fe. A uniform weight we was assigned and tuned later. All the node factors on the other hand shared a set of features
4.2. Data sources integration
After performing inference on the CRF model, probabilities of disease association on each gene Pi(Y|X) were obtained from data source si. Next, the score of one gene associating with a certain label was computed by a weighted sum of all the data sources:
where m is the total number of data sources and θi is the weight for the ith source. Currently, the weights were tuned manually by setting to binary values in the experiments and benchmarked in the Results section.
4.3. Statistical validation
Since the probabilities were converted into the overall scores of various data sources, a statistical analysis was performed to estimate the significance of certain gene-label associations. To achieve this, we performed a large-scale randomization of input genes to obtain the score distribution and computed a p-value for each result gene. Standard false discovery rate (FDR)/Bonferroni correction was then applied to adjust p-values.
5. Results
Our method was validated on an unbiased benchmark containing 42 newly discovered disease genes (Börnigen et al., 2011) in two independent settings. First, the backdated validation benchmark was used on a selection of data sources to be able to provide an unbiased and fair performance comparison with other gene prioritization tools (Börnigen et al., 2011). This analysis revealed a high partial area under the curve (pAUC) values (0.86) for our method. Second, the data sources were extended to a broader collection to find a robust and best-performing combination, again validated on the benchmark but on current data sources, revealing an AUC of 0.89. Finally, our approach was applied to a case study of intellectual disability and autism to predict new causal candidates.
5.1. Validation on a unbiased disease-gene benchmark
First, the performance of our approach was estimated based on an unbiased disease-gene association benchmark (Börnigen et al., 2011). This analysis consists of 42 disease genes that were newly discovered by the time of the benchmark study to mimic new discovery. To enable an unbiased and fair comparison with other tools from this benchmark, the data sources were backdated to the same time as this benchmark study as described below.
5.1.1. Backdated discovery-based cross-validation
To perform an unbiased evaluation and to enable a fair comparison with other existing tools from the published unbiased benchmark study (Börnigen et al., 2011), we needed to backdate our feature data and network data to a time point no later than 2010. Human Gene Ontology (GO) terms (2007) from Uniprot were used as a feature. The String network version 8.2 (Jensen et al., 2009) was used as the underlying functional network. A leave-one-out-cross-validation (LOOCV) was performed and resulted in a receiver of characteristic (ROC) curve (Fig. 3) with an AUC value = 0.86. In this validation, the same candidate set was used as Endeavour and PINTA. For genes without any known annotations or interactions, we initialized all the genes in the candidate set with a global feature. This global feature represents the prior probability of a gene associated with diseases, thus was shared by all genes. Since there was no prior distribution of disease genes, the prior probability was set to 0.5.

ROC curves on a disease gene benchmark study using Endeavour, Pinta, and our enrichment-based CRF. The zoomed-in portion is the partial ROC curve within the range of [0, 0.2]
Next, we compared our results with Endeavour (Tranchevent et al., 2008) and PINTA (Nitsch et al., 2011) from the previous benchmark study (Börnigen et al., 2011). Here, Endeavour used 14 distinct data sources, including annotation (GeneOntology, Swissprot, Interpro, Kegg, EnsemblEst); Interaction (Bind, String); Expression (SonEtAl, SuEtAl); Precalculated (Ouzounis, Prospectr); Motif; Blast; and Text mining, while PINTA only used network information from String version 8.2. The resulting ROC curves of the LOOCV are visualized in Figure 3, showing a higher AUC value for our CRF-based method (0.86) than Endeavour (0.82) and PINTA (0.76) by using only GO term and network information. Compared with Endeavour, our approach reduced the error by 22%, since among the top 20% of gene prioritization results, we observed a much higher pAUC value (0.1296) for our method than for Endeavour (0.083) and PINTA (0.066) (Table 1, Fig. 3), while the achievable maximum pAUC on the top 20% is 0.2; the true positives among the top predictions demonstrate that we outperformed Endeavour and PINTA by identifying more target genes (Table 1).
pAUC, partial area under curve; TP, true positives.
CRF, conditional random field.
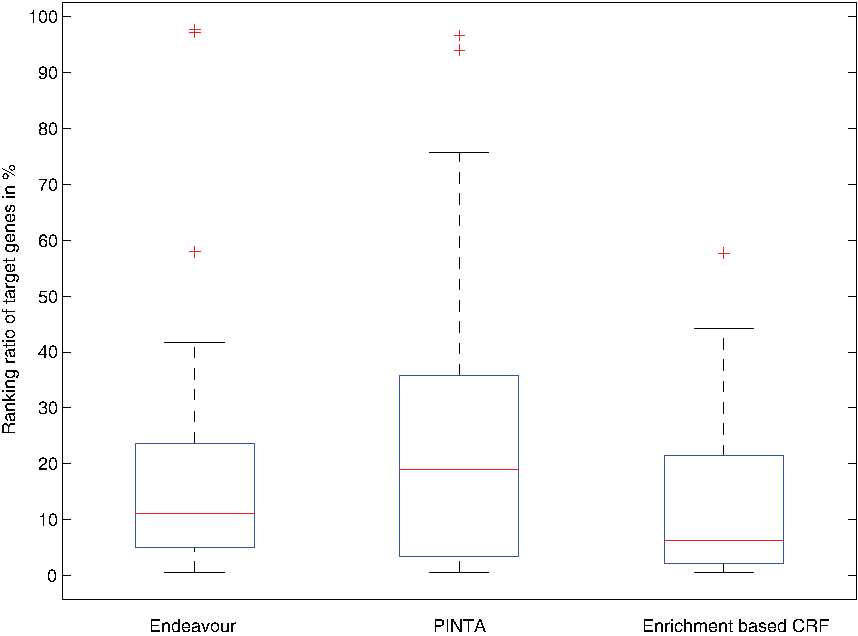
Distribution of target gene ranking ratio ranked by Endeavour, PINTA, and our enrichment based CRF with medians at 11.0, 18.87, and 6.0, respectively, and standard deviation of 21, 24 and 15, respectively.
5.1.2. Comparison of data sources
In the previous section we compared the performance of our method with Endeavour and PINTA using backdated data source Gene Ontology and network information from STRING. However, there are multiple up-to-date data sources in LYNX database, including the Gene Ontology source with three main categories (biological process, molecular function, and cellular component) and hierarchical associations between the concepts, Pathway data sources from KEGG, BioCarta, Pathway Commons (PC), Human Phenotype Ontology (HPO), Tissue, Disease database, Vista Enhancer, and Vista TFBS Clusters. To compare these data sources in the LYNX knowledge base, the same benchmark was used. To evaluate the data sources, we introduce the coverage C of a data source:
If the coverage of a data source is close to 1, this source can always produce valid rankings for the target genes, otherwise this data source has missing data on the target genes. Table 4 shows the AUC values for sources separately, as well as the data source coverage, which reflects the proportion of target genes without any annotations in the particular source. Here we can see that Disease, Gene Ontology, Pathway, and Phenotype are the most informative sources with the highest coverage of genes. Since our benchmark covered various types of diseases, we suggest using these sources in the default setting of prioritization if general diseases are studied. However, if a specific brain-related disease is of interest, users should include the Brain Connectivity Ontology source.
AUC, area under curve.
5.2. Case study: Intellectual disability (ID) and autism
Genes associated with syndromic and nonsyndromic intellectual disability (ID) were extracted from both OMIM (OMIM, 2012) and literature (Ropers, 2008; van Bokhoven, 2011; Lubs et al., 2012; Inlow and Restifo, 2004). This resulted in a high-quality consolidated list of 475 ID genes that were used in our analysis (see Supplementary Table S1a, available online at www.liebertpub.com/cmb). Genes associated with autism spectrum disorders were obtained from the AutDB database release 3.0 (Basu et al., 2009) (see Supplementary Table S1b).
Forty-eight genes associated both with autism and ID were used as a training gene set for prioritization. The annotation-based feature data sources applied in this prioritization were GO terms, pathways, and phenotypes, while the underlying global network was String 9 (Jensen et al., 2009). Here, we performed a genome-wide ranking. The p-values for the ranked genes were obtained from the distribution generated by random permutations on input genes. The p-value cutoff was set to 0.01 after Bonferroni correction. A total of 190 top-ranked genes with the p-value equal or less than 0.01 were extracted and used for further analysis and annotation.
Table 5 shows the results of the annotation of the top-ranked predicted genes. As it follows from the table, 124 out of 190 of the top-ranked genes were known ID and autism genes, where 94 of them were predicted, in addition to the 30 genes that were from the original seed set (see Supplementary Table S1 for more details). As it follows, 124 out of 190 of the top-ranked genes were known ID and autism genes, out of which a set of 94 additional genes were correctly predicted to be associated with these phenotypes (see Table 5 for more details).
The prioritized genes were further annotated with the relevant phenotypic information shown in Table 6. The associations with the phenotypes relevant for ID-associated conditions and autism were extracted from the Human Phenotype Ontology (Köhler et al., 2013). A total of 135 out of 160 top-ranked genes were either identified as autism or ID genes from the master list or associated with at least one relevant phenotype with ID/Autism. Meanwhile, 25 genes did not have obvious connections to two conditions. Extensive literature analysis, however, has provided evidence of association of these genes to ID or autism (see Supplementary Table S2). Thirteen of the relevant studies were published after 2011. For example, ATCAY (ranked number 4 out of these 25 genes) may be a promising candidate gene for autism. This gene was previously shown to play a role in the development of neural tissues, particularly the postnatal maturation of the cerebellar cortex (Tan, 2012). It also plays a role in neurotransmission through regulation of glutaminase/GLS, an enzyme responsible for the production in neurons of the glutamate neurotransmitter. Moreover, the ATCAY gene regulates the localization of mitochondria within axons and dendrites.
6. Discussion
In this article we introduced a feature- and network-based gene prioritization method by modeling both types of information on a CRF model. The pairwise relationship on genes is encoded into edge factors, and the annotation-based features are encoded with node factors in the CRF model. The correctness and potential of the method was demonstrated through the validation on a published diseases benchmark by obtaining a higher partial AUC value and better absolute true positives in top-ranked candidate genes than other existing gene prioritization tools. This method is flexible with data sources, allowing for heterogeneous feature types. It outperformed other tools by identifying more true positives on top of the ranked list while using less information. This result shows that using both network and feature information without converting them to each other can enhance the precision on disease genes predictions. The final case study shows a strong association between top-ranked genes and the phenotypes of interest. We were able to identify 25 additional novel genes, potentially related to the phenotypes of interest (ID and autism) and recommend these genes as possible candidates for further testing.
Footnotes
Acknowledgment
The authors are very grateful to Andrew Taylor for his help in preparation of the manuscript.
Author Disclosure Statement
No competing financial interests exist.
References
Supplementary Material
Please find the following supplemental material available below.
For Open Access articles published under a Creative Commons License, all supplemental material carries the same license as the article it is associated with.
For non-Open Access articles published, all supplemental material carries a non-exclusive license, and permission requests for re-use of supplemental material or any part of supplemental material shall be sent directly to the copyright owner as specified in the copyright notice associated with the article.