
Abstract
Abstract
In genetic association studies with deep sequencing data, it is a challenging statistical problem to precisely locate rare variants associated with complex diseases or traits due to the limited number of observed genetic mutations. In particular, both risk and protective rare variants can be present in the same gene or genetic region. There currently exist very few statistical methods to separate casual rare variants from noncausal variants within a disease/trait-related gene or a genetic region, while there are relatively many statistical tests to detect a phenotypic association of a group of rare variants such as a gene or a genetic region. In this article, we propose a new statistical selection strategy that is able to locate causal rare variants within the disease/trait-related gene or a genetic region. The proposed procedure is to linearly combine potential risk and protective variants in order to find the optimal combination of rare variants that can have the strongest association signal. It is also computationally very efficient since the procedure is based on forward selection. In simulation studies we demonstrate that the selection performance of the proposed procedure is more powerful than other existing methods when both risk and protective variants are present. We also applied it to the real sequencing data on the ANGPTL gene family from the Dallas Heart Study.
1. Introduction
I
However, there is a limited number of statistical methods that are able to distinguish causal rare variants from noncausal rare variants within the disease/trait-related gene or genetic region. Once a phenotypic association of a group of rare variants is detected, next interest is to specify which rare variants among multiple variants within the disease/trait-related gene or genetic region are truly causal variants. Most existing rare variant tests consider only an association of a group of variants since univariate analysis testing of an individual rare variant has too low statistical power due to rarely observed genetic mutations. Recently, Sun and Wang (2014) regarded this as a variable selection problem rather than a statistical test problem. Therefore, they proposed a power set (Pset)-based statistical selection procedure to locate susceptible rare variants within a disease/trait-related gene or genetic region. Their selection method, which is based on a weighted linear combination of multiple rare variants that has the maximum association signal, is powerful particularly when both risk and protective variants are present in the same gene or genetic region. However, it carries two nontrivial problems in practice.
First, Pset initially screens potentially protective variants and flips the coding of the protective variants so that both risk and protective variants can have an effect on the outcome in the same direction. This idea is originally proposed by Han and Pan (2010) and called a data-adaptive procedure. Sun and Wang (2014) demonstrated that the adaptive Pset (aPset) can precisely locate protective variants as well as risk variants when both risk and protective variants are present in the same gene or genetic region. However, the initial screening test of aPset is based on a marginal association test of each rare variant, so the detection power of potential protective variants depends on both variant effect size and a sample size. That is, aPset has a limitation to select protective variants when either the effect size or the sample size is relatively small. Another problem of aPset is computational cost for a big gene that has a large number of rare variants. The power set of the subsets of rare variants generates the 2 p − 1 different combinations of rare variants, where p is the total number of rare variants within a gene or a genetic region. As p is increasing, the computational time of the 2 p − 1 statistics is explosively increased.
In this article, we propose new statistical selection strategy to locate susceptible rare variants within a disease/trait-related gene or genetic region. The proposed method searches a single variant that has the strongest association signal with the phenotype outcome at each stage, where an individual variant is considered as potentially risk, protective, or noncausal. Then, selected variants at each stage are linearly combined until the association signal is no longer powerful. Since the proposed selection procedure proceeds at most p stages, the computational cost can be drastically reduced even for a big gene. Moreover, it is not required to perform the initial screening test to identify potentially protective variants, so the selection performance of protective variants are equivalent to that of risk variants. The rest of the article is organized as follows. In section 2, new statistical selection strategies and methods are described. In section 3, the results of extensive simulation studies where the proposed method is compared with the aPset selection procedure are present. We also applied the proposed selection procedure to real sequencing data on the ANGPTL gene family from the Dallas Heart Study (DHS). Finally, limitation of the proposed method and future research are discussed in section 4.
2. Methods
Assume that we observe the number of mutations over p rare variants in a gene or a genetic region from sequence data of n individuals. For the ith individual, let yi be a quantitative or a binary phenotype outcome, and if the outcome, is binary, yi is coded as either 0 for controls or 1 for cases. Let the p-dimensional genotype vector of the ith individual
Each rare variant should be one of risk, protective, or noncausal variants. We code them as 1, −1, and 0, respectively. Then, the parameter vector representing the type of variant can be defined as
where
When both risk and protective variants are present within the same gene or genetic region, detection power is likely to be decreased. For this reason, Han and Pan (2010) proposed to flip the coding of the protective variant so that both risk and protective variants can have an effect on the outcome in the same direction. Also, Sun and Wang (2014) employed this idea to find the optimal weighted linear combination. Individual variant weight wj is often used in rare variant analysis to increase association signals. For example, Madsen and Browning (2009) suggested to use the inverse of standard deviation of each variant. Lin and Tang (2011) demonstrated that a regression coefficient of an individual variant is an optimal weight.
In order to locate susceptible rare variants within a disease/trait-related gene, we need to find the optimal configuration of rare variants that has the strongest association between the weighted linear combination zi and the phenotype outcome yi. In presence of covariate effects such as age and gender, we can replace yi by the regression residual
where
Exhaustive search of the optimal configuration requires 3
p
– 1 computations of the statistic. Although this is computationally feasible, the exhaustive search is very inefficient when p is relatively large like a big gene. In this article, we propose a forward-based procedure to select both risk and protective variants. The basic idea is that the most outcome-related variant that could be either a risk variant {ξj = 1} or a protective variant {ξj = −1} is included in the model one by one until no association signals between the weighted linear combination and the phenotype outcome are increased. We start with a single variant association for p variants, where we consider only p configurations such as
At the second stage, the weighted linear combination of the the ith individual zi is updated as
Given
replaces zi in Equation (1) and the
where λ ≥ 0 is a tuning parameter that controls a model size. When λ = 0, the model selects the most number of variants, including possible false positives. In contrast, the model selects small numbers of variants as λ is increasing. In this case, both true positives and false positives are expected to be reduced. Consequently, the tuning parameter λ can balance the number of causal variants and noncausal variants selected by the proposed procedure.
The proposed selection procedure requires at most p stages and at most p(p − 1) computations of the statistic, while aPset (Sun and Wang, 2014) always needs to compute exactly 2 p − 1 statistics. Therefore, the difference of computational time between the proposed procedure and aPset is significantly noticeable when p is large. In addition to computational cost, the proposed method allows an individual variant to be risk, protective, or noncausal at each stage, leading to equivalent selection powers of both risk and protective variants. In contrast, aPset initially screens potential protective variants based on a marginal association test where selection power of protective variants are always lower than that of risk variants. Besides, the proposed selection procedure can control a model size using a tuning parameter λ, so a parsimonious model can be chosen to minimize the number of false positives if necessary.
3. Results
In this section, we conducted extensive simulation studies to compare the proposed selection procedure to the data-adaptive power set–based procedure (aPset) proposed by Sun and Wang (2014), who demonstrated that the selection performance of aPset is the most powerful compared with other selection methods, particularly when both risk and protective variants are present within the same gene or the same genetic region. Also, we applied the proposed selection procedure to the Dallas Heart Study data in order to locate both risk and protective variants within the trait-related genes.
3.1. Simulation studies
First, we generated a minor allele frequency (MAF) at each variant using the Wright's distribution (Ionita-Laza et al., 2011; Madsen and Browning, 2009; Sun and Wang, 2014)
where k = 0.0001, c is a normalizing constant, and q is the allele frequency, 0.001 ≤ q ≤ 0.01. Secondly, on the basis of the Hardy–Weinberg equilibrium (HWE), we generated genotype data
where ui1 is a binary covariate generated from Bernoulli(0.5), ui2 is a continuous covariate generated from N(0, 1), and εi is a standard normal error generated from N(0, 1). The variant effect size is defined as
In this setting rarer variants have larger effects. This is often used in rare variant simulation studies (Wu et al., 2011; Sun and Wang, 2014). Also, we set the sequence of γ from 0.2 to 0.7 increased by 0.1 so the average effect size of a risk variant is about 0.5 for γ = 0.2 and 1.75 for γ = 0.7. The sample size was fixed as 1,000, 2,000 and 5,000. For case–control phenotypes, we first generated twice the number of quantitative sample size, then we set case–control data selecting the top 25% of quantitative phenotypes (cases) and the bottom 25% of the phenotypes (controls).
We also considered three different variant settings such as (i) 5 risk, 0 protective, 10 noncausal, (ii) 3 risk, 2 protective, 10 noncausal, and (iii) 5 risk, 5 protective, 5 noncausal. Consequently, the total number of variants is fixed as p = 15 for all simulation studies. Before we conduct variant selection, we first detected significant genes with the 15 rare variants using the sequence kernel association test (SKAT) proposed by Wu et al. (2011). For only significant genes whose SKAT p-value is less than 0.05, we applied aPset and the proposed method with different λ values from 0 to 0.05 increased by 0.005. For a computational speed-up, we adopted a sample correlation for the statistic T(·,·) in Equation (1). In our experiment, other statistics from a regression-based test or a score test have almost the same selection result, since T(·,·) essentially measures the strength of correlation between two numerical vectors.
In order to assess the selection performance, we computed the averaged selection proportions (ASP) of risk, protective, and noncausal rare variants, along with three different variant settings, different sample sizes, different types of phenotype outcome, and different variant effect sizes. The ASP of risk variants is defined as
where K = 1,000 is the number of simulation replications. Similarly, the ASP of protective and noncausal variants are defined. The larger ASP of causal (risk and protective) variants and the smaller ASP of noncausal variants, the better the selection performance.
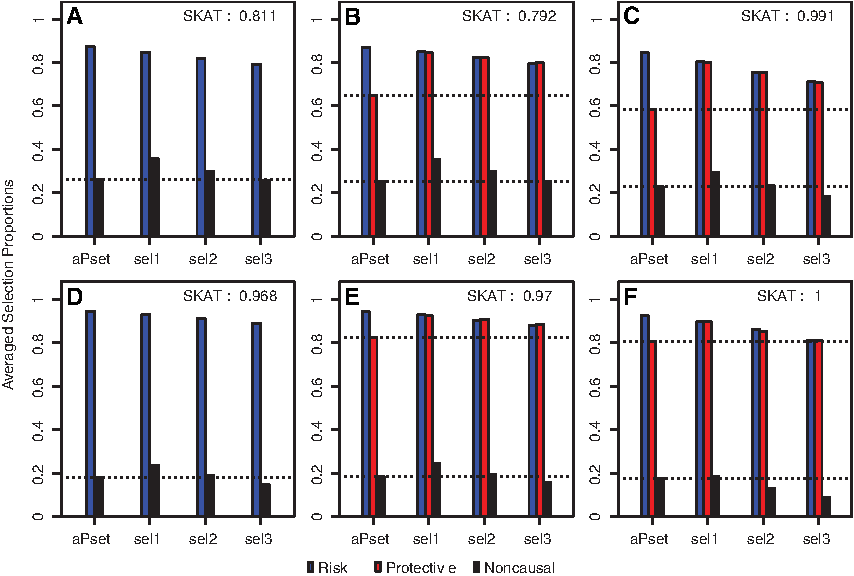
Figure 1 shows the ASPs of aPSet and the proposed selection procedures with λ = 0.005 (sel1), λ = 0.01 (sel2), and λ = 0.015 (sel3), along with three different variant settings and two different sample sizes of n = 1,000 and 2,000, when the outcome is quantitative and the averaged variant effect size is 0.75. It seems that the SKAT power is increasing as the sample size increases and the total number of causal (risk and protective) variants increases. As expected, the proposed selection procedure selects less noncausal variants when the tuning parameter λ increases, while it also selects less causal variants. For the proposed selection procedure, ASP of risk variants are almost the same as that of protective variants regardless of λ in all simulation settings.

Averaged selection proportions of risk (R), protective (P), and noncausal (N) rare variants for data-adaptive Pset (aPset), the proposed methods with λ = 0.005 (sel1), λ = 0.01 (sel2), and λ = 0.015 (sel3) when the outcome is quantitative. The sample size is n = 1,000 for
In contrast, aPSet always selects a significantly lower number of protective variants than risk variants since it applies a marginal association test to initially screen potential protective variants. Although aPset shows slightly better selection performance than the proposed procedures when protective variants are absent in a gene, the latter overwhelms the former when both risk and protective variants are present. For example, ASP of the protective variant for aPset is around 53% when there are 3 risk, 2 protective, and 10 noncausal variants with n = 1,000. In the same setting, sel1 can increase the ASP of protective variants up to 80%, allowing 10% more noncausal variants. Likewise, sel2 can increase it up to 76%, allowing 5% additional noncausal variants. Similar patterns for case–control binary outcomes were observed in Figure 2.
Averaged selection proportions of risk (R), protective (P) and noncausal (N) rare variants for data-adaptive Pset (aPset), the proposed methods with λ = 0.005 (sel1), λ = 0.01 (sel2), and λ = 0.015 (sel3) when the outcome is binary (case–control status). The sample size is n = 1,000 for
In addition to ASP, we also computed the selection power of each selection procedure. Sun and Wang (2014) defined the selection power as the simulation proportion that all causal variants (both risk and protective variants) are exactly selected among 1,000 simulation replications. Figure 3 displays the selection powers of the four selection procedures along with increasing variant effect sizes when there are 5 risk, 0 protective, and 10 noncausal variants, and 3 risk, 2 protective, and 10 noncausal variants with three different sample sizes, and the outcome is quantitative. The simulation result of selection power clearly demonstrates that the proposed selection procedure is superior over aPset in all simulation settings. Particularly, when the variant effect size is neither very small nor very large, the proposed procedure always outperforms aPset. The similar result was observed for case–control binary outcomes.

Selection power of data-adaptive Pset (aPset), the proposed methods with λ = 0.005 (sel1), λ = 0.01 (sel2), and λ = 0.015 (sel3) are displayed as the variant effect size increases when the outcome is quantitative. There are 5R/0P/10N variants in
In Figure 4, the selection power of the proposed method is present along with different values of λ when the sample sizes, variant settings, and the phenotype outcomes are all different. We can see that the values of the optimal tuning parameter λ that maximizes selection power are all different each simulation setting. This result concludes that the selection of the optimal tuning parameter of the proposed procedure can depend on the sample size; the type of phenotype outcome; and the number of risk, protective, and noncausal variants. Consequently, the correct choice of the optimal tuning parameter λ could be another challenging problem in rare variant selection. Although a signal value of λ is desired for real data analysis, we suggest to use multiple λ values and compare the selection results in practice.
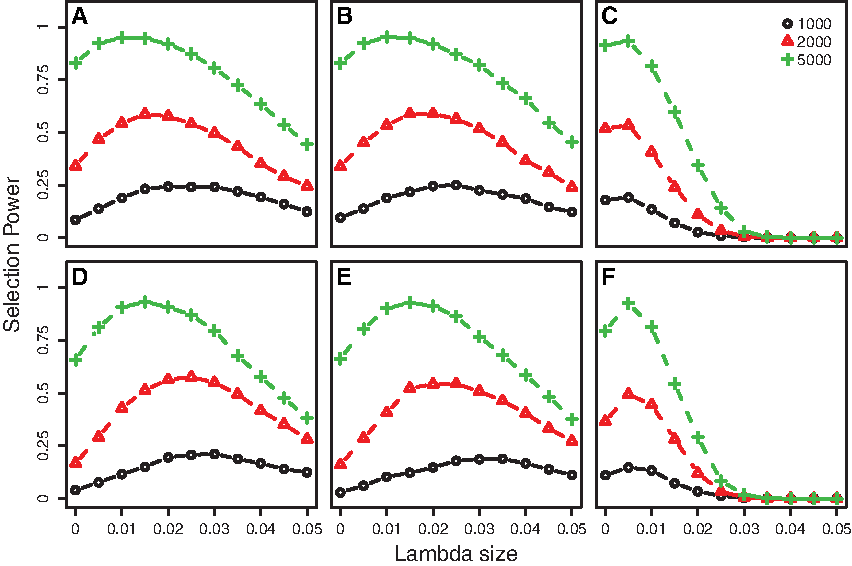
Selection power of the proposed method along with different λ values and three different sample sizes of 1,000, 2,000 and 5,000. The outcome is binary (case–control status) for
3.2. Data analysis
We also applied the proposed selection procedure to the Dallas Heart Study (DHS) data (Romeo et al., 2007, 2009), where four genes—ANGTPL3, ANGTPL4, ANGTPL5, and ANGTPL6—were sequenced to identify susceptible rare variants associated with nine energy metabolism traits, namely triglyceride (TG), low-density lipoprotein (LDL), very low = density lipoprotein (VLDL), high-density lipoprotein (HDL), cholesterol, glucose, body mass index (BMI), and systolic (SysBP) and diastolic blood pressure (DiasBP). Various statistical methods have been applied to DHS data to detect trait-related genes for different ethnic groups (Liu and Leal, 2010, 2012; Sun and Wang, 2014).
Previous analysis of DHS data is largely limited to the European-American population. In this study, we focused on the Hispanic population, considering gender and logarithm-transformed age as covariates. First, we applied SKAT to identify significant genes associated with nine phenotype outcomes at 5% significance level, and found that the ANGTPL5 gene is associated with a binary systolic trait for Hispanic population. This association was also reported by Sun and Wang (2014). The ANGTPL5 gene contains seven rare variants that have less than 2% MAF. We then applied the four selection procedures compared in the simulation studies in order to separate causal variants from noncausal variants within the ANGTPL5 gene.
Table 1 summarizes the selection result of the 7 rare variants. It appears that all of the proposed selection procedures with three different λ values have exactly the same selection result, while aPset shows slightly different results. In particular, although two potential protective variants L98P and T268M were selected by all four methods, the variants L125F and N329S were selected by the proposed procedure but missed by aPset. They could be also regarded as potential protective variants because the genetic mutations of these variants were observed only in controls. In simulation studies, we have already shown that aPset has lower selection power especially for protective variants compared with the proposed selection procedure. The selection result of data analysis might be consistent with that of our simulation studies. Therefore, additional biological analysis of two variants L125F and N329S are strongly recommended.
The symbol × indicates a selected variant.
The columns “cases” and “ctrls” indicate the number of mutations in cases and controls, respectively.
4. Discussion
In this article, we proposed a new selection strategy to locate both risk and protective rare variants within disease/trait-related genes or genetic regions. The proposed method is not only computationally efficient but also shows powerful selection performance especially when both risk and protective variants are present within the same gene or genetic region. In extensive simulation studies we demonstrated that the selection power of the proposed procedure outperforms that of aPset proposed by Sun and Wang (2014) in various simulation scenarios.
One drawback of the proposed method is dependency of tuning parameter λ, which controls the number of selected rare variants. The correct choice of the optimal tuning parameter can maximize the selection power of the proposed method. However, the value of the optimal tuning parameter varies on the sample size; the variant effect size; the type of phenotype outcome; and the number of risk, protective, and noncausal variants. New method development to determine the optimal tuning parameter is a possibility for future research. Although only unweighted versions of the proposed method were discussed in this article, new or existing variant weights can be easily applied to the proposed selection procedure. We expect that the optimal variant weight as well as the optimal tuning parameter can lead the proposed selection procedure to have the best selection performance of causal rare variants in genetic association studies with sequencing data.
Footnotes
Acknowledgments
This research was supported by the Research Fund Program of Research Institute for Basic Sciences, Pusan National University, Korea (RIBS-PNU-2013-310), and Basic Science Research Program through the National Research Foundation of Korea (NRF), funded by the Ministry of Education (2014R1A1A2054178).
Author Disclosure Statement
The authors declare that no competing financial interests exist.