
Abstract
Abstract
Driver mutations propel oncogenesis and occur much less frequently than passenger mutations. The need for automatic and accurate identification of driver mutations has increased dramatically with the exponential growth of mutation data. Current computational solutions to identify driver mutations rely on sequence homology. Here we construct a machine learning–based framework that does not rely on sequence homology or domain knowledge to predict driver missense mutations. A windowing approach to represent the local environment of the sequence around the mutation point as a mutation sample is applied, followed by extraction of three sequence-level features from each sample. After selecting the most significant features, the support vector machine and multimodal fusion strategies are employed to give final predictions. The proposed framework achieves relatively high performance and outperforms current state-of-the-art algorithms. The ease of deploying the proposed framework and the relatively accurate performance make this solution applicable to large-scale mutation data analyses.
1. Introduction
C
This work focuses on predicting one type of gene missense mutations, the point mutation, in which a single nucleotide change results in a codon that codes for a different amino acid. Protein missense mutations are known to correlate with cancer. For example, research has demonstrated that missense mutations in the adenomatous polyposis coli are correlated with the tumorigenesis in the colon as well as extra-intestinal tissues (Stratton et al., 2009). The direct impact of a missense mutation is a change in the amino acid in the corresponding protein sequence. Because of this one-to-one correspondence, it is feasible to analyze either protein sequence or gene sequence to categorize missense mutations. Here, we focus on using protein sequence for the following reasons: First, even though the genome sequence contains the genetic code for an organism, the implementation of genetic information largely depends on the functions of proteins and the phenotype is more closely related to protein sequences. Second, this work relies on computational modeling, for which the original data need to be properly represented, here called feature extraction. Since the amino acid sequence order and composition of the protein sequence are extracted, this feature extraction represents the essential characteristics of the protein. Third, compared with whole genome sequencing analysis, whole exome sequencing is faster, cheaper, and easier to analyze.
In order to address this research problem, a machine learning-based framework is proposed in this article to identify driver mutations automatically. Specifically, the current framework focuses on identifying the driver missense mutations that account for majority mutations in the cancer genome. The proposed framework utilizes a novel combination of feature sets that capture protein sequence characteristics. Figure 1 illustrates the proposed framework. First, the driver and passenger genes are collected from existing knowledge and downloaded from GenBank (Benson et al., 2008). Next, the mutation samples are extracted according to the mutation location on the corresponding protein sequences, and those samples are represented by numerical numbers according to a predefined mapping scheme. Features are extracted from the protein sequence and the numerical representation of the protein sequence. A feature selection approach is applied to identify the optimal set of features to be used. Finally, a multimodel fusion-based classification technique is applied to classify the driver and passenger mutations. The performance of the proposed framework is assessed and compared with existing techniques, CHASM (Carter et al., 2009), using the same mutation data set.

The proposed framework.
This article is organized as follows. Some of the notable existing mutation identification techniques are summarized in Section 2. Section 3 covers the proposed framework. Section 4 demonstrates the experiments results and a performance comparison with existing approaches. Conclusions are presented in Section 5.
2. Related Work
Machine learning-based solutions have been previously used in driver mutation prediction. Kaminker et al. (2007) proposed an approach, CanPredict, based on three computational methods. CanPredict uses a random forest classifier to predict whether a mutation is a driver or passenger mutation using three features. This classifier showed remarkably good results in identifying cancer-associated missense mutations. Another classification approach, CHASM, based on Random Forest, was proposed to identify and prioritize driver missense mutations and uses 49 predictive features selected based on mutual information (Carter et al., 2009). The feature set takes into account any missense change type in the COSMIC database of somatic variations in cancer (Forbes et al., 2006). CHASM performed well in terms of sensitivity and specificity when tested using known driver missense mutations and randomly generated missense mutations. Also, it outperformed other driver missense mutation approaches when tested with known oncogenic mutations in TP53 and the tyrosine kinase epidermal growth factor receptor. Capriotti and Altman (2011) proposed another approach based on support vector machines. The features vector consisted of 51 values covering mutation and local sequence information, sequence profile, PANTHER algorithm output (Thomas et al., 2003), and a cancer-specific functional-based log-odd score calculated considering the GO slim ontology. This approach results in higher driver mutation prediction accuracy when compared with CHASM.
Most of these approaches either rely on domain knowledge or depend on sequence analogy, which presents difficulties in analyzing novel sequences that show minimal similarity to the existing sequences. In order to address this challenge, we propose a computational framework that utilizes sequence-order information and is not dependent on domain knowledge and sequence homology.
3. Proposed Framework
3.1. Overview
The proposed framework is illustrated in Figure 1. It consists of three stages: a data collection and sample extraction stage, a feature extraction and selection stage, and a classification and model fusion stage. In the first stage, mutated gene sequences are collected and downloaded from GenBank (Benson et al., 2008) and a mutation sample is extracted from each sequence according to a predefined mutation window size. Next, feature extraction and selection approaches are applied on one mutation sample to compose the optimal set of features vectors. In this stage, three features sets, wavelet features, amino acid index (AAindex) features, and pseudo amino acid composition (PseAAC) features, are extracted from the mutation sample. Next, a feature selection approach is applied to each features set to identify the optimal set of features. Finally, feature vectors are processed by three support vector machine (SVM)-based classifiers, which are trained on each type of features, respectively. Combining the above-mentioned three features sets in a single framework enriches the framework ability to capture the physicochemical and biochemical properties of amino acids as well as the sequence order.
Next, a model fusion approach is applied to fuse the scores from the aforementioned three models and to derive a driver or passenger mutation label. This step is further divided into two phases: the training phase and the testing phase. During the training phase, both the features and the mutation types are input to the SVM model that will automatically “learn” the characteristics of the driver mutations and passenger mutations. After the model is properly trained, it is tested using mutation samples that are not used in the training phase. For each mutation, our framework gives a prediction indicating whether it is a driver or a passenger.
This overall process simulates a real-world scenario where the biologists and physicians must contend with a very large number of mutations, for example, in the TCGA database (Collins and Barker, 2007), and where there is a desire to know which mutations are the most probable candidates that are casually implicated in oncogenesis.
3.2. Input data
Our proposed framework takes only two inputs for each mutation sample. One is the accession number of a protein sequence in the NCBI RefSeq protein database11, and the other is the information about the mutation. For example, in “NP_001135977 R641W,” “NP_001135977” indicates the protein accession number and “R641W” indicates that at amino acid position 641 of this protein sequence the amino acid R (arginine) is mutated to W (tryptophan).
3.3. Data collection and mutation sample extraction
In this study, a benchmark data set provided by the authors of the CHASM system, developed at Johns Hopkins University, is utilized (Carter et al., 2009). This data set contains a list of driver mutations and passenger mutations. For the driver mutations, these mutations were previously identified as playing a functional role in oncogenic transformation. For the passenger mutations, we followed the procedure described in the CHASM system and synthesized the passenger missense mutations to simulate the mutation spectrum observed in tumors of similar histological origin. This method was demonstrated to increase classification accuracy in their original article. In order to generate the passenger mutations, a mutation table is needed. Currently, we utilized the default passenger mutation table provided in their article. In our experiments, we used a total of 3802 driver mutations and 4343 synthesized passenger mutations. This mutation data set was then divided into two portions: a feature selection and parameter tuning portion, and a framework validation portion. The feature selection and parameter tuning portion consists of 33.3% of the mutations, and the framework validation portion contains 66.7% of the mutations.
After the data are collected, the amino acid sequence for a specific protein according to the accession number is retrieved using the MATLAB toolbox. Next, we extracted a mutation sample that is a segment of the original sequence and contains the mutation point. Specifically, the mutation sample contains 101 amino acids with 50 amino acids flanking either side of the mutation point. The mutation sample is illustrated in Figure 2. Since the mutation information needs to be represented, two sequences are generated: one to represent the protein sequence before mutation and one to represent the protein sequence after mutation.
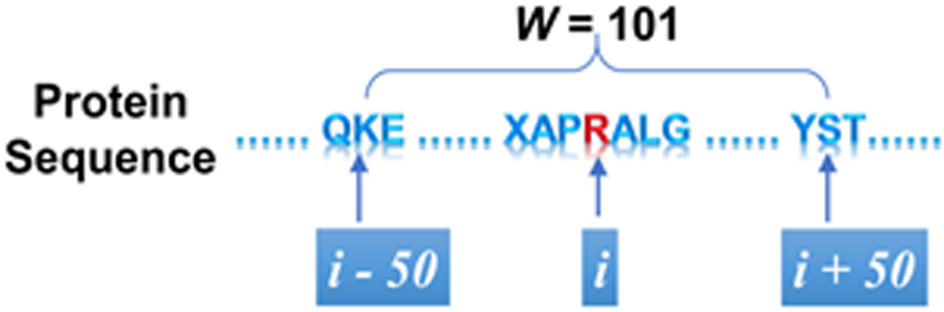
A mutation sample.
3.4. Features extraction and selection
Three sets of features are extracted from the mutation sample: wavelet-based features, AAIndex features, and PseAAC features. A feature selection approach is applied to each feature set to select the optimal subset of features.
3.4.1. Wavelet features
The amino acid mutation sample is represented by a numerical sequence according to the mapping scheme defined in Table 1. Wavelet analysis is then applied to generate the wavelets features (Meng et al., 2013). The Matlab wavelet toolbox was used to perform wavelet analysis, where a continuous wavelet transform based on Gaussian wavelets function is used to extract wavelet coefficients. The scales vector is set to values ranging from 1 to 101 with a step of 1. The obtained wavelet coefficients are a 101-by-101 matrix, where each row is a coefficient sequence at a specific scale. The wavelet power spectrum is calculated at each scale to obtain a 101-dimensional vector representing the wavelet features. Wavelet features are extracted for the mutation sample before and after mutation, resulting in a 202-dimensional features vector.
The table illustrates the numerical number representation used for each amino acid.
3.4.2. Amino acid index features
The AAIndex database is a collection of numerical indices representing different physicochemical and biochemical properties of amino acids and pairs of amino acids (Kawashima and Kanehisa, 2000). In this database, there are three sections, namely, AAindex1, AAindex2, and AAindex3. The AAindex1 is utilized in this work. The AAindex1 is a collection of 544 amino acid properties for each amino acid. Accordingly, each amino acid can be represented as a 544-dimensional (544-D) vector. Since a protein sequence consists of a different number of amino acids, one important task is to represent each sequence as a vector of the same dimension, which could be utilized in the later classification step. In order to achieve this goal, we adopt an average strategy. Formally, for an extracted mutation sample illustrated in Figure 2, let Sk represent the kth (1 ≤ k ≤ K; K represents the length of S, and K = 101 in this case) amino acid in S; let fi(A) represents the ith AAindex (1 ≤ i ≤ I, and I represents the total number of indices in the AAindex1 data set) for the amino acid A. The feature vector can be represented as follows:
where
In order to include the mutation information, the AAindex feature is extracted for the mutation sample for sequences before and after mutations. The final concatenated vector has a dimension of 1088. More details can be found in the work of Kawashima and Kanehisa (2000).
3.4.3. Pseudo amino acid composition features
In order to capture the sequence order information, the PseAAC, which was proposed initially for protein cellular attribute prediction (Chou, 2009), is utilized. The details of this approach can be found in the work of Chou (2009). Here, λ and ω were set to 10 and 0.05 in our experiment. The feature values extracted from the mutation sample before and after mutations are concatenated to a 60-dimensional vector, which is used as the feature representation.
3.4.4. Feature selection
After the three types of features are extracted, the total number of features reaches up to 1350 dimensions. Facing a relatively large feature set, an important question is how to select a subset of features that best capture most of the discriminative capabilities. In this work, the selected feature set is determined using an empirical study. The whole process is illustrated in Figure 3. First, the chi-square feature selection approach implemented in Weka data mining software package (Hall et al., 2009) was utilized to sort all the features according to their correlations with class label in a descending order. In this way, all the features are put in a ranked list. Second, the top-ranked feature from this list is added to the selected feature set that is then plugged into the classification module. The evaluation results for the current selected feature set are stored. After that, other features in the list are added to the selected feature set sequentially and the aforementioned classification and evaluation steps are repeated. The overall process terminates after all the features in the list are added in the selected feature set. After this process, the final selected feature set is determined by choosing the one that gives the best performance.
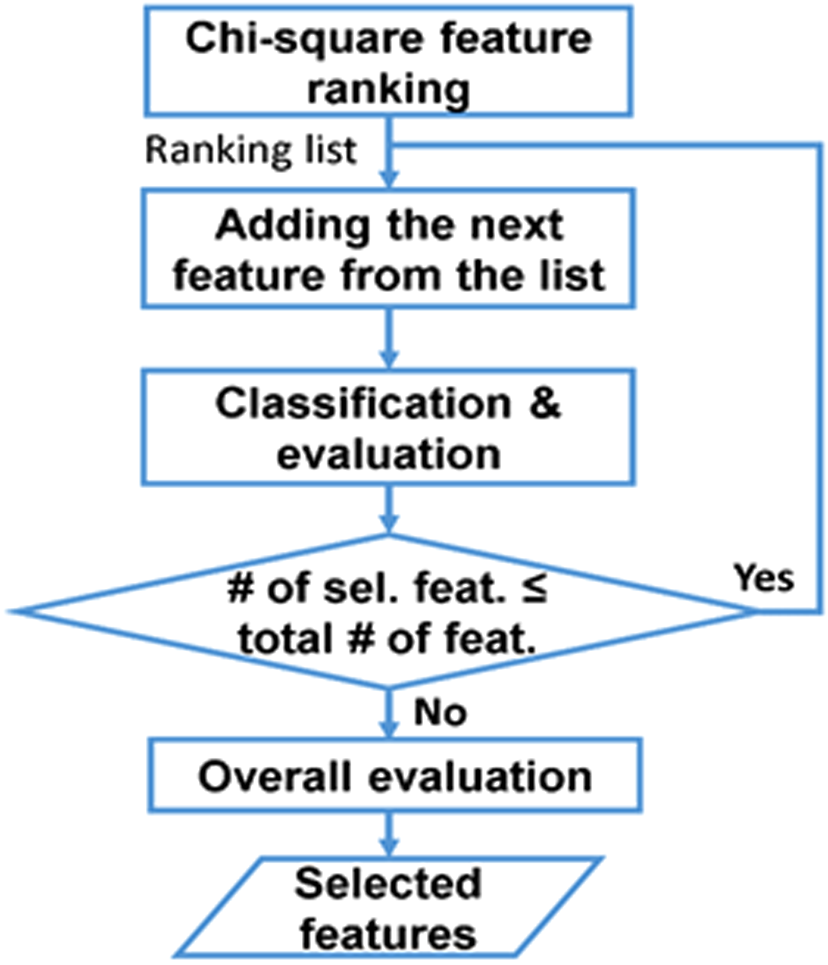
Feature selection process flow chart.
Figure 4 illustrates the results of the three evaluation criterion: F1, accuracy, and Matthew's correlation coefficient (MCC). The horizontal axis indicates the number of features in each iteration step and the vertical axis indicates the performance values. The three curves corresponding to F1, accuracy, and MCC are computed by averaging the results of three-fold cross validation. As shown in this figure, the three curves demonstrate a similar trend. The number of features corresponding to the maximal value of MCC, which is an unbiased evaluation criterion for both driver and passenger mutations, is retained to input into the classification model.
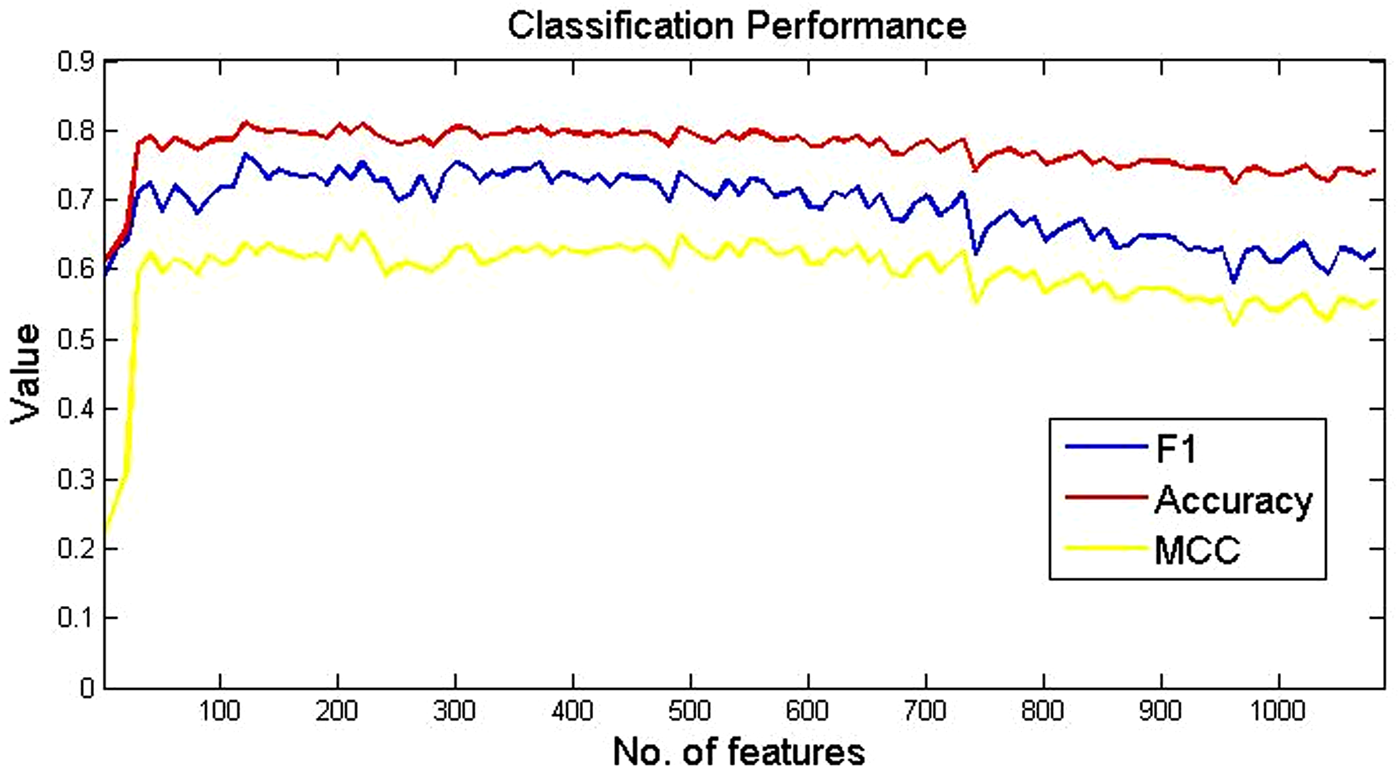
Empirical study of classification performance with feature selection.
3.5. Classification and model fusion
The three feature vectors generated by the feature extraction and selection stage are passed through a classification and model fusion stage to label the mutation sample as a driver or passenger. The classification and model fusion stage consists of two units: the classification unit and the model fusion unit.
3.5.1. Support vector machine-based classifiers
Three classifiers are employed in this framework: one classifier for wavelet-based features, one classifier for AAIndex-based features, and one for PseAAC-based features. Each features vector, generated by the feature extraction and selection stage, is passed to its corresponding classifier. Each classifier outputs a score to be processed by the model fusion unit. The SVM-based classifier utilizes the LIBSVM library proposed by Chang and Lin (2011). All classifiers use the radial basis function kernel, also known as the Gaussian kernel, and it is defined as follows:
Each SVM classifier can be tuned using two parameters, C and γ. Tuning the classifier to the proper parameter values is critical to the performance of the classifier as illustrated in the experiments section.
3.5.2. Model fusion
The general purpose of this module is to integrate the outputs from classification models built on each individual type of feature and has been proven to be effective in improving the accuracy of classification models in bioinformatics and has received increasing attention in recent studies (Meng et al., 2011; Re, 2011). Inspired by the recent progress in the late fusion models utilized in the multimedia domain (Meng and Shyu, 2014), a logistic regression-based fusion model is utilized to integrate output scores. This model is illustrated in Figure 5. In this figure, Rw, Ra, and Rp represent scores output from the classification models built on wavelet features, AAindex features, and PseAAC features, respectively; “1” indicates the bias unit. The central question becomes how to build a logistic regression model to serve the purpose of score integration. Here, we formulate this problem as an optimization problem. Assume that, for one training data instance b (1 ≤ b ≤ B; B is the total number of training instances), the scores output from the three classification models are
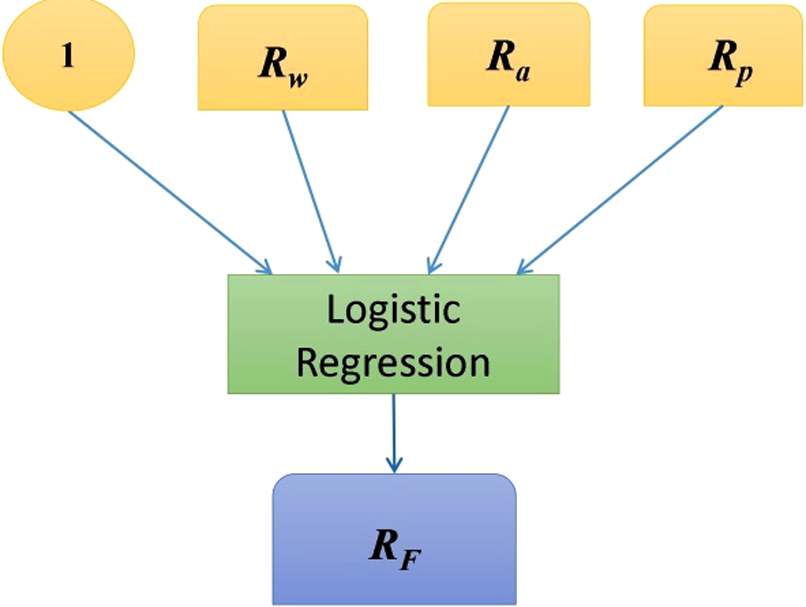
Model fusion of different SVM-based classifiers output scores.
A corresponding parameter
where
Using the likelihood defined above, a cost function using the log likelihood can be defined as follows:
Here, β is the scalar that serves as the regularization parameter. ‖
3.6. Performance evaluation metrics
Three performance metrics are calculated in our experiments to evaluate the framework prediction performance. They are accuracy, F1, and MCC. They are defined as follows:
Where TP, TN, FP, and FN represent the numbers of true-positive instances, true-negative instances, false-positive instances, and false-negative instances, respectively. It is worth noting that MCC ranges from −1 to 1, where 1 indicates the best possible prediction, −1 indicates the worst possible prediction, and 0 indicates a possible random prediction. The proposed framework performance is assessed and compared with the performance of CHASM technique using the above-mentioned performance metrics.
4. Experimental Results
Three sets of experiments are conducted to identify the optimal features subsets, tune the SVM-based classifiers parameters, and evaluate the performance of the proposed framework. In the first set of experiments, we applied the proposed features selection approach to identify the optimal subset of features for each group of features. Three experiments were carried out: one for wavelet features, one for AAIndex features, and one for PseAAC features. The results obtained from these feature selection experiments are summarized in Table 2.
The table illustrates the Wavelet, AAIndex, and PseAAC extracted feature vector sizes and their final feature vector sizes after applying the proposed feature selection approach.
The results show that all extracted PseAAC features are important for the classification performance as all of the PseAAC features were selected, resulting in a PseAAC features vector of size 60. AAIndex and wavelet features showed different results, whereby 91 and 10 features were selected from the AAIndex and wavelet features, respectively, with the percentage of selected to extracted features indicated in Table 2. Applying the feature selection approach results in about 90–95% reduction in the dimensions for wavelet and AAIndex features and also enhances the performance of the overall system.
In the second set of experiments, the effect of the two SVM-based classifiers, parameters C and γ, on the classification performance using a grid search approach was examined. In this set of experiments, 10-fold cross validation was used while varying SVM parameters C and γ for different values from 1 to 16, and from 0.0625 to 1, respectively. The performance of the framework, in terms of accuracy, F1, and MCC, is calculated for different combinations of C and γ shown in Figure 6. As can be observed from the three charts, the two parameters, accuracy and F1, affect the classification accuracy to a relatively large degree. Therefore, it is necessary to have a parameter tuning process in the training phase of the framework. The SVM parameter values selected for the three features in the proposed framework are summarized in Table 3.

Accuracy, F1, and Matthews correlation coefficient (MCC) at different C and γ.
Shown are the tuned SVM parameters (C, γ) for each classifier.
In order to fully evaluate this proposed framework, we directly compared it with CHASM. A 10-fold cross-validation approach was applied and the same set of data was plugged into the proposed framework and CHASM to eliminate the effect of randomness in data partitioning. Table 4 summarizes the average accuracy, F1, and MCC for the 10-fold results obtained from the proposed framework and CHASM, respectively. From Table 4, it is observed that the proposed framework achieves a relative improvement of 9.25%, 9.89%, and 23.28% in terms of accuracy, F1, and MCC. Furthermore, it is important to point out that the CHASM software package relies on a preinstalled database that requires up to 60 GB disk space on a machine. In this proposed framework there is no need for setting up any database since the sequences of interest can be downloaded on the fly and directly analyzed. As a result, our proposed framework also decreases electronic storage space requirements.
The table illustrates the performance of the proposed framework in comparison to the CHASM framework. The performance is measured in terms of accuracy, F1 score, and Matthews correlation coefficient (MCC).
5. Conclusions
As the cost of sequencing the genome decreases, increasing amounts of DNA sequence data are becoming available. Large-scale cancer genomic sequencing studies identify multiple potential driver mutations in cancer. Although experimental functional analysis is the gold standard for identifying driver mutations, this approach takes a substantial amount of time and labor. In this article, a novel computational framework to automatically predict driver missense mutations from a list of a large set of mutations is proposed to help researchers and clinical doctors prioritize evaluating and testing putative driver mutations. The proposed framework utilizes a novel combination of three features sets. It consists of three stages: data collection and mutation sample extraction, features extraction and selection, and classification and model fusion. In the first stage, the protein sequence is collected and the mutation sample is extracted from each protein sequence using a window strategy. In the second stage, wavelet analysis-based features, AAIndex features, and PseAAC features are extracted from mutation samples. Next, features selection approach is applied on the three types of features separately to identify the optimal subset of features within each set. In the last stage, the selected features are utilized to train three SVM-based classifiers. A logistic regression-based multimodel fusion approach is then applied on outputs from the aforementioned three classifiers to give the final prediction. Experimental results indicate that the proposed framework outperforms current state-of-the-art approaches.
Footnotes
Acknowledgment
The authors wish to thank Yimin Yang from Florida International University for her help to collect and process data.
Author Disclosure Statement
The authors declare that no competing financial interests exist.