




Abstract
Abstract
One of the major challenges for protein–protein docking methods is to accurately discriminate nativelike structures. The protein docking community agrees on the existence of a relationship between various favorable intermolecular interactions (e.g. Van der Waals, electrostatic, desolvation forces, etc.) and the similarity of a conformation to its native structure. Different docking algorithms often formulate this relationship as a weighted sum of selected terms and calibrate their weights against specific training data to evaluate and rank candidate structures. However, the exact form of this relationship is unknown and the accuracy of such methods is impaired by the pervasiveness of false positives. Unlike the conventional scoring functions, we propose a novel machine learning approach that not only ranks the candidate structures relative to each other but also indicates how similar each candidate is to the native conformation. We trained the AccuRMSD neural network with an extensive dataset using the back-propagation learning algorithm. Our method achieved predicting RMSDs of unbound docked complexes with 0.4Å error margin.
1. Introduction
P
Protein–protein docking methods aim to compute the correct bound form of two or more proteins, usually starting with the atomic coordinate information only. This is a difficult problem because for each protein, there are three translational and three rotational degrees of freedom; yielding many possible spatial arrangements for two bodies with respect to each other. Depending on the size of the components, the search space can grow exponentially (Cherfils and Janin, 1993; Moreira et al., 2010). The complexity of the problem further increases when molecular flexibility is also considered. Therefore, the docking methods not only need to employ search algorithms to effectively cover the conformational space, but they should also be able to accurately discriminate nativelike structures from the rest.
In order to achieve this, docking algorithms utilize a wide variety of scoring functions, which are designed to favor conformations with low binding energy, good geometric fit, more evolutionarily conserved interface residues, etc. Top-ranking conformations based on such scoring functions are hoped to be the most similar to the native conformation. Indeed, some docking algorithms are able to rank a few near-native conformations among their top solution candidates (Janin, 2010). Yet, most of the highest rank candidates are often false positives (Halperin et al., 2002; Janin, 2010). In other words, the ranking and root mean square deviation (RMSD) of candidates compared to the native structures are usually not highly correlated. Pervasiveness of false positives in ranking makes it extremely difficult to accurately identify nativelike structures. Furthermore, even the most accurate scoring functions cannot estimate the RMSD of a docked structure with respect to its native conformation as they are geared toward relative ranking of a set of docked structures.
The protein docking community seems to agree on the existence of a relationship between various scoring terms (e.g., Van der Waals, electrostatic, desolvation forces, etc.) and the similarity of a conformation to its native structure. However, the exact form of this relationship is unknown. Therefore, docking algorithms often formulate this relationship as a weighted sum of selected terms and calibrate their weights against specific training data (Kastritis and Bonvin, 2010; Moal et al., 2013). Yet, the widespread inaccuracy of rankings may suggest that the relationship between these terms and RMSD of a conformation may indeed be much more complex.
Complex function approximation is one of the typical uses of neural networks in the artificial intelligence field. Numerous applications of multilayer neural networks can be found in the fields of signal processing, pattern recognition, and computer vision to estimate the relationship between a set of input and output variables. Learning algorithms are methods for estimating parameters in a neural network from a training dataset. The backpropagation learning algorithm (Mehrotra et al., 1997; Rumelhard et al, 1986; Werbos, 1990) was the first successful approach to the training of multilayer networks with continuous input and output, and it is still the most widely used neural network learning algorithm today.
In this article, inspired by machine learning techniques, we propose a different approach to formulating the relationship between a wide set of scoring function terms and RMSD of a docked structure. We show that a properly trained backpropagation neural network can be used to approximate this complex function and to accurately predict RMSDs of docked structures. As opposed to the conventional scoring functions, the proposed tool not only ranks the decoys relative to each other but also indicates how similar each decoy is to the native conformation.
In the initial version of this study (Akbal-Delibas et al., 2014), we tested the proposed tool on an extensive set of perturbed structures (created by random perturbation of native protein conformations) and refinement candidates generated from coarsely docked input structures. The results encouraged us to train and test AccuRMSD with unbound complexes as reported in this extended version.
2. Scoring Functions for Protein–Protein Docking
Over the last 20 years several scoring functions have been developed for ranking putative docked complexes. Traditionally, docking algorithms used geometric criteria to distinguish nativelike complexes from false positives. More recent methods realize the need to include physical and chemical interactions as well (Halperin et al., 2002). Several recent scoring functions such as Haddock (Dominguez et al., 2003), pyDock (Cheng et al., 2007), ZRank (Pierce and Weng, 2007), ClusPro (Comeau et al., 2004) and RosettaDock (Lyskov and Gray, 2008) use physical energy terms. They employ a combination of Van der Waals (VdW) energy, electrostatic interactions, and desolvation terms. The combination and weighing of the terms is what differentiates these methods from one another. Some methods like Attract (Vries and Zacharias, 2013) use VdW and electrostatic energy calculated on a coarse grained modeling of the protein to save computational time. While it is known that proteins often change their conformations upon binding, modeling flexibility is a challenging problem due to the additional computational cost to an already difficult problem. Recent methods incorporate limited flexibility. Examples include SwarmDock, which uses normal mode analysis (Li et al., 2010), and Firedock (Mashiach et al., 2008), which uses side-chain flexible refinement combined with soft rigid-body optimization and partial electrostatic interaction energy. A recent docking refinement method (Akbal-Delibas et al., 2012; Akbal-Delibas and Haspel, 2013) uses a scoring function that includes an evolutionary traces (ET) term (Wilkins et al., 2012; Mihalek et al., 2006), in addition to the VdW and electrostatic component. The assumption is that binding interfaces tend to be evolutionarily conserved due to their importance.
Despite recent development in scoring functions for protein docking, they are still lacking when it comes to predicting the correct binding conformation. A recent large-scale benchmarking of many current docking methods revealed that most current physics-based scoring functions still fail to accurately predict the binding affinity of complexes (Kastritis and Bonvin, 2010). Therefore, more work is needed to improve the existing scoring functions or design new methods.
3. Methods
In order to predict the RMSD of a docked protein structure with respect to its native conformation, we devised a backpropagation neural network. Backpropagation networks typically consist of three layers of artificial neurons. The input layer holds the input to the network and sends it to the hidden layer. Each hidden-layer neuron receives input from all input neurons, computes their weighted sum, applies a sigmoid function to it, and sends the resulting output to the output layer. The same type of computation is performed at the output layer, with the results constituting the output of the network. Learning is achieved in a supervised manner by picking a random input from the training set, computing the network's output for it, and comparing it with the desired output for the given training sample. The backpropagation algorithm uses a variant of high-dimensional gradient descent to modify the weights in the hidden and output layers in such a way that the same input will produce an output closer to the desired one. In a training epoch, each training sample is picked exactly once in random order, followed by weight adjustment through backpropagation. Multiple epochs are run until the network error falls below a certain threshold or no further improvement can be reached. In the remainder of this section, we first describe the selected network features, then explain how the AccuRMSD neural network is set up and trained with an extensive dataset.
3.1. Feature selection
We built an artificial neural network to approximate the relationship between 11 different features, most of which are used as scoring function terms by a wide variety of docking and refinement algorithms (Dominguez et al., 2003; Cheng et al., 2007; Pierce and Weng, 2007; Comeau et al., 2004; Lyskov and Gray, 2008; Akbal-Delibas et al., 2012; Akbal-Delibas and Haspel, 2013; Lopes et al., 2013). Below is a description of features we selected.
•
•
where qi and qj are the electrostatic charges of atoms i and j taken from AMBER force field (Cornell et al., 1995), e is the dielectric constant (vacuum constant 1 is used), and rij is the distance between the ij atom pair. The total value is converted from Coulomb to kcal/mol by multiplying with 332.
•
where ci is the ET coverage value of the residue that the interface atom i belongs; ci ranges between 0 and 1, where lower values imply higher evolutionary importance. It is taken from the coverage column of the corresponding ET file, produced by a sequence analysis on homologous proteins (Wilkins et al., 2012). Variable k is −1 if ci is less than the threshold defined as below; otherwise it is 1.
where μ and σ are the mean and standard deviation of ET coverage values in the chain, respectively; ci is multiplied with this constant to avoid bias toward conformations with smaller interfaces.
•
•
•
•
•
•
•
•
3.2. AccuRMSD neural network
We trained an artificial neural network using the backpropagation learning algorithm to predict the RMSD value of a given structure based on its values of the 11 selected features. These features were used as inputs to the network. Since backpropagation networks process continuous inputs and outputs ranging between 0 and 1, the values for each feature were scaled linearly to fall into this range. The protein category feature was treated differently because its two feature values do not represent a scale. Two inputs were used to represent this feature, each of which corresponded to one of the categories. For a given category, the corresponding input was set to 1, and the other input was set to 0. Therefore, the network received 10 inputs representing the continuous features and 2 inputs for the categorical feature for a total of 12 inputs, requiring the same number of input neurons. Through experimentation it was found that using 25 hidden-layer neurons led to the best results. The output layer consisted of only a single neuron, whose output, after appropriate linear scaling, represented the predicted RMSD value. In this scaling scheme, an output of 0.01 corresponds to the minimum RMSD value in the training data and 0.99 corresponds to the maximum one. It should also be noted that each hidden and output-layer neuron received an additional input that was constantly set to 1, enabling offset adjustment through the corresponding weight. Running 5000 epochs yielded the smallest network error.
3.3. Training data
In our previous work (Akbal-Delibas et al., 2014), we trained the network with 40,000 samples generated by perturbing native conformations of 20 randomly selected proteins: 1ACB, 1BDJ, 1C1Y, 1CGI, 1CSE, 1DFJ, 1DS6, 1FSS, 1G4U, 1OHZ, 1SQ2, 1TX4, 1WQ1, 2RIV, 2SNI, 2V4Z, 2ZFD, 3LS5, 3LXR, and 3M18. We selected these proteins from two previously published works (Kanamori et al., 2007; Gray et al., 2003) and extended the dataset by an RCSB Protein Data Bank search with the objectives that are explained in Akbal-Delibas et al. (2015). For each protein, we created 2,000 samples by applying a random number (i.e., 1 to 15) of rigid-body rotations to the native conformation around arbitrary axes. Angles and axes of rotations are also chosen randomly as explained in Akbal-Delibas et al. (2012). After creating 2,000 samples for each protein, we analyzed their interfaces and calculated the values of the network features. Figure 1a depicts the RMSD distribution of 40,000 samples in the perturbed training dataset. It is worth noting that we used a slightly different feature set and network specification in the previous work (Akbal-Delibas et al., 2014) than what we describe here.
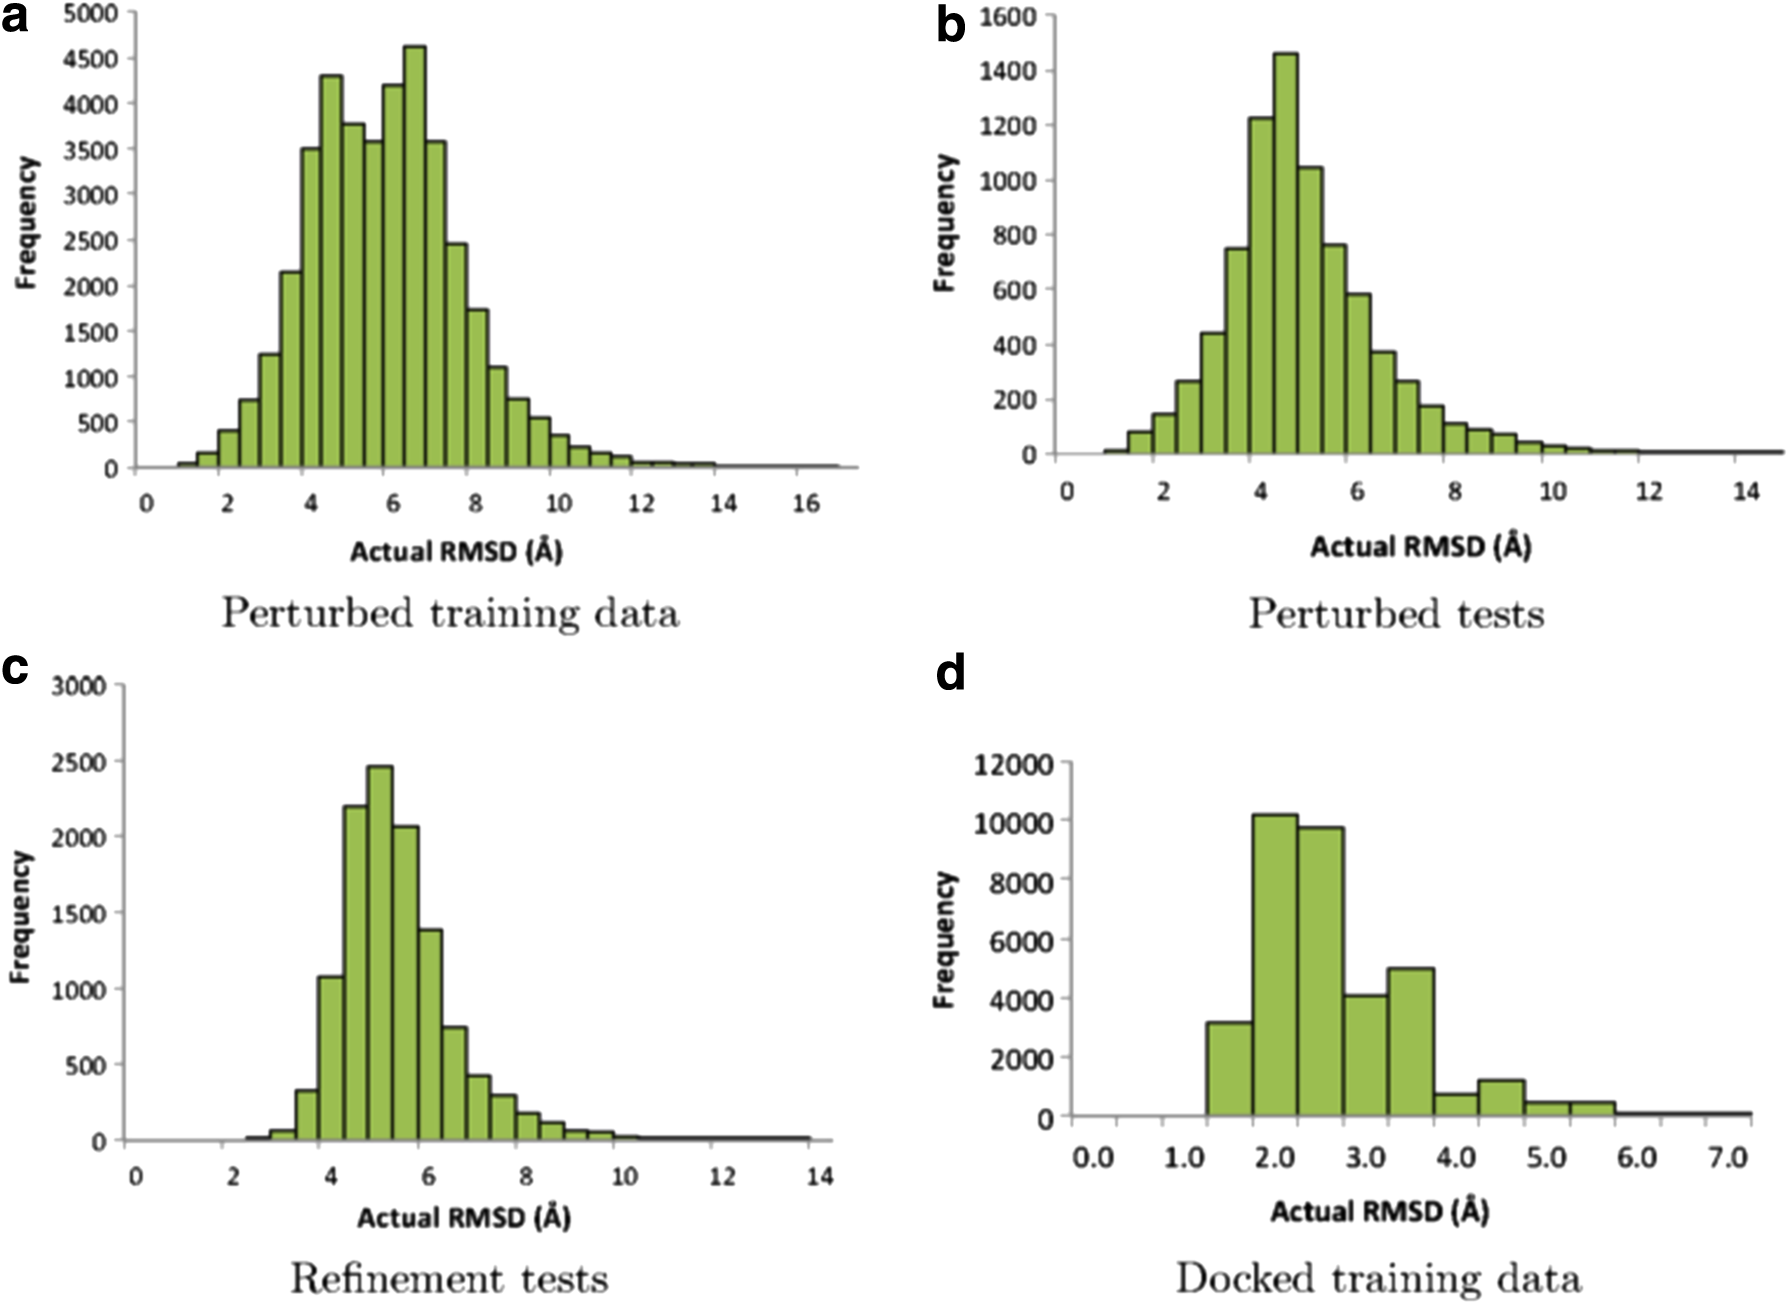
RMSD distribution of the training and test datasets. RMSD is against the native PDB structure. RMSD, root mean square deviation.
In this work, to test AccuRMSD's prediction accuracy on unbound docked structures, we trained the neural network with an extensive dataset, composed of 35,000 samples of 35 dimer proteins listed in the Protein–Protein Docking Benchmark 4.0 (Hwang et al., 2010): 1B6C, 1EFN, 1EWY, 1FFW, 1CL1, 1GLA, 1GPW, 1GXD, 1H9D, 1US7, 1J2J, 1JTG, 1OC0, 1OYV, 1PVH, 1S1Q, 1T6B, 1XD3, 1YVB, 1Z0K, 1Z5Y, 1ZHH, 1ZHI, 2AST, 2AJF, 2B42, 2FJU, 2HLE, 2HQS, 2J0T, 2O8V, 2OOB, 2VDB, 3DSS, and 4CPA. We focused on the dimers from the rigid-body category in this benchmark, and among those we selected the proteins for which the corresponding evolutionary trace files existed in the ET server (Mihalek et al., 2006). For each protein, we created 1,000 docked structures by feeding unbound ligands and receptors to RosettaDock (Lyskov and Gray, 2008). The RMSD distribution of the samples in the docked dataset is shown in Figure 1d. We then analyzed interfaces of each structure and calculated the values of the network features.
4. Results
4.1. Experimental setup
In this section, we discuss the prediction accuracy of AccuRMSD by comparing predicted and actual RMSDs of 54,600 test samples. We grouped these test samples into three major classes based on how the corresponding protein structures were created:
• • •
Perturbed and refinement candidate tests were conducted after training the AccuRMSD neural network with the perturbed training dataset. On the other hand, the unbound docked structure tests were performed as a cross-validation of the newly proposed docked training dataset. Below, we describe the details of the experiments with both training datasets.
4.2. Experiments with the perturbed training dataset
First, we generated 400 test samples for each of the 20 proteins shown in Table 1 based on the Protein–Protein Docking Benchmark 4.0 (Hwang et al., 2010) by applying random rigid-body transformations to the native protein structure. Our motivation for testing with an extensive set of perturbed structures was to provide initial validation of the learning capability of the AccuRMSD neural network. As the perturbed tests and the training data were generated in a similar manner, a high correlation between predicted and actual RMSD values as well as a reasonably low error would prove that the AccuRMSD network is set up properly to learn the training data.
The RMSD range of the perturbed tests is shown in Figure 1b. As seen, the distribution is comparable to the perturbed training dataset. To measure the difference between the predicted and actual RMSDs, we calculated the root mean square error of the prediction, which we refer to as error in the rest of this article. For the 8,000 perturbed tests, the error was 0.59Å while the correlation coefficient between predicted and actual RMSDs was 0.93. Figure 2a displays the distribution of perturbed tests with respect to actual and predicted RMSD values. Table 1 presents a summary of correlation coefficients and errors for each of the 20 different test cases.
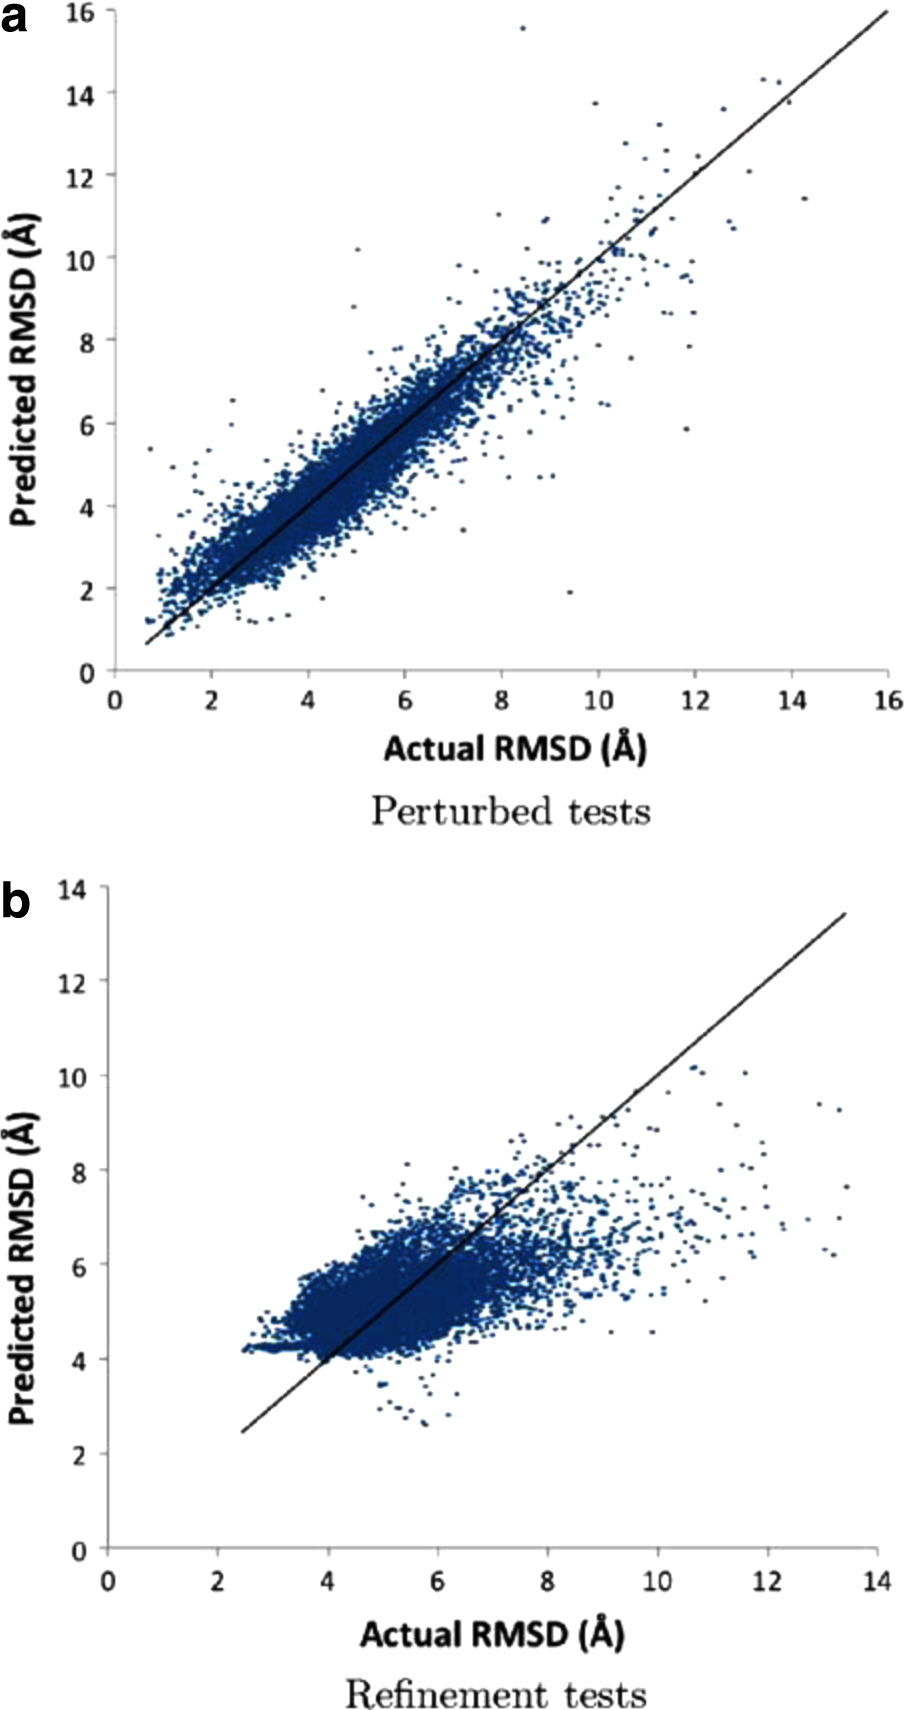
Predicted vs. actual RMSD values of
After gaining confidence in the network's learning capability, we assessed the prediction accuracy of AccuRMSD on real refinement candidates created from coarsely docked protein complexes. We generated refinement candidates from 29 different docked complexes (400 test samples for each) by applying small rigid body rotations to each putative docked complex. The test cases are shown in Table 2. Putative docked complexes are generated from three different docking tools: ClusPro (Comeau et al., 2004), pyDock (Cheng et al., 2007), and HopDock (Hashmi and Shehu, 2013). The RMSD distribution for these complexes is shown in Figure 1c. Figure 2b depicts how predicted and actual RMSD values compare for 11,600 refinement candidates. The overall error was 0.92Å while the correlation coefficient between predicted and actual RMSDs was 0.65. Table 2 lists the correlation and error values for each test case.
Three observations about the refinement candidate tests are worth noting. First, while the overall correlation coefficients for ClusPro, pyDock, and HopDock test cases were comparable (0.65, 0.61, and 0.68, respectively), the overall error for the ClusPro test cases was relatively higher. Among the ClusPro test cases, 1BDJ, 1CSE, 1G4U, and 1OHZ are notable due to their relatively higher error values. Further exploration of these cases revealed significantly higher number of test samples with near-empty interfaces (i.e., less than 50 atoms). Removing such samples makes the overall error of ClusPro test cases comparable to the overall error of pyDock and HopDock. Second, the prediction accuracy of refinement candidates generated from different docked solutions of the same protein, like 1ACB and 1CSE, may vary a lot. For instance, while the error for pyDock 1ACB test case was 0.38Å, it jumped to 0.92Å in the ClusPro solution. On the other hand, three different 1C1Y test cases resulted in similar prediction error (0.94Å for ClusPro, 0.96Å for pyDock, and 0.71Å for HopDock). Finally, although the overall prediction error for the refinement candidates (0.92Å) was very favorable, it was not as low as the error for the perturbed structures (0.59Å). This is expected because the perturbed training data and the perturbed test set were created from the native conformations, whereas the refinement candidates were generated using coarsely docked structures. We plan to further improve the prediction accuracy for refinement candidates by creating a new training dataset from coarsely docked structures.
4.3. Experiments with the docked training dataset
An important distinction of this extended article compared to the initial version (Akbal-Delibas et al., 2014) is its focus on predicting RMSD values of complexes created by unbound docking. Therefore, we developed a new training dataset by evaluating 35,000 conformations generated by RosettaDock for 35 different proteins via unbound docking. Below, we discuss the prediction accuracy of AccuRMSD on these 35,000 samples. We also present a comparison of AccuRMSD and RosettaDock's internal scoring function based on how accurately each ranks 1000 docked conformations produced by RosettaDock.
We conducted a 35-fold cross-validation to test how well the RMSD values of conformations for a given protein can be predicted by the data from all 34 other proteins. Figure 3 displays the distribution of samples with respect to actual and predicted RMSD values. Table 3 zooms into this data and presents a summary of correlation coefficients and errors for each of the 35 proteins. The overall error between predicted and actual RMSD values was only 0.4Å. Moreover, prediction errors for individual proteins were highly favorable too. For all proteins other than 1FFW and 3DSS, AccuRMSD was able to predict the RMSD values of 1000 conformations with an error margin less than 0.69Å. The correlation coefficient between predicted and actual RMSDs was 0.88. However, it is worth noting that correlation coefficients between predicted and actual RMSDs were relatively variable. For several proteins—like 1Z5Y, 1OYV, and 2VDB—predicted and actual RMSDs showed high positive correlation (e.g., the coefficient was above 0.70). On the other hand, there were also proteins, like 1B6C, 1FFW, and 1OC0, for which correlation coefficients were low or even negative.
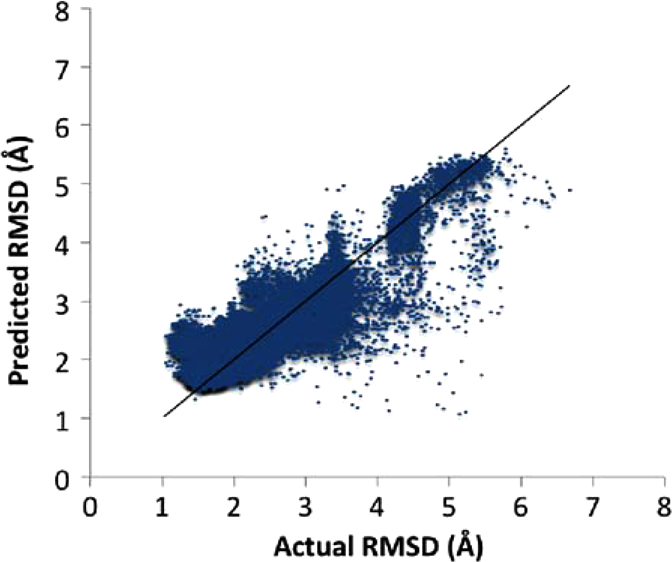
Predicted vs. actual RMSD values of 35,000 unbound docked protein samples. The diagonal line represents the perfect prediction.
After assessing AccuRMSD's prediction accuracy on extensive sets of 35,000 docked structures produced by RosettaDock, we also analyzed the relative ranking capability of AccuRMSD by comparing it to RosettaDock's own ranking tool (i.e., scoring function). In order to objectively compare the ranking accuracy of the two methods, for each protein, we (i) ranked all 1,000 docked solutions based on their actual RMSD values and identified each solution's real rank; (ii) ranked all solutions based on the total score calculated by RosettaDock and determined each solution's RosettaDock rank; (iii) ranked all solutions based on AccuRMSD's predicted RMSD values and found each solution's AccuRMSD rank; and finally (iv) calculated the root mean square error between each methods' ranking of 1,000 solutions and their real ranks. Table 4 presents results of this analysis. It is worth noting that AccuRMSD's ranking outperformed RosettaDock's scoring function in 28 out of 35 cases. Indeed for 13 proteins, AccuRMSD's ranking errors were at least 25% less compared to RosettaDock's.
For each protein, ranking error is calculated as root mean squared error between real ranks of 1000 conformations (based on actual RMSD values) and ranks suggested each tool. For 28 proteins (out of 35) AccuRMSD outperformed RosettaDock's own scoring function.
5. Discussion
We presented AccuRMSD, a novel ranking method to accurately discriminate nativelike structures during protein–protein docking and refinement. Using a backpropagation neural network, AccuRMSD approximates the nonlinear relationship between a large set of features used by different scoring functions and a structure's similarity to its native conformation. Unlike the traditional scoring functions, AccuRMSD not only ranks a set of structures relative to each other but also estimates their RMSDs with respect to the native structure with a 0.4Å error margin even on a set of unbound docking candidates.
Future directions for this study are fourfold. First, we would like to expand the RMSD distribution of the training data by adding more samples with higher RMSD values in order to increase the prediction accuracy of the network for relatively poorly docked conformations. Second, we plan to test AccuRMSD with docked structures produced by other docking tools in addition to RosettaDock. Third, we plan to evaluate AccuRMSD's prediction accuracy on proteins under the medium and difficult categories of the Protein–Protein Docking Benchmark 4.0 (Hwang et al., 2010), as well as multimers. Finally, we will use AccuRMSD as the ranking tool in a new method we will propose for refining coarsely docked protein complexes.
Footnotes
Acknowledgments
The research is funded in part by NSF grant AF-1116060 (NH).
Author Disclosure Statement
The authors declare that no competing financial interests exist.