
Abstract
Abstract
1. Introduction
T
Many computational tools have been developed to study these problems because they are either too difficult or too expensive to tackle experimentally. Protein structure prediction (Sternberg, 1996) is a widely studied area. One notable method is Rosetta (Rohl et al., 2004), which uses a simplified model to predict the low-resolution protein structure. In response to increased research in protein structure prediction, the
Decoy databases have been developed to test and verify these scoring functions (Samudrala and Levitt, 2008). A decoy is a computer-generated protein structure that is similar to the native structure. Decoys test the ability of a scoring function to identify the protein's native structure from a set of incorrect protein structures. If the scoring function can correctly identify the native structure, the function is said to be correct. Such tests where decoys attempt to “fool” the scoring function are commonly used to test protein folding algorithms. Thus, if we can create higher quality decoy databases, we can improve protein folding algorithms by improving the scoring functions on which they rely.
Many large decoy databases for specific proteins have already been compiled for the purpose of testing and improving scoring functions (Samudrala and Levitt, 2008; Moult et al., 1995; Tsai et al., 2003). However, there is not currently a good way to take these existing databases and improve them so that they are more effective at testing modern scoring functions. Here, we strive to generate higher quality decoy sets in order to more rigorously test these functions.
• We test on 20 different decoy databases and show that we are able to generate higher quality decoy databases across a variety of metrics. • We find that most improvement stems from the addition of structures by our sampling methods. • We test our improved databases on two popular modern scoring functions, QMEAN (Benkert et al., 2008) and RWplus potential (Zhang and Zhang, 2010), and show that for most cases they contain a greater or equal number of structures ranked more native-like than the actual native state than the original databases.
2. Related Work
In this section we discuss related work in the areas of protein models, scoring functions, and existing decoy databases. We also discuss existing methods for sampling conformations as we will use these to add conformations to existing decoy sets.
2.1. Protein models
A protein is composed of a chain of amino acids that determine its function. Amino acids are distinguished by their side chain. When hydrogen bonds form between atoms on the protein backbone, secondary structures can develop; α helices and β sheets make up the majority of secondary structures.
The most accurate protein model is the all-atoms model. However, in many cases the all-atoms model is too computationally expensive, particularly for larger proteins. Therefore, some coarse-grained models (Rader and Bahar, 2004; Amato and Song, 2002; Go, 1983) have been developed to ease the computational complexity by ignoring some detail information. For example, the Gaussian Network Model (GNM) (Rader and Bahar, 2004) models amino acids as beads connected by elastic strings. Lattice models (Go, 1983) constrain the protein as a rigid lattice and each amino acid is represented as a bead on the lattice.
Another coarser-grained approach models a protein as a series of φ and ψ torsional angles. All other bond angles and all bond lengths remain fixed. This is a common modeling assumption as bond lengths and angles typically only undergo small fluctuations (Sternberg, 1996). In this φ−ψ model, a protein conformation with n amino acids has 2n degrees of freedom. Side chains are modeled as spheres with zero degrees of freedom located at the Cβ position. This model has been successfully used to simulate the correct order of large folding events for several small proteins (Amato and Song, 2002).
Regardless of the model, a protein's potential energy landscape is defined as the set of all conformations and their associated potential energies. Figure 1 shows a theoretical energy landscape where all possible conformations are represented by the x−y plane. The native structure of a protein is thought to be located at the lowest point on a funnel-shaped landscape. The landscape may contain several local minima that are distinct from the native energy basin.
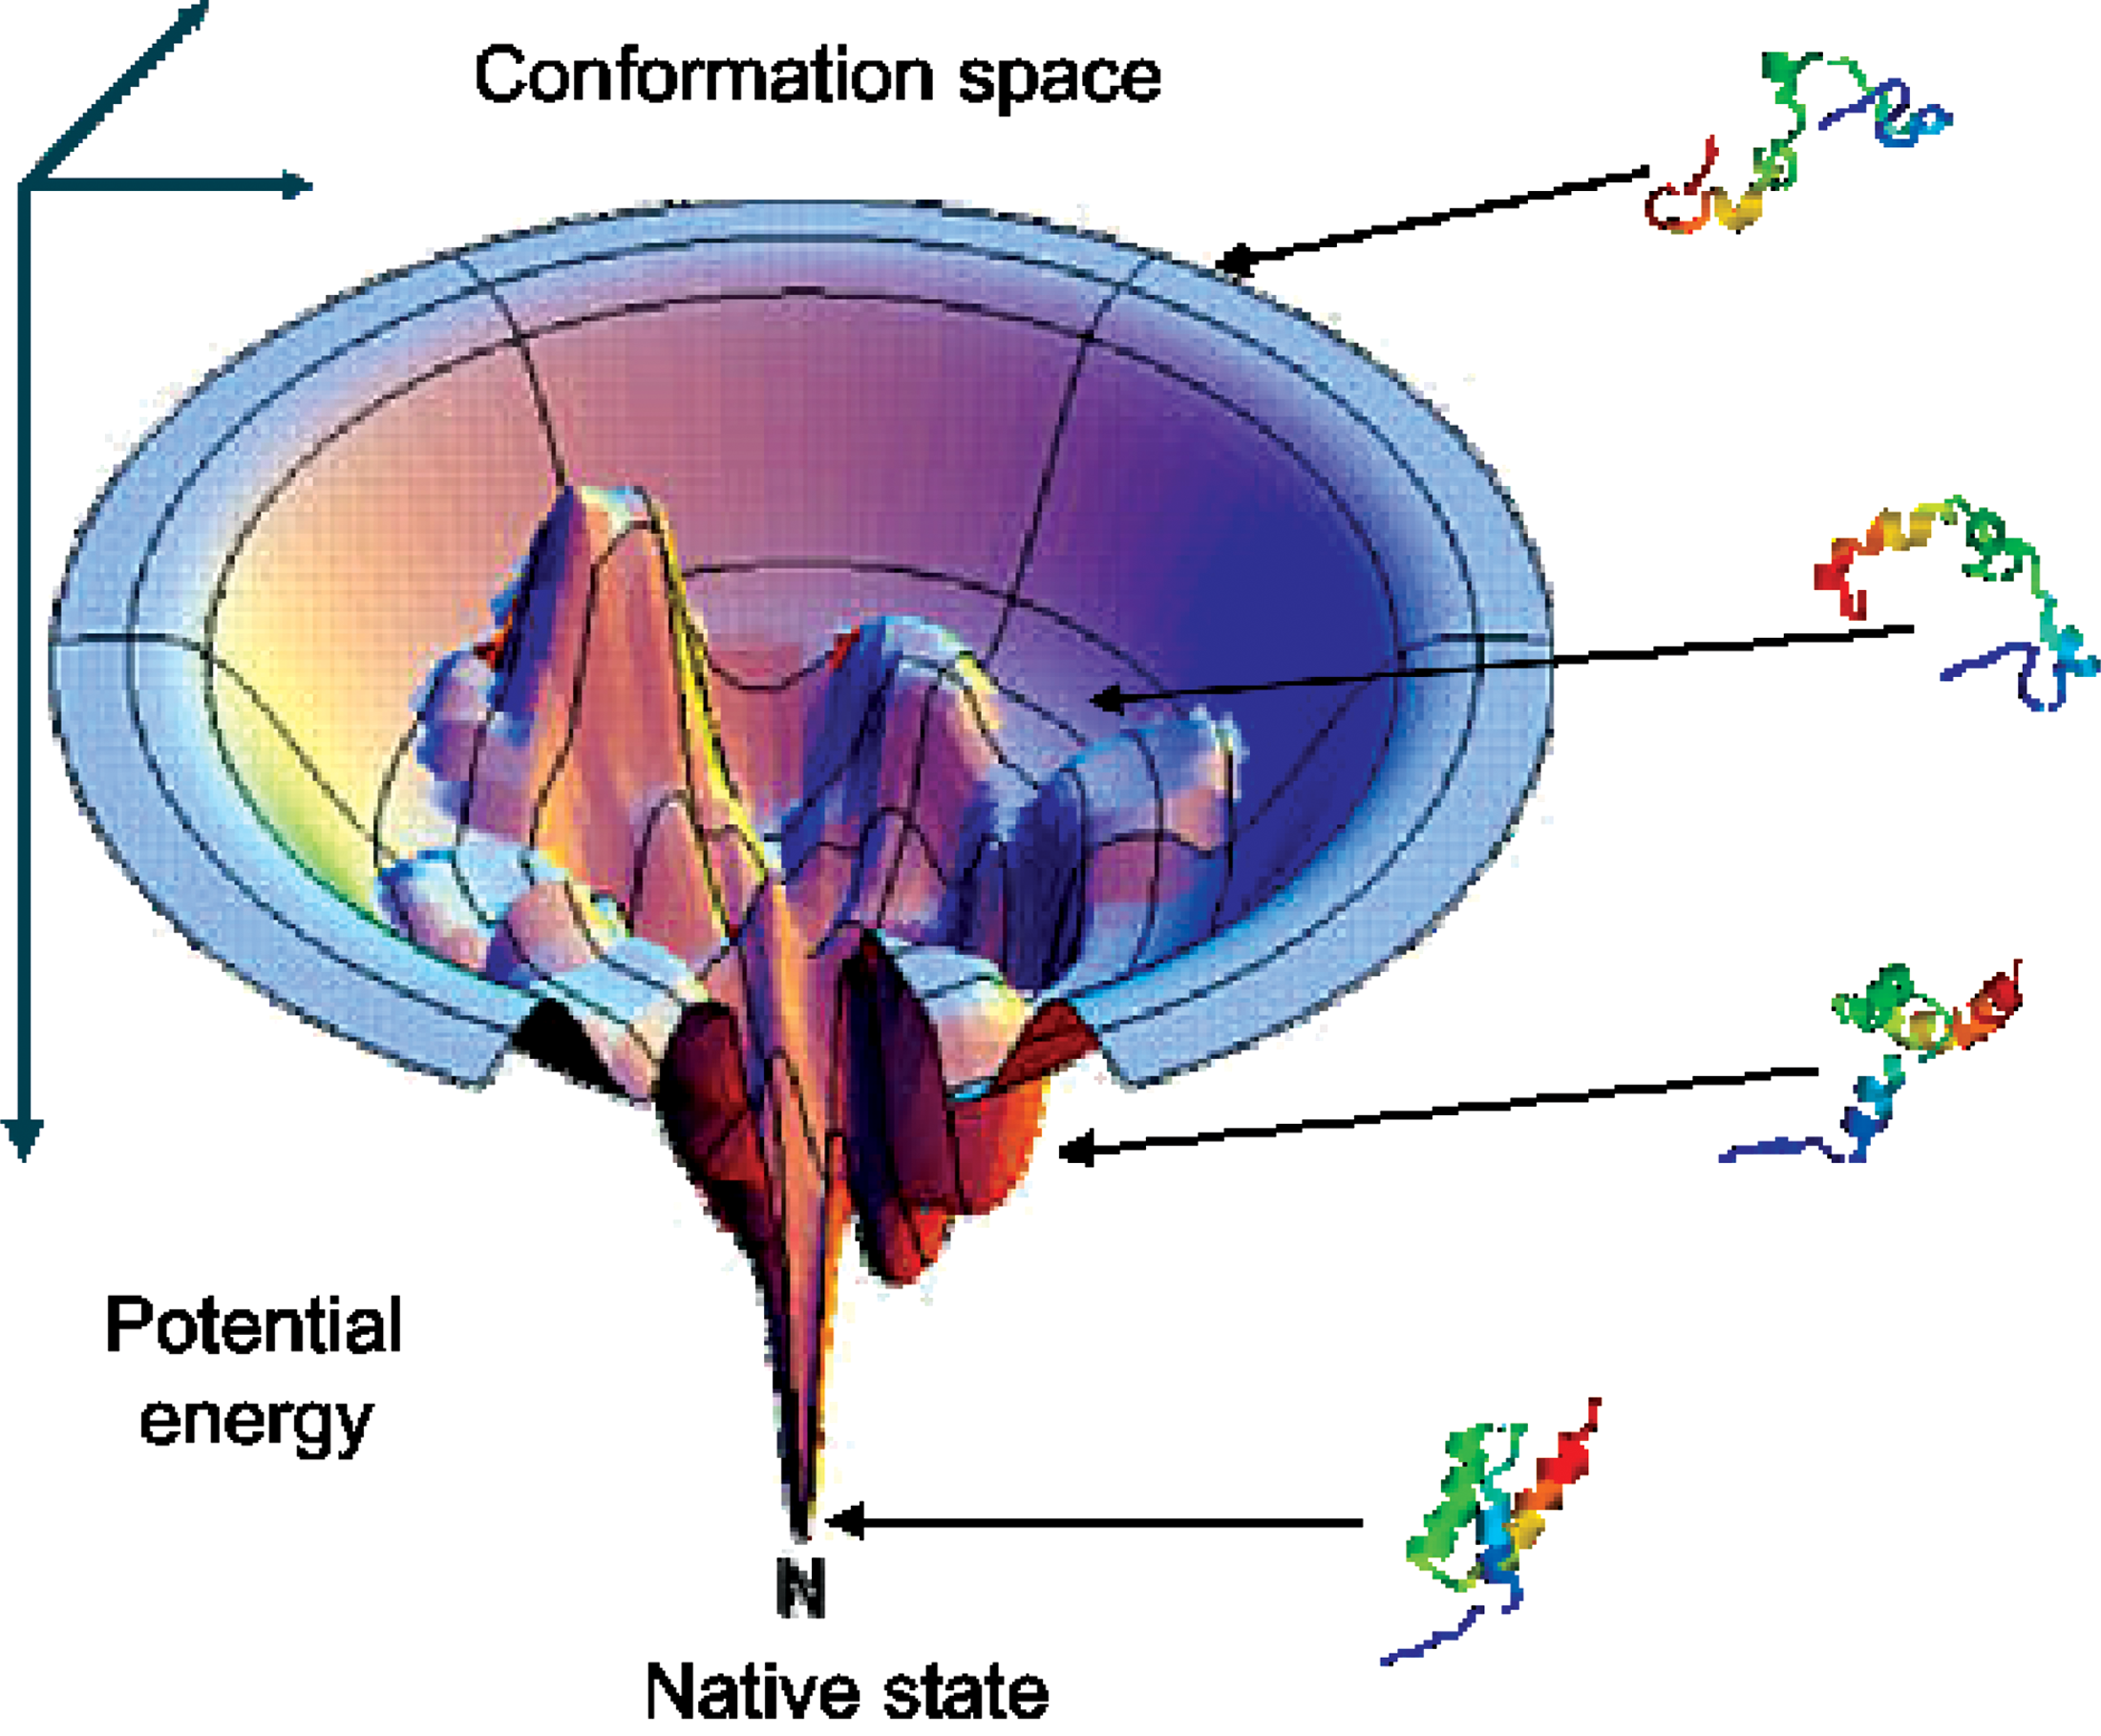
The potential energy landscape of a protein is the set of all conformations and their associated potential energies (Chan and Dill, 1998). The conformation space of a protein can span hundreds of degrees of freedom; it is not limited to only the x−y plane.
2.2. Energy functions
The protein's atoms interact with each other and with the surrounding solvent through bonds and non-bond interactions such as electrostatic interactions and van der Waals forces. A potential energy function determines conformation validity by taking into account these different atom interactions.
Generally, potential functions that compute all pairwise interactions are called all-atoms functions, for example, CHARMM (Brooks et al., 1983) and AMBER (Weiner and Kollman, 1981). These are the most accurate since they consider all possible interactions. However, they are computationally expensive and infeasible for many large proteins.
Instead of modeling all possible interactions, coarse-grained functions only consider side chain contributions to approximate the potential energy. In the φ−ψ model, each side chain is modeled as a sphere located at the Cβ atom. If two side chains are too close (i.e., less than 2.4 Å, the conventional van der Waals contact distance), the conformation is rejected (Levitt, 1983). Otherwise, the energy may be calculated as:
where Kd is 100 kJ/mol, di is the distance of a hydrogen or disulphide bond in native structure, and d0=dc=2Å (Levitt, 1983). Ehp represents the hydrophobic effect. This energy function has been shown to produce high-level folding simulation results similar to an all-atoms function in a fraction of the time (Song et al., 2003). It is the energy function used here in these results.
2.3. Decoy databases
Decoys are computer-generated protein structures. Decoy databases have been used to improve the accuracy of scoring functions (Handl et al., 2009; Subramani et al., 2009). A scoring function is the component of a protein folding algorithm that distinguishes between native and non-native structures. Thus, the performance of the algorithm is dependent on the accuracy of the scoring function. Decoy databases attempt to “fool” a scoring function into choosing a non-native structure as the native. Some existing decoy databases include (i) the Decoys ‘R’ Us set (Samudrala and Levitt, 2008), (ii) the Rosetta set (Tsai et al., 2003), and (iii) the Critical Assessment of Protein Structure Prediction (
The Decoys ‘R’ Us set contains three subsets: the single decoy set, the multiple decoy set, and the loop decoy set. The single decoy set only contains the native structure and one decoy structure. The purpose of this set is to test whether a scoring function can distinguish between these two structures. The multiple decoy set and the loop decoy set each contain many decoy structures, and they are both used to verify that a scoring function can select a conformation with low RMSD to the native structure.
The Rosetta set is generated by the Rosetta protein structure prediction method developed in the Baker Laboratory. It can generate low-resolution structures by adding side chains and making structure adjustments (Bonneau et al., 2001).
Some work has been proposed to improve protein decoy sets. For example, the Rosetta set has been improved by adding back the side chains and running the structures through an energy minimizer (Tsai et al., 2003). Other work uses a library of short fragments to generate protein decoys by assembling them together given the protein's geometric constraints (Kolodny and Levitt, 2003). Most assembled proteins are 6Å from the native structure. Fragments of varying lengths are used in Molloy and Shehu (2012) to refine near-native protein decoy structures. While this multi-level approach produces decoy structures closer to the native structure, this method is dependent on the quality of the input fragments.
2.4. Sampling Conformations
Algorithms in the field of motion planning and robotics use sampling-based methods to generate valid robot configurations. Some examples include the Probabilistic Roadmap (
In the context of protein folding, sampling methods generate protein conformations by setting a value for each degree of freedom in the protein model. Thus, for the φ−ψ protein model used in this work, a conformation q is generated by assigning a value to each φ and ψ angle. The conformation q is accepted based on its potential energy E(q) with the following probability:
Values for each degree of freedom may be generated in a variety of ways. For example, they can be obtained from molecular dynamics or Monte Carlo simulations, global optimization techniques such as basin-hopping (Wales and Doye, 1997), or robotics-inspired search methods (Amato et al., 2003; Shehu et al., 2009; Cortés and Al-Bluwi, 2012).
3. Methods
In this section we describe our approach to evaluating and improving the quality of decoy databases. We first discuss how to evaluate a decoy set using various metrics. We then present two types of improvement operations: adding novel structures to the set and removing redundant structures from the set.
3.1. Decoy set evaluation
Because our methods improve existing decoy sets, we first develop strategies for analyzing the quality of decoy sets. These are used later to show what advantages the improved set provides over the original. We present several quantitative metrics to compare decoy sets and describe how their values are calculated in the experiments.
where E(d) is the energy of a structure d, E avg (D) is the average energy of D, and E std (D) is the standard deviation of the energies in D.
A positive z-score means the native structure has a higher energy than the average energy of the set, and a negative z-score means the native structure energy is lower than the average energy. A z-score of zero indicates the native structure energy and the average decoy energy are exactly the same. A desirable decoy set has structures with low energies close to the native structure. Thus, we would like to see the z-score approach zero after improvement, which indicates that it contains structures with similar energies to the native.
Higher values indicate greater changes in z-score. Note that this score is most meaningful when the two sets are roughly equal in size, which is the case in the results presented here (see section 4).
This metric measures the diversity of structures in the set. As the minimum distance increases, the diversity of structures included in the set also increases. Possible distance functions include Euclidean distance in φ−ψ-space and CαRMSD. In this work, we use Euclidean distance.
3.2. Decoy set improvement
There are two main phases in the improvement of decoy sets. First, samples are generated on the protein's energy landscape. This set may be generated in a variety of ways and is discussed in further detail below in section 3.2.1. In the decoy selection phase, some structures are chosen from the original set D to be removed and some are chosen from the sample set S to be added. Decoy selection is discussed below in section 3.2.2.
3.2.1. Sample set generation
To improve decoy sets by adding structures, we must first generate a set of samples from which to select. We can use one or more of the methods discussed below to generate structures and retain the energetically feasible ones as given by Equation 2.
• Uniform sampling. This is the simplest strategy. It returns a structure at a random point on the energy landscape by simply selecting values for each φ and ψ angle uniformly at random. This will generate many unwanted high-energy structures but provides good coverage of the landscape. However, it does not provide dense coverage around more interesting regions, for example, the native energy basin or local minima. Thus, it should be used in conjunction with other sampling methods. • Sampling with native bias. Iterative Gaussian sampling (Amato et al., 2003) biases samples by iteratively perturbing the native state. It samples torsional angles from a set of normal distributions centered around previously sampled structures, starting with the native state. This approach has been successfully applied to simulate the folding process on larger proteins. It generates many low energy samples, but they are usually confined to the native energy basin. Figure 2 illustrates this process. • Biased sampling from low-energy decoys. Instead of starting from the native structure as iterative Gaussian sampling (Amato et al., 2003), this approach begins the iteration from the decoy structures with the lowest energy. To our knowledge, this is a novel approach to generating low-energy structures. As with native bias sampling, perturbations are selected from a set of normal distributions. Here, generated structures have low energies and are not confined to the native energy basin. However, it typically produces samples near the energy basins of selected decoys.

Iterative Gaussian sampling gives a denser distribution near the native structure at the bottom of the energy landscape funnel and a sparser distribution as they grow outward.
Any sampling method can be incorporated in the hybrid sampler. In our experiment, we combine the above three methods to form a hybrid sampler that exploits the strengths of each. Such a sampler first adds the native structure to the set of seeds as in iterative Gaussian sampling (Amato et al., 2003). For the remaining seeds in the set, it selects half from the lowest energy decoy structures and half from uniform sampling. This ensures that there are plenty of low-energy structures in the final set that are located throughout the energy landscape in many different local minima. Such structures are important to include because they are most likely to confuse a scoring function.
3.2.2. Decoy Selection
Given an existing decoy set D and a set of sample structures S, we would like to add viable structures from S to D and remove redundant structures from D. To select such structures, we apply a filter to each one, keeping those structures that pass the filter. In this work, we investigate the following filters:
• Energy filter. This filter chooses all structures whose energy is less than some threshold. For the results in this work, we use the energy function in Song et al. (2003). • Minimum distance filter. This filter selects structures whose distance to their closest neighbor as determined by some distance metric δ is greater than some threshold. Here we use Euclidean distance.
For each filter, we must specify a threshold or cutoff value that decides which samples to keep and which to discard. We set the filter's threshold to be one standard deviation above (for the energy filter) or below (for the minimum distance filter) the average value of the set.
4. Results and Discussion
We apply our methods to existing decoy sets and show that they are able to generate sets with lower energies and more diverse structures that are more likely to “fool” protein folding scoring functions. All decoy sets were obtained from the existing Decoy ‘R’ Us databases (Samudrala and Levitt, 2008),
D is the original decoy set, DD is the set of deleted structures from D, and DV is the set of viable (retained) structures from D. S is the set of sampled structures, and SV is the set of viable (retained) structures from S.
4.1. Decoy selection
The original decoy set D and the sample set S can be broken down into four subsets:
• redundant decoy structures DD from D, • viable decoy structures DV from D, • redundant sampled structures SD from S, and • viable sampled structures SV from S.
Figure 3 shows the relationship of these four subsets. The final improved decoy set is DV∪SV and is a combination of two operations: removing redundant structures (yielding DV) and adding new structures (yielding SV).
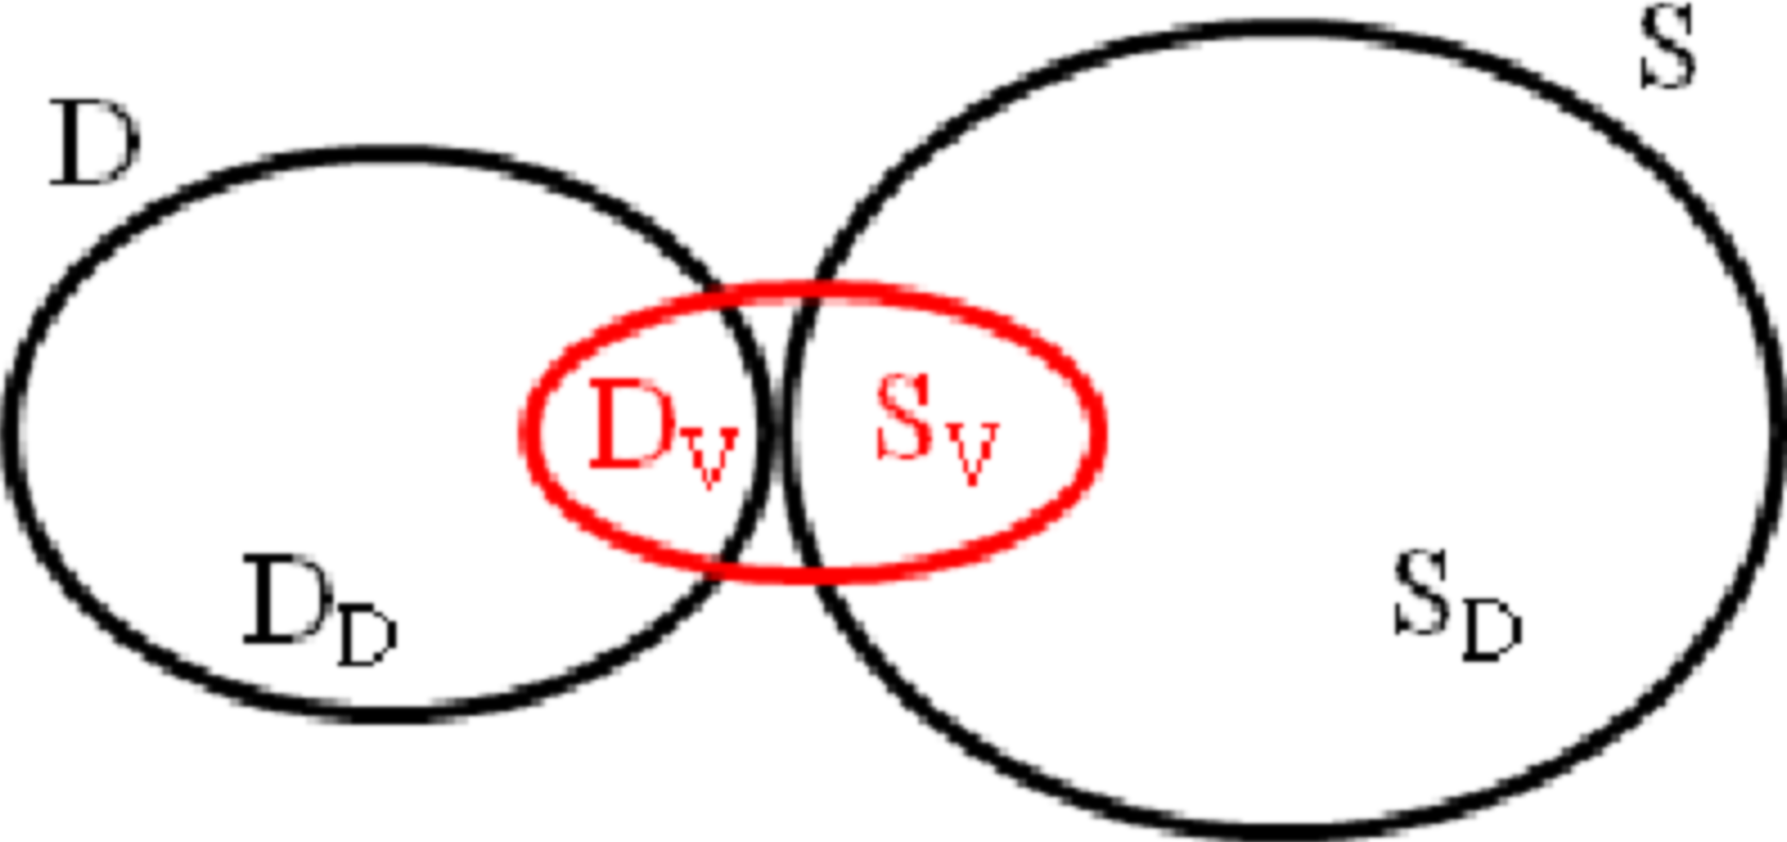
The relationship between each of the subsets DD, DV, SD, and SV from the original decoy set D and the sample set S. The final set, in red, is DV∪SV.
Table 1 provides the resulting set sizes after improvement. To generate S, we combine uniform sampling, sampling with native bias, and decoy-biased sampling into a hybrid sampler containing all three methods. We then apply both the energy filter [using the coarse-grained energy function from (Song et al., 2003)] and the minimum distance filter (using Euclidean distance in φ−ψ-space) to S and to the original set D to create the set of viable structures DV∪SV. For all proteins, the resulting size is comparable to the original.
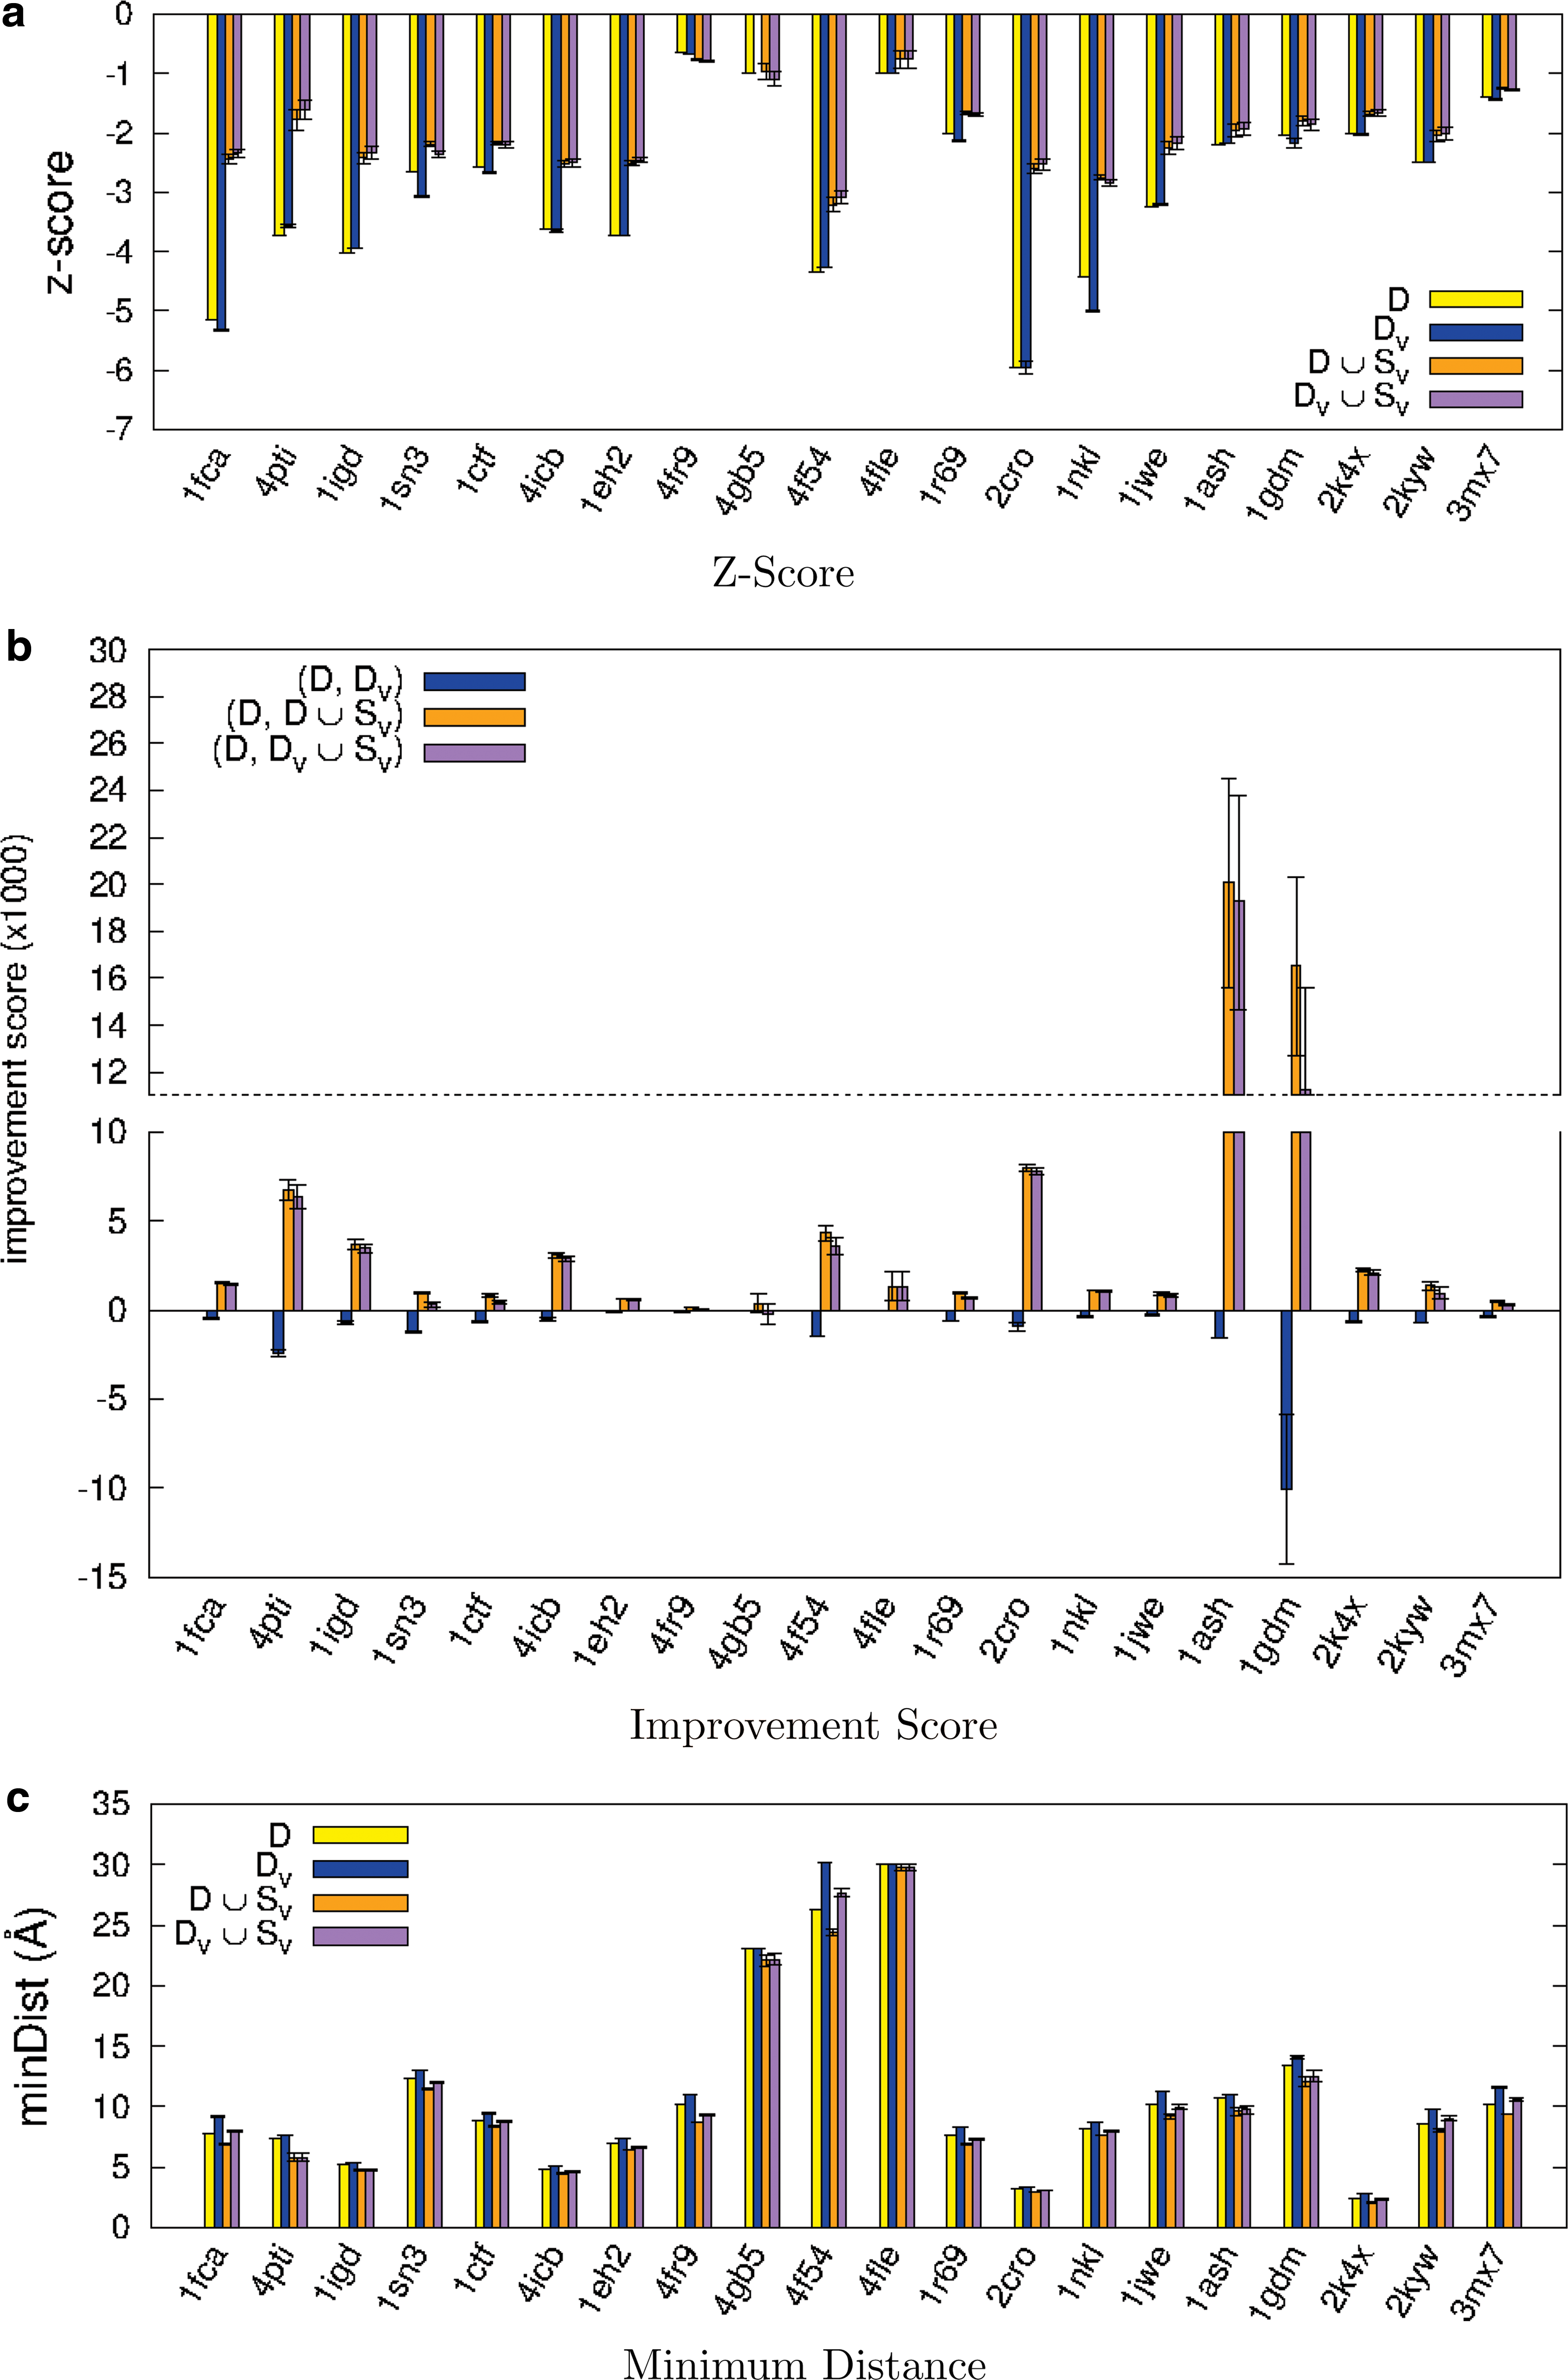
Figure 4 summarizes the resulting z-score, improvement score, and minimum distance value for each protein. For each metric, we show the contribution from each operation [removing redundant decoys (DV) and adding new samples (D∪SV)] and from their combination (DV∪SV).
Resulting metrics of improved decoy sets and their subsets, where D is the original set, DV is after redundant structures are removed, and SV is the set of sampled structures to be added.
When the z-score approaches zero, the native structure energy is harder to distinguish among the other structures in the set. For every protein in Figure 4a, the z-scores of D and DV are very similar. Hence, simply removing structures does not greatly impact z-score. Once we add new structures from our sampling approach (D∪SV), the z-score drops drastically with scores comparable to the final set (DV∪SV). Thus, the main contributors to z-score improvement are the structures generated by our sampling approach.
Recall that the improvement score shows the change in z-score per sample between two sets. A higher value indicates that the change (either structure addition, removal, or both) has a greater impact on the z-score. Figure 4b displays the improvement scores across all tested proteins. We again see that adding structures provides a decoy set with better quality than simply removing redundant ones. Proteins 1ash and 1gdm with the smallest original sets show the largest improvement scores. Since the original set sizes are small, removing structures causes significant decrease in the improvement scores.
The last metric we examine is the minimum distance between neighboring structures, which indicates set diversity. A larger distance signifies greater structural diversity and implies a greater ability to “fool” different scoring functions. Figure 4c shows how this metric changes for each operation. As expected, when decoys are removed (DV), the minimum distance increases, and when adding decoys (D∪SV), the minimum distance decreases. For all proteins studied, the minimum distance is not affected significantly by adding decoys (D∪SV), implying that they are informative structures.
Table 1 also shows the contributions from each type of sample (e.g., from the original decoy set, from uniform sampling, etc.) to the final improved decoy set. In the final improved decoy set, most samples come from the original set (DV) and the remaining largely come from native bias sampling. Uniform sampling and decoy bias sampling play a very small role because they typically fail to pass the filters employed in the decoy selection phase, either because their energies are too high or they are too similar to structures already in the final set. Although uniform sampling doesn't contribute in the improved decoy set, it generates samples efficiently and covers the energy landscape evenly. We believe uniform sampling is the baseline method to be included in the hybrid sampler. Decoy bias sampling is considered as a strong approach to cover the local minimum regions in the energy landscape. It provides some good candidates to improve the decoy set quality for 1sn3, 4fr9, 1r69, and 2k4x. Decoy bias sampling performs pretty well particularly in the 2k4x case, which contributes 10.67% of samples in the final improved set. This is something interesting that we would like to study—the sample locations in the energy landscape—further in the future.
Figures 5 and 6 show the potential vs. CαRMSD from the native structure distribution for each protein. In each plot, three subsets are displayed: DV, DD, and SV. We see that in general, the added structures have lower energies and cover a wider range of CαRMSD than the original structures. While most added structures are located near the native structure, there are also some structures with high CαRMSD. These structures are especially valuable because they could be located in a local minima of the energy landscape and may be more likely to “fool” scoring functions. Decoy bias sampling was able to generate samples that passed the filters for 1sn3, 4fr9, 1r69, and 2k4x; these are highlighted with brown boxes.
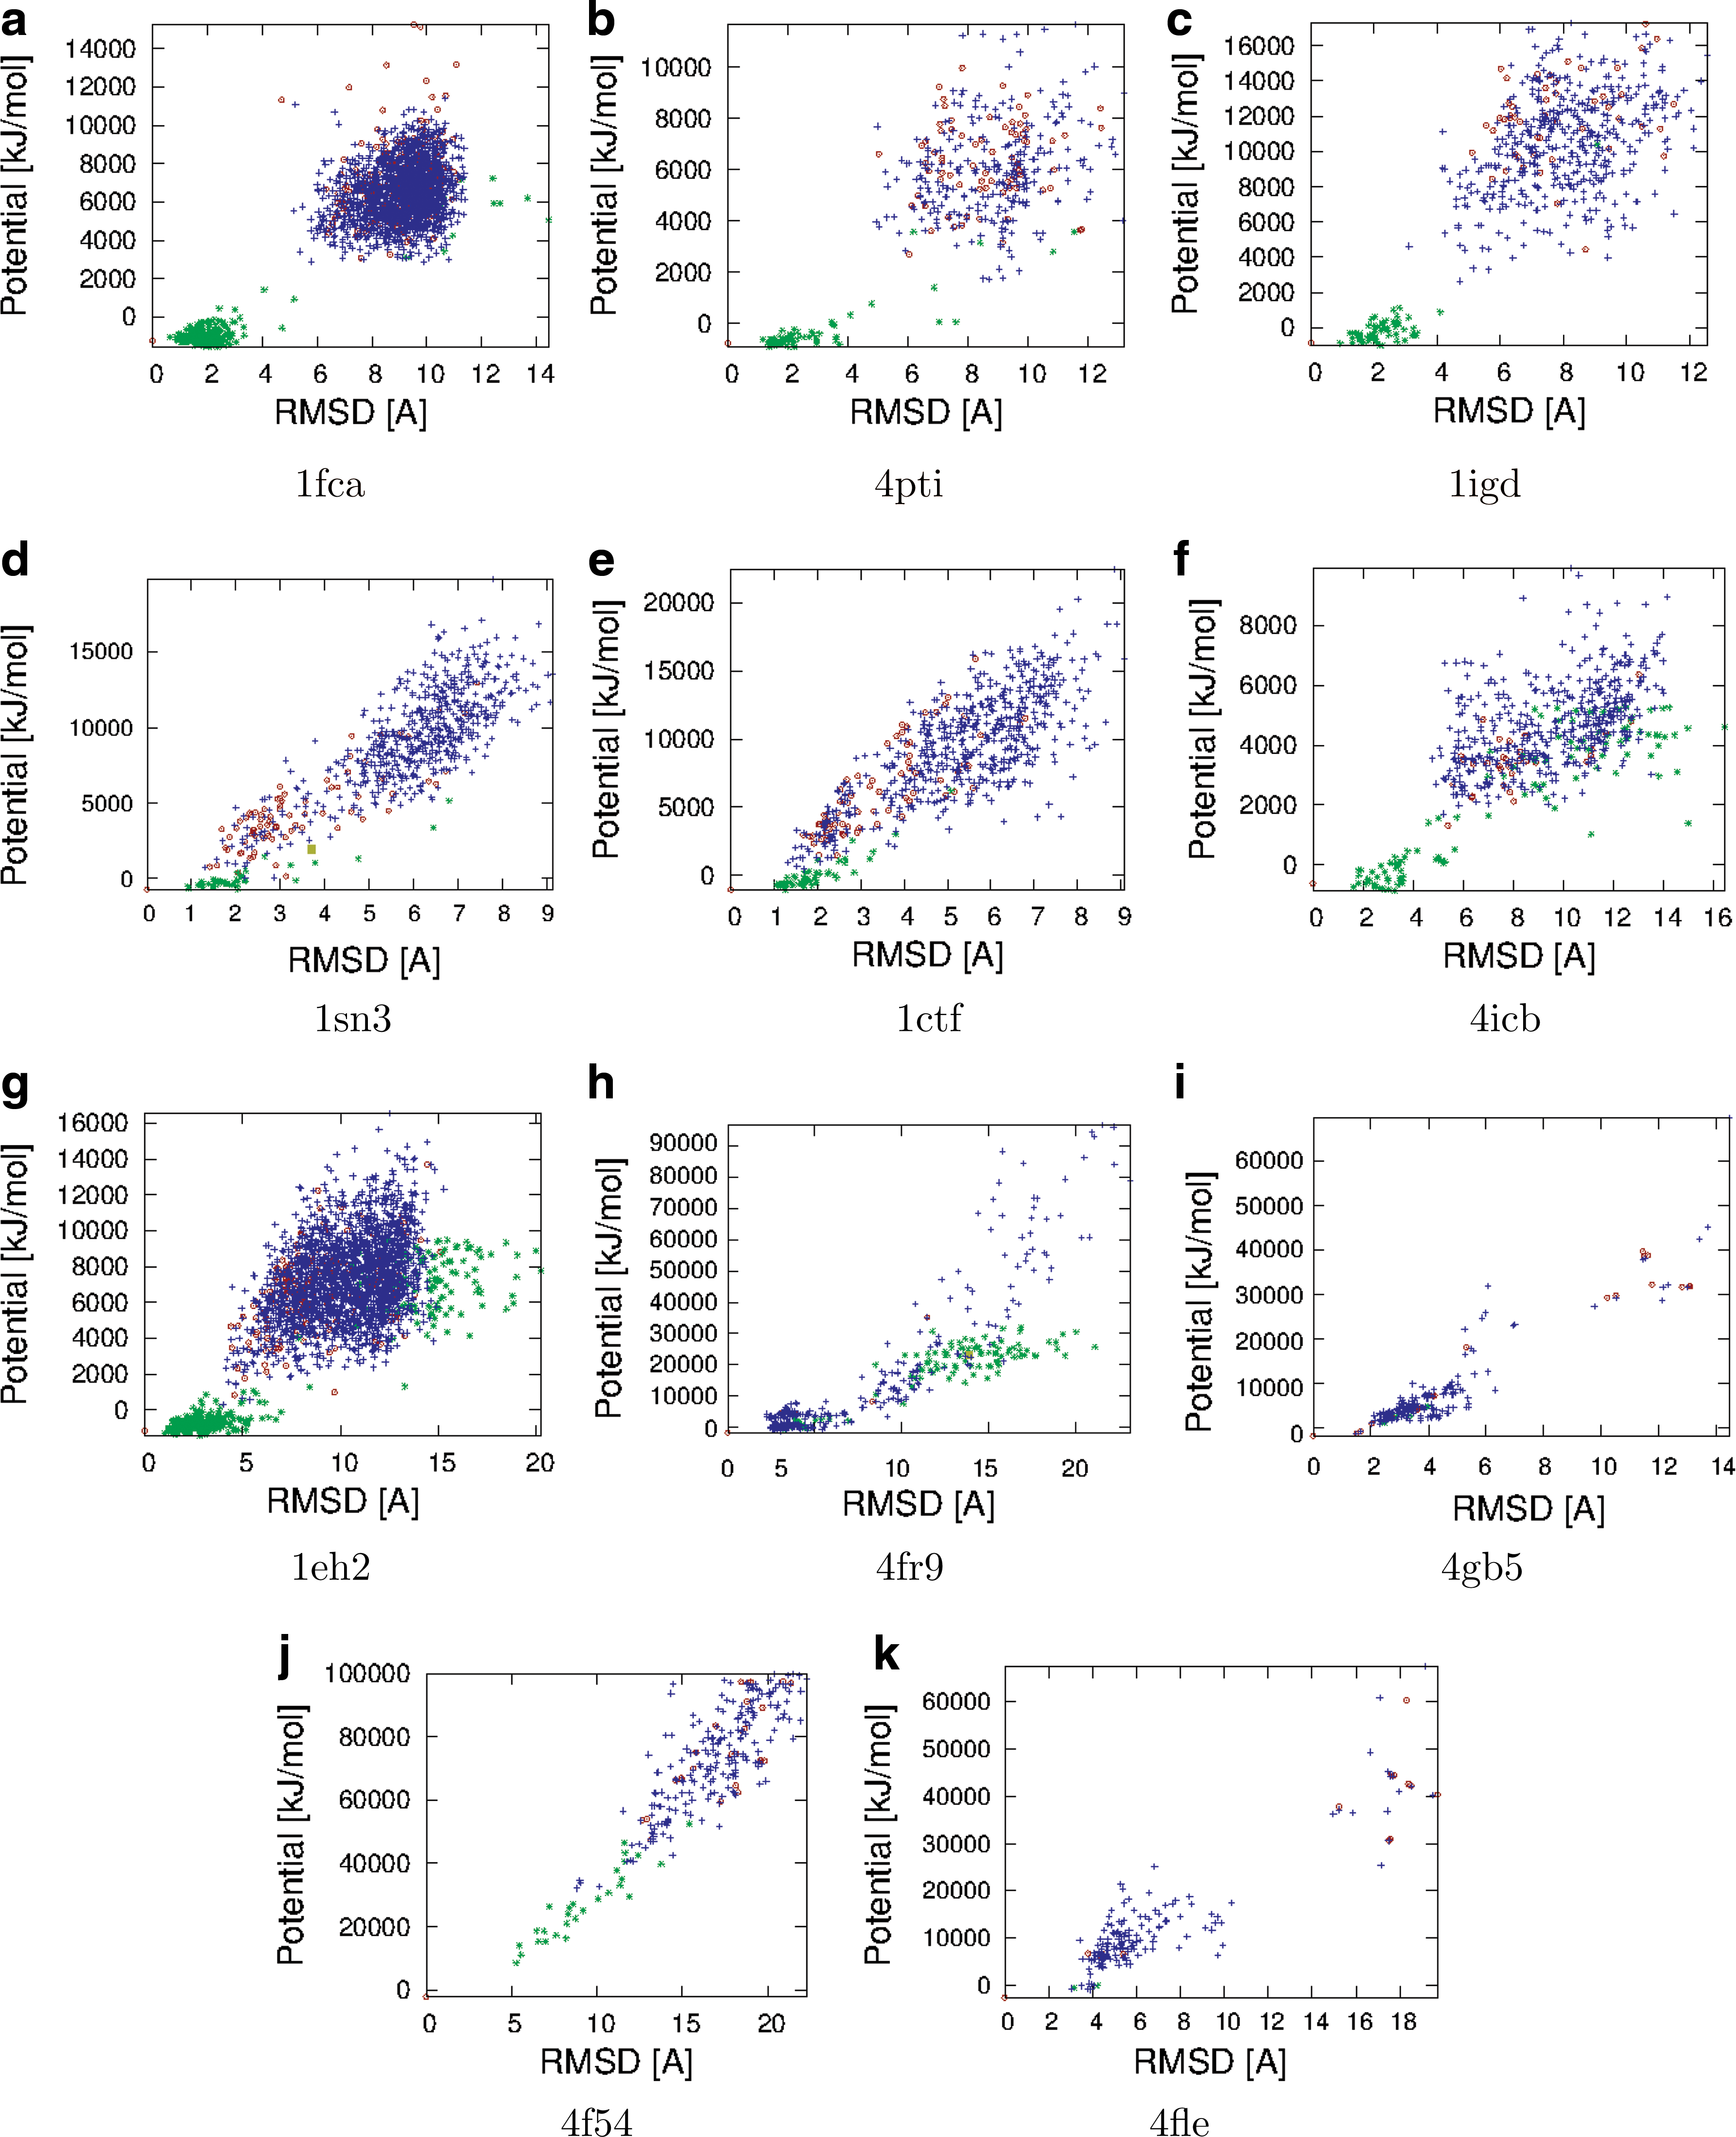
Potential vs. CαRMSD for DD (red circles), DV (blue +'s), and SV (green *'s) for α/β mixed proteins. Decoy bias sampling was able to generate samples that passed the filters for 1sn3 and 4fr9; these are highlighed with brown boxes.
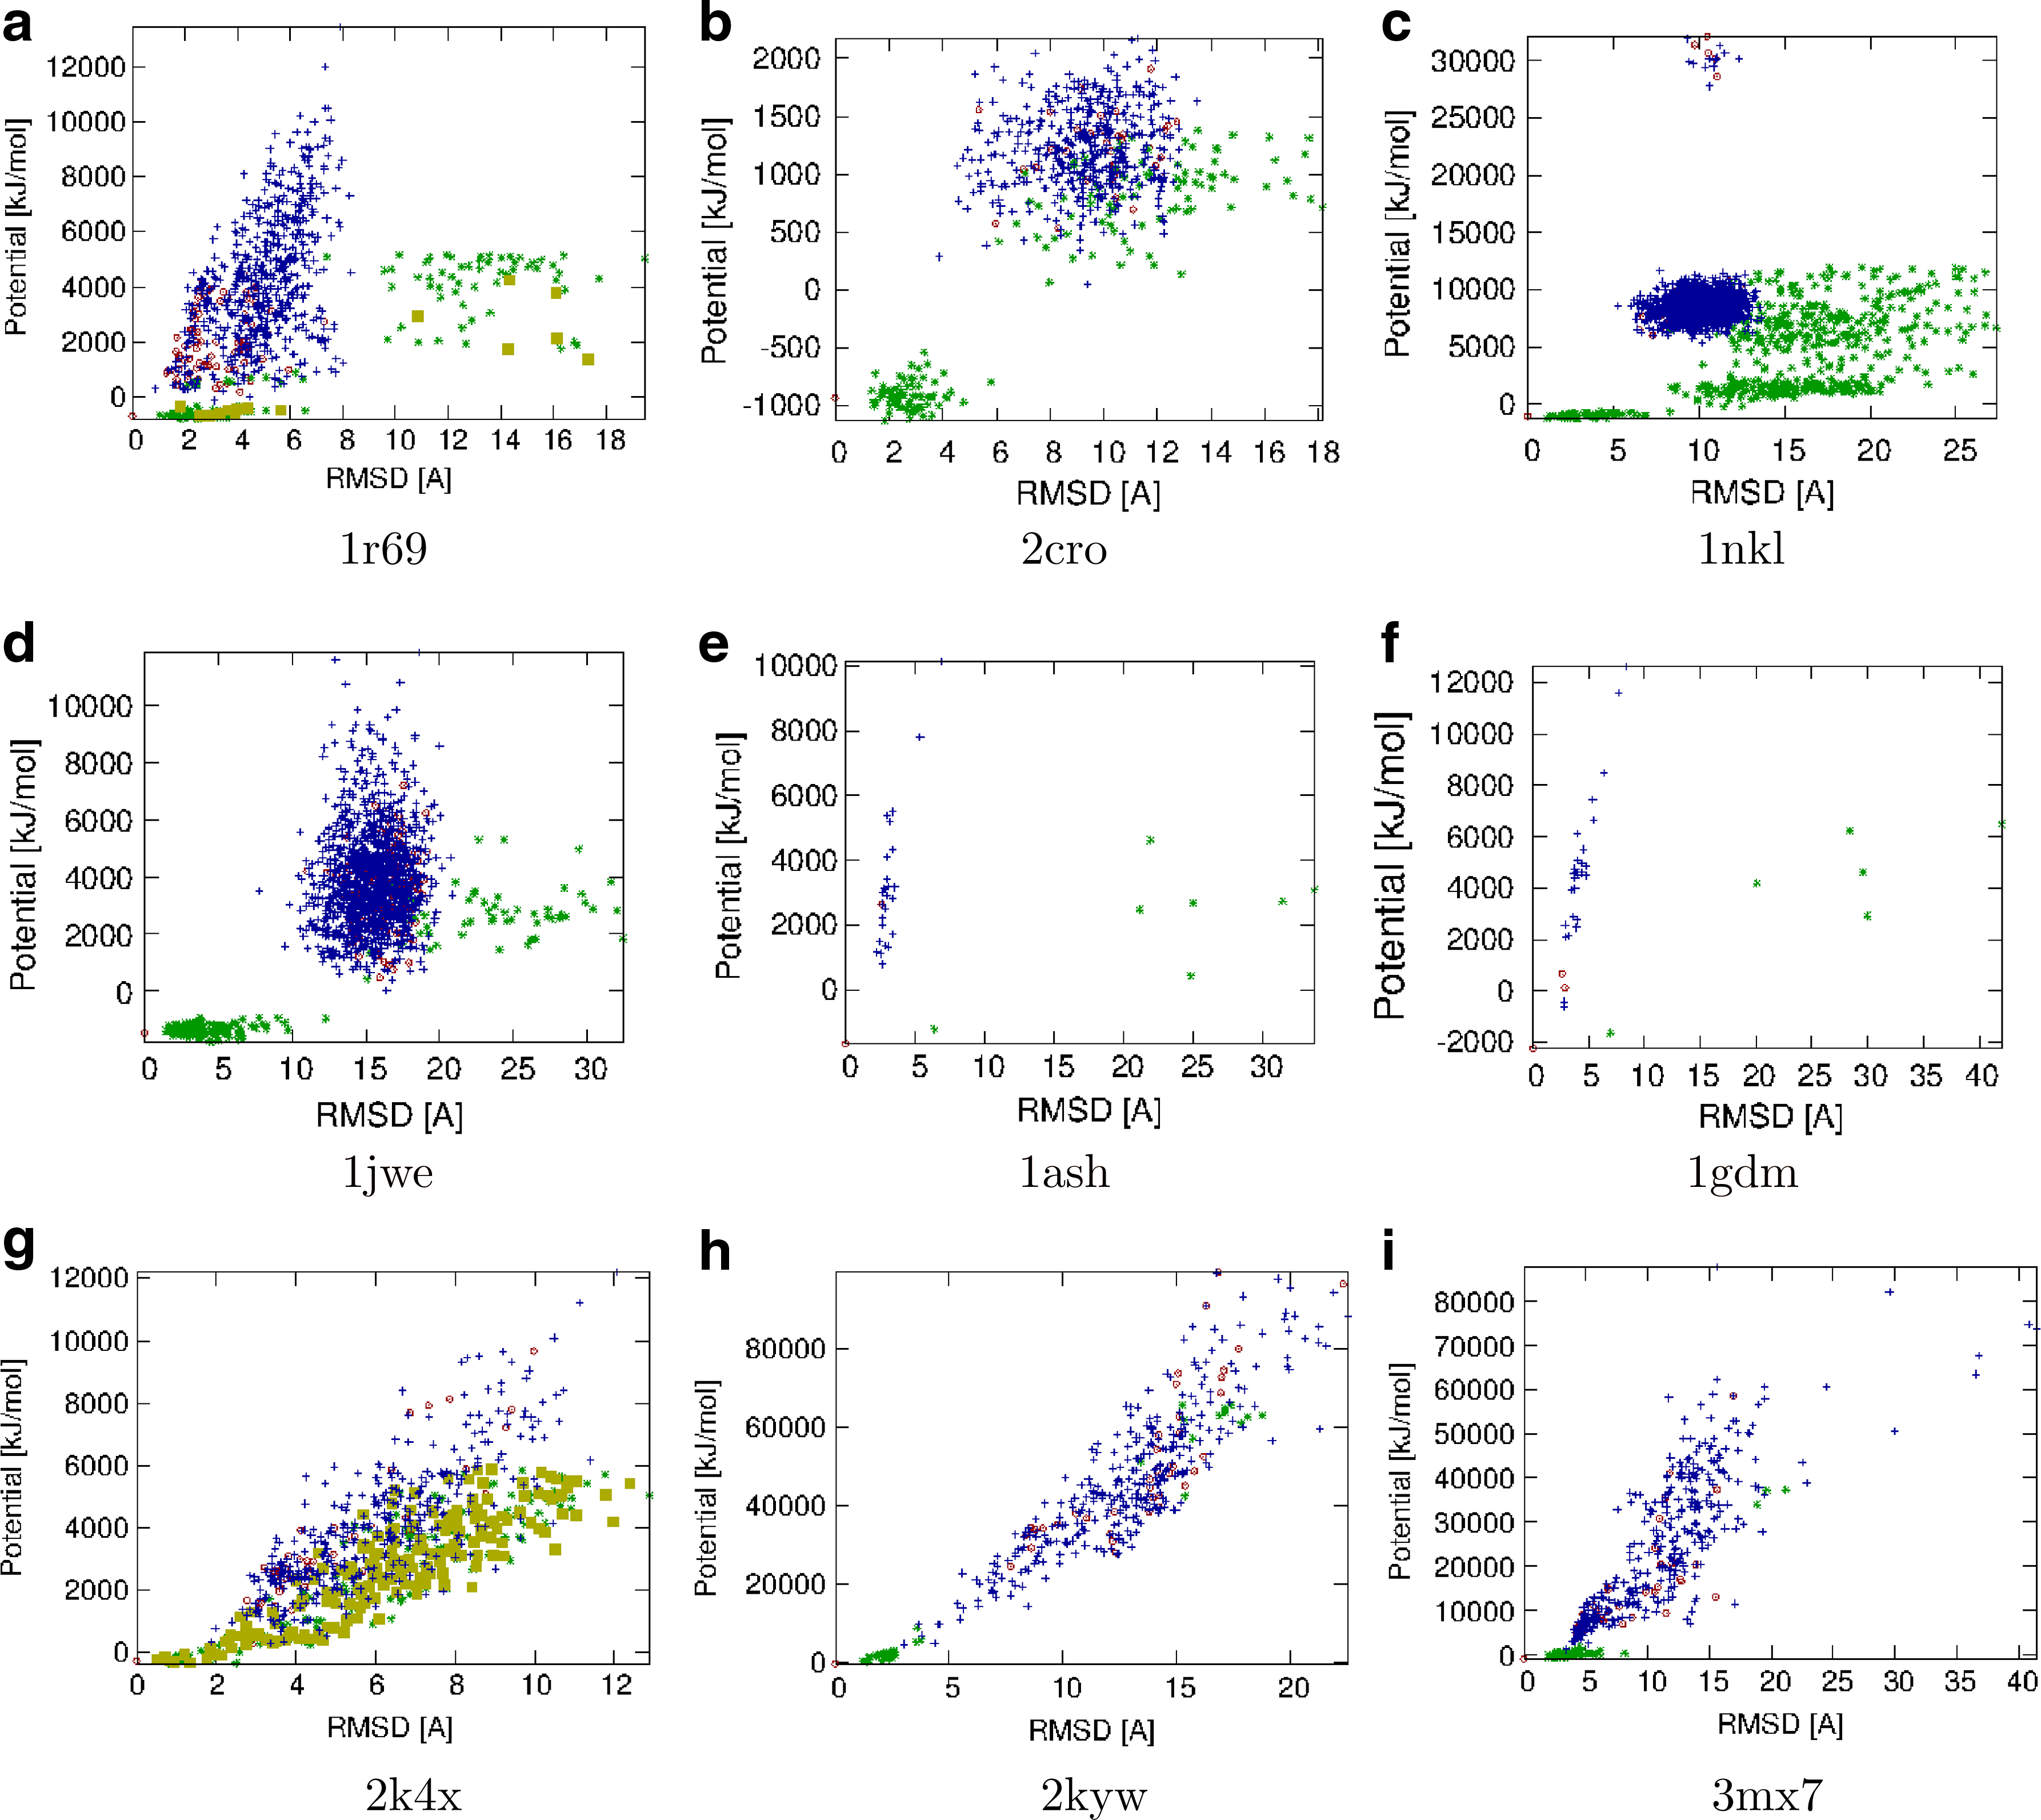
Potential vs. CαRMSD for DD (red circles), DV (blue +'s), and SV (green *'s) for α and β proteins. Decoy bias sampling was able to generate samples that passed the filters for 1r69 and 2k4x; these are highlighted with brown boxes.
4.2. Improved decoy sets in practice
Here we assess the ability of our improved decoy sets to “fool” modern scoring functions. We study two different scoring functions: Qualitative Model Energy ANalysis (QMEAN) and RWplus potential. QMEAN (Benkert et al., 2008) is a composite scoring function incorporating several different structural descriptors including local geometry features for discriminating nativelike torsional angles from others, secondary structure features for long-range interactions, burial status, and solvent accessibility. RWplus potential (Zhang and Zhang, 2010) is a distance-dependent atomic statistical potential that uses an ideal random walk chain as a reference state and incorporates orientation-dependent energy arising from side chains. RWplus potential favors capturing short-range interactions and has been shown to accurately identify nativelike structural features. QMEAN and RWplus potential were selected for study because they showed statistically significant improvement over other well-established scoring functions and are both publicly available.
Table 2 compares the number of structures QMEAN and RWplus potential ranked higher than the native state between the original decoy dataset and our improved decoy dataset, respectively. We used the QMEAN webserver (Benkert et al., 2009) and the RWplus potential executable from the Zhang lab website (Zhang) to generate rankings.
In 8 out of 20 proteins studied, our improved decoy sets were able to produce more structures that “fooled” at least one of the scoring functions than the original set, sometimes finding a large number of new structures as for 1eh2. RWplus potential was less likely to be “fooled” than QMEAN as more decoy sets contained a greater number of structures ranked higher than the native in the improved set over the original set for QMEAN. This is a bit different from what was found in (Zhang and Zhang, 2010), where QMEAN and RWplus potential had comparative performance. QMEAN is a composite potential combining various resources, and RWplus potential claims to be strong at recognizing strong signals at short-range interactions. We suspect that local secondary structure changes in our sampling set may be one factor causing RWplus potential to outperform QMEAN here.
It is interesting that both scoring functions misrank a large number of structures for 1eh2. We note that the decoy set improvement performance is less for the three β proteins studied than for the other proteins in the set. This may be attributed to the Euclidean distance filter not being sensitive enough to all-β structures. Consider that two β structures (or near β structures) may be close in φ−ψ space but have large RMSD as they do not contain the tight contact pattern typical of α helices to constrain them. Thus, the Euclidean distance filter may mistakenly discard a structure with large RMSD but small Euclidean distance. Instead, a distance filter based on RMSD may be more appropriate for β proteins. (This is a subject of future investigation.) However, even on sophisticated, modern scoring functions, our improved decoy sets are able to indicate areas of weakness for several of the proteins studied.
To understand why the improved decoy set produces more structures with higher rankings than the native structure, we look at the structural differences between the original and improved decoy sets. As an example, Figure 7 shows the superimposition between the native structure (displayed in green) and the highest QMEAN-ranked decoy (displayed in blue) for 1sn3. 1sn3 is one example where QMEAN is “fooled” but RWplus potential is not. Even though the decoy misses a β sheet (left, circled in red) and has a shorter β sheet (middle), QMEAN scores it higher and would incorrectly select this decoy as the native structure. Since the local secondary structures have been changed, RWplus potential is able to capture the difference and recognize it as a non-native structure.
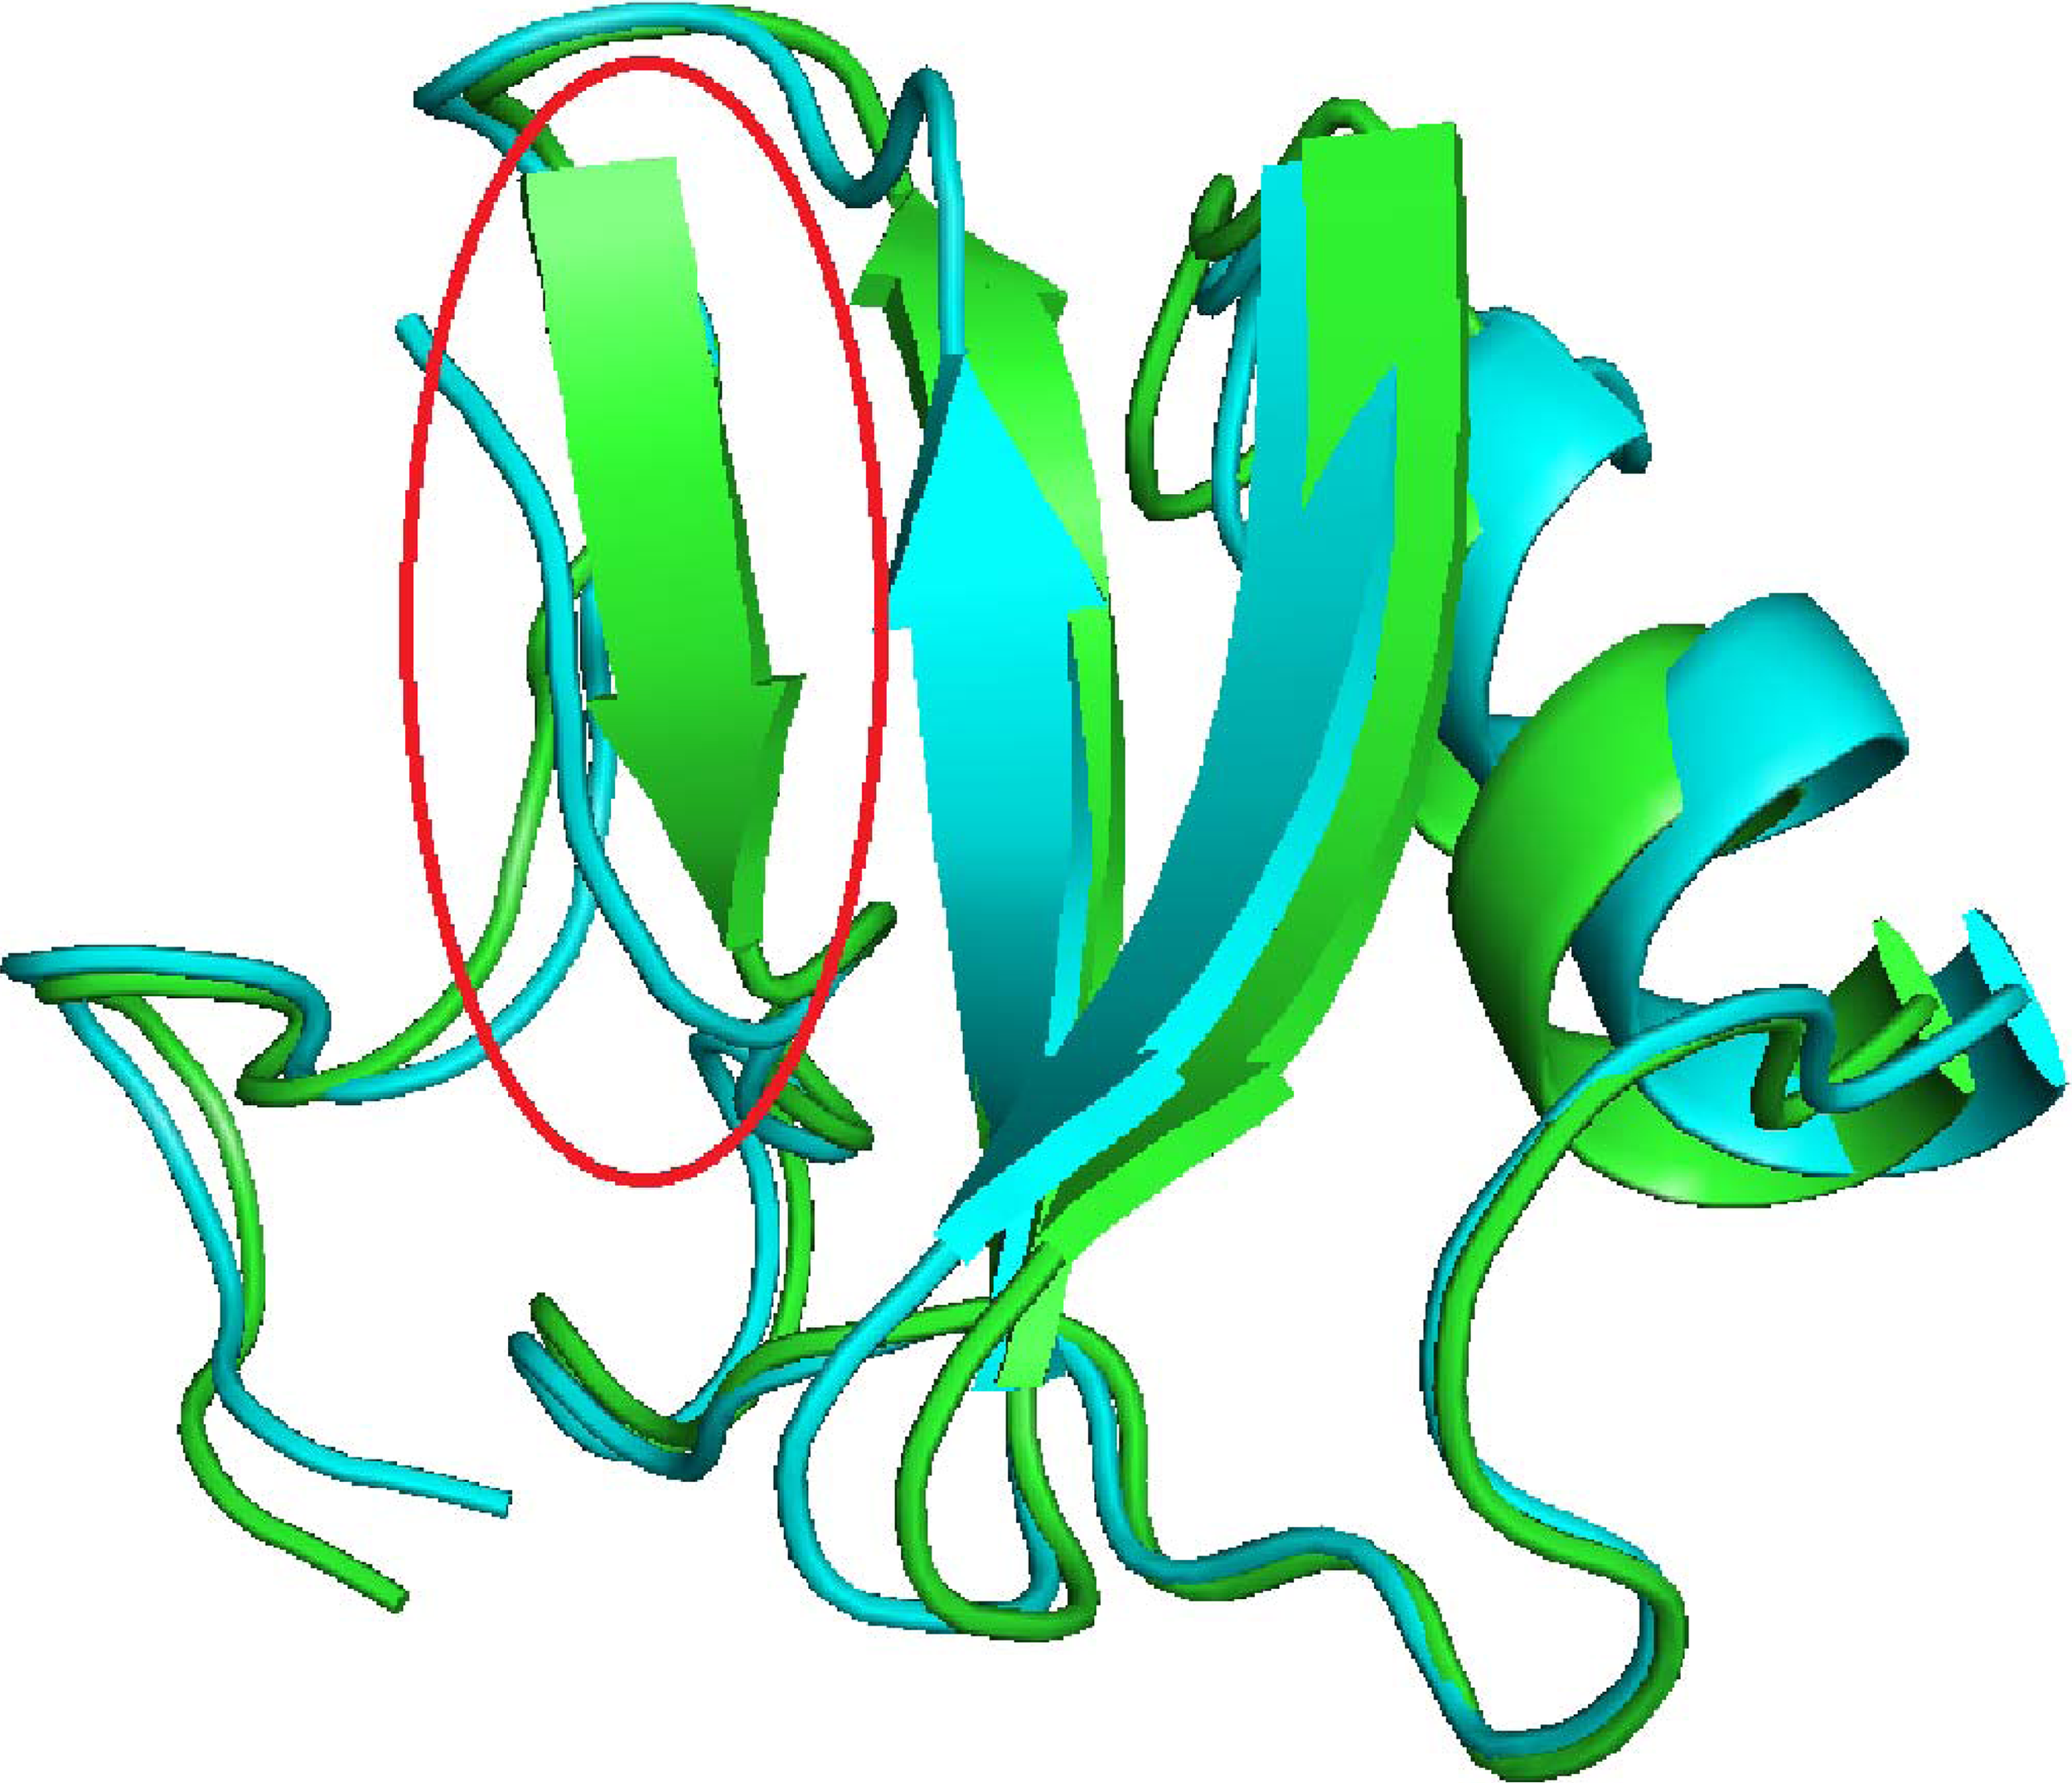
Superimposition of the native structure (shown in green) and the decoy with the highest QMEAN score (shown in blue) for 1sn3 by PyMOL (DeLano, 2002). The decoy misses a piece of secondary structure, circled in red.
5. Conclusions
We describe a new method for evaluating and improving the quality of decoy databases. Our method removes redundant structures and generates new low energy structures in varied locations on the energy landscape resulting in higher quality decoy sets that are more likely to “fool” the scoring functions of modern protein folding algorithms. We tested our approach on 20 different decoy databases of varying size and type and showed significant improvement over the original set. Interestingly, most of the improvement came from adding structures not originally covered by the set, indicating a capacity to “fool” more scoring functions. We also show that our improved databases produced a greater number of structures ranked more native-like by two popular modern scoring functions than the original databases for many of the proteins studied. In the future, we plan to implement a web service to improve user-submitted decoy databases. Our hope is that others can use these improved databases to develop better protein folding algorithms and more accurate folding simulations.
6. Acknowledgments
This work is supported in part by NSF awards CRI-0551685, CCF-0833199, CCF-0830753, IIS-096053, and IIS-0917266; by THECB NHARP award 000512-0097-2009; by Chevron, IBM, Intel, Oracle/Sun; and by award KUS-C1-016-04, made by King Abdullah University of Science and Technology (KAUST). A preliminary version of this work appeared in Lindsey et al. (2014).
7. Author Disclosure Statement
The authors declare that no competing financial interests exist.