
Abstract
Abstract
Drug side effects, or adverse drug reactions, have become a focus of public health concern. Anticipating side effects before the drugs are granted marketing authorization for clinical use can help reduce health threats. An increasing need for methods and tools that facilitate side-effect prediction still remains. Here, we present DSEP, which is a tool that is able to analyze chemistry files to predict side effects of drugs that are under development and have not been included into any database. Meanwhile, DSEP provides three computational methods, one of which is a novel method proposed by us. The method can obtain higher AUC(0.8927) and AUPR(0.4143) scores than previous work. The advantage characteristic and method made DSEP a useful tool to predict potential side effects for a given drug or compound. We use DSEP to conduct uncharacterized drugs' side-effect prediction and confirm interesting results.
1. Introduction
A
Several computational methods have been proposed to predict drug's ADRs. Lounkine et al. (2012) calculated whether a molecule will bind to the off-targets using a statistical model based on chemical features. They rely only on similarity ensemble approach to find out chemical similarity between the molecule and those ligands to predict off-target activities. A method for relating ADRs with cooperative pathways was proposed to predict side effects (Fukuzaki et al., 2009). Nonetheless, this method requires the gene expression profiles observed under drug chemical perturbation. Atias and Sharan (2011) made a combination of canonical correlation analysis and network-based diffusion based on chemical structures to predict ADRs, while Mizutani et al. (2012) used canonical correlation analysis to relate drug–protein interaction network with drug side effects. Moreover, associations between protein domains and drug side effects were not inferred until Iwata et al. (2013) used logistic regression to make an analysis based on drug–target interaction. A chemical fragment-based approach was developed to relate drug chemical substructures with side effects by sparse canonical correlation analysis (SCCA) (Pauwels et al., 2011). Yamanishi et al. (2012) used kernel regression (KR) model to integrate drug chemical structures and target protein information for side-effect prediction. However, these methods are limited to use the original features of the data, and it is hard to find out the deeper internal contact between drug features and side effects.
In this article, we develop a novel method to predict potential ADRs of drugs based on their chemical substructures. We propose that several extensions of BP neural network model apply to the prediction of high-dimensional side-effect profiles. A unique characteristic of the proposed method is the ability of digging deeper information to have an insight into drug–chemical substructure–ADR network. Performance evaluation shows that this method has a higher value of AUC (area under receiver operating characteristic curve) score and AUPR (area under precision-recall curve) score than previous methods. We then developed a tool named DSEP implementing our method for ADR prediction. DSEP is able to predict potential ADRs for drugs in batch. It can not only analyze any drugs from commonly used databases (PubChem, DrugBank, and KEGG), but also process drugs still in development with different chemistry file formats (smiles, mol, sdf, Inchi) to predict ADRs. Besides the novel method proposed by us, the two other computational methods inside DSEP using different principle to predict ADRs make DSEP a reliable tool for ADR prediction in drug discovery. We also conduct ADR prediction with DSEP for uncharacterized drugs of which side-effect information is not stored in the SIDER database and confirm interesting results.
2. Materials
2.1. Drug ADR profiles
The original data were obtained from the SIDER database (Kuhn et al., 2010), which contains 996 drugs, 4192 side-effect terms, and 99,423 associations between drugs and side effects. We remove those side effects that have association with only one drug. This led to the construction of drug–ADR network that contains 697 drugs with 2604 ADRs and 74,343 associations between them. The 697 drugs were grouped based on ATC code, as shown in Figure 1, to verify the diversity and comprehensive of the data. Drug groups in cardiovascular system, nervous system, or metabolism tend to have more links with ADRs. The overlap of ADRs between different drug categories indicated that those drugs may have the same feature, that is, the common mechanism of action.

Distribution of the number of side effects per drug.
2.2. Drug chemical profiles
Different features such as chemical substructure, target, and descriptors have been proposed to use as drug feature profiles. The chemical substructure has been proved an effective feature for side-effect predicting (Bender et al., 2007; Pauwels et al., 2011). Each drug used the fingerprint corresponding to the 881 chemical substructures defined in the PubChem database (Chen et al., 2009) as chemical profiles.
3. Methods
3.1. Methods for predicting high-dimensional side-effect profiles
Unlike the common machine learning algorithm that limits us to use the original features of the data, we propose a novel method for predicting side effects called BP neural network (NN for short) to overcome the limit. The NN took the drugs' chemical profiles as input layer and learn the network itself to get a series of new features, that is, the hidden layer. For a given new drug, the output layer represents the result of predicting side effects. In order to obtain more effective information, we define the number of hidden layer units as
Figure 2A shows the structure of NN. We add an additional node as the bias term for both input layer and hidden layer.
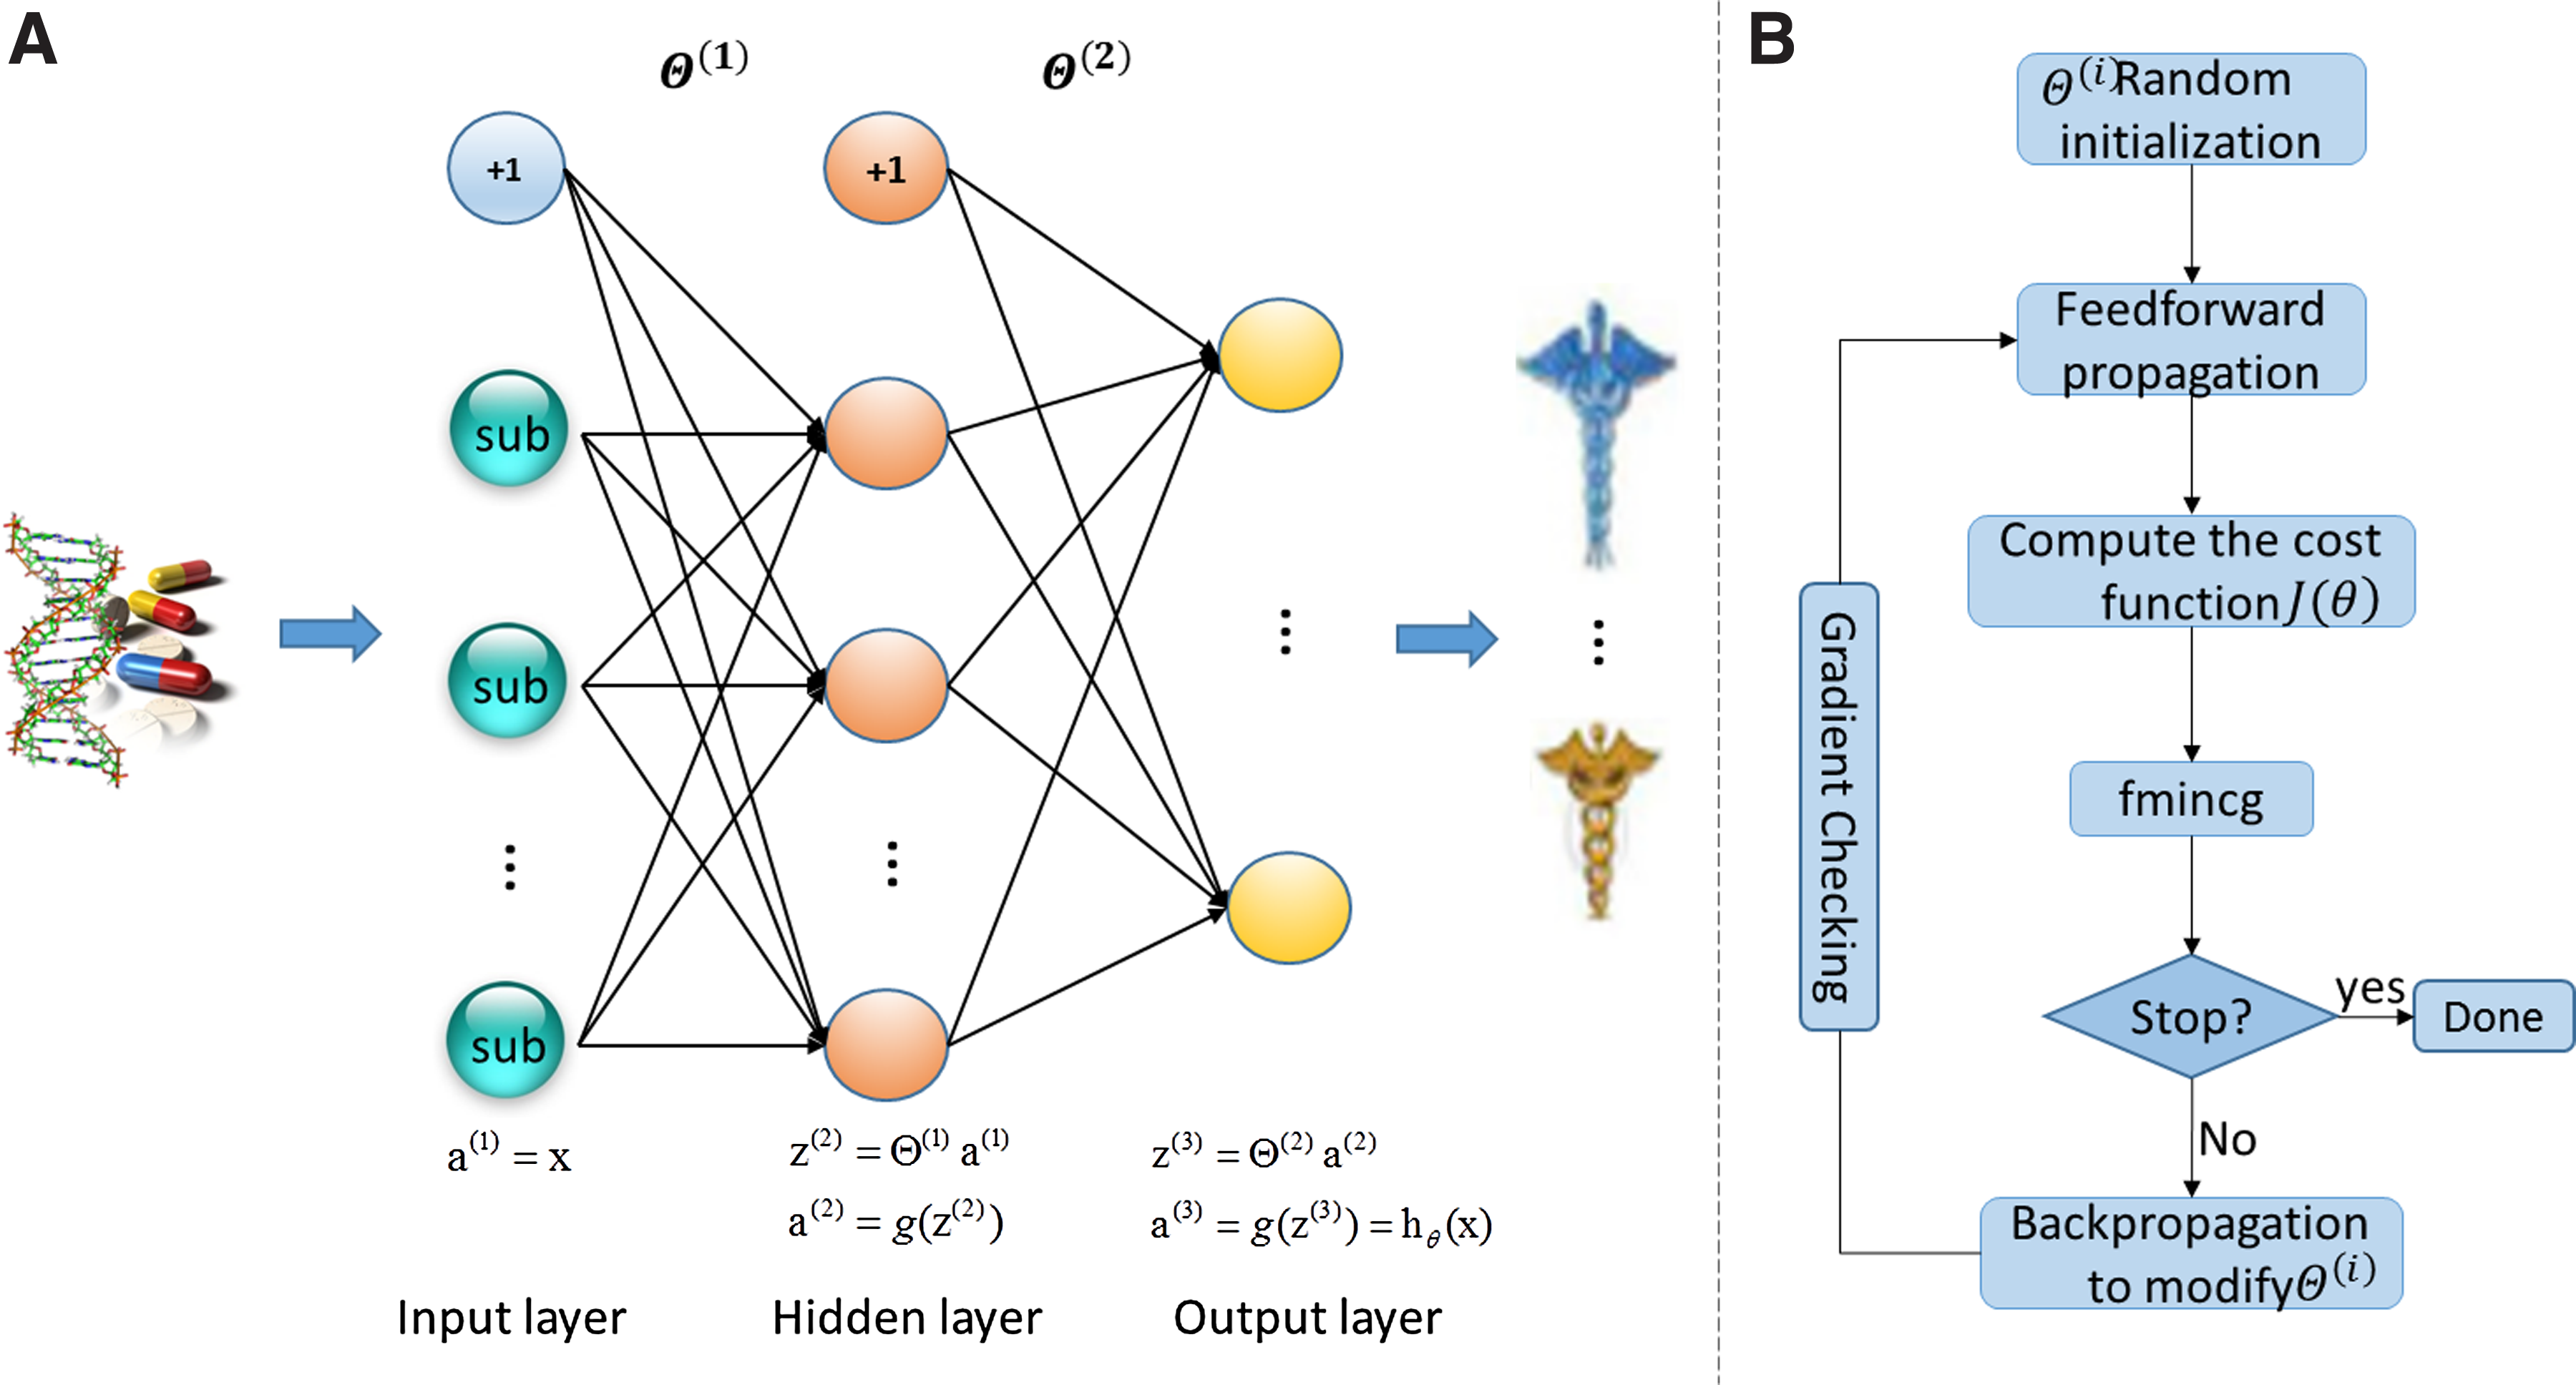
Neural network model
First, we implement feedforward propagation to get the cost of using the random initialized 
where m is the number of train sample and q is the number of units in output layers. λ is the regularization parameter.
Then we implemented the backpropagation algorithm to compute the gradients of the parameters for the neural network. For each node j in layer l, we would like to compute an “error term”
We put the modified θ into the iterative operation of feedforward propagation and backpropagation, as you can see in the workflow in Figure 2B. For a complex model like NN, there may be some problems not easy to detect, which means that, although the cost J(θ) seems to be gradually decreased, the final result may not be the optimal solution. To solve this problem, we used the advanced optimizer fmincg to train the neural network by minimizing the cost function J(θ) in iteration, and the numerical gradient checking to perform gradient checking on parameters. In our experiment, the optimal iteration is 48 and we obtain the final projective weight matrix
For a new given drug, we use feedforward propagation to compute the output layer with the optimal
3.2. Other possible prediction methods
3.2.1. Sparse canonical correlation analysis
Suppose that we have a set of n drugs with the p-dimensional chemical profiles, and the q-dimensional side-effect profiles. X denotes the n × p chemical profiles matrix defined as
More details about the SCCA algorithm can be found in the article by Pauwels et al. (2011). Here we make a brief review. Consider that
The goal of SCCA is to find weight vectors α and β to maximize ρ. It can be obtained by penalized matrix decomposition (PMD) of the matrix Z=XTY. Each time of iterating the PMD, we got a pair of weight vectors (α,β). Experiments show that it works best when iterations is 80. Therefore, we have
When predicting the side-effect profile for a new drug
3.2.2. Kernel regression
The use of KR algorithm was proposed to predict drug side effect in the article by Yamanishi et al. (2012). For a given new drug
where ɛ is a noise vector and
If the jth element in
3.3. Performance assessment
Both SCCA and KR have been proved effective on predicting drug's side effects (Pauwels et al., 2011; Yamanishi et al., 2012). Here we use AUC score and AUPR score to measure the performance of the three methods and SVM (support vector machine) as a comparison. These methods took a fivefold cross-validation on the same dataset with different features (chemical substructures, target protein, molecular descriptors, and their combine). We obtain the dataset from Mizutami et al. (2012) as the gold-standard data in the cross-validation experiment.
Side-effect prediction is the case in which the number of positive examples is much lower than that of negative examples. Therefore, the AUPR score is a bit lower than other cases. From Tables 1 and 2 we can see that the NN method outperforms other methods using any data features, which means that it is more stable and better robust.
SVM, support vector machine; SCCA, sparse canonical correlation analysis; KR, kernel regression; NN, BP neural network.
The global ROC curves and PR curves were drawn for each method in Figure 3. Compared with the other three methods, the reason for NN of having a more effective prediction can be explained as follows: the NN's network structure can dig deeper information, which makes it free from the limitation of only using original features of the data. Meanwhile, the iterative of feedforward propagation and backpropagation to modify parameters can help to achieve the optimal solution.
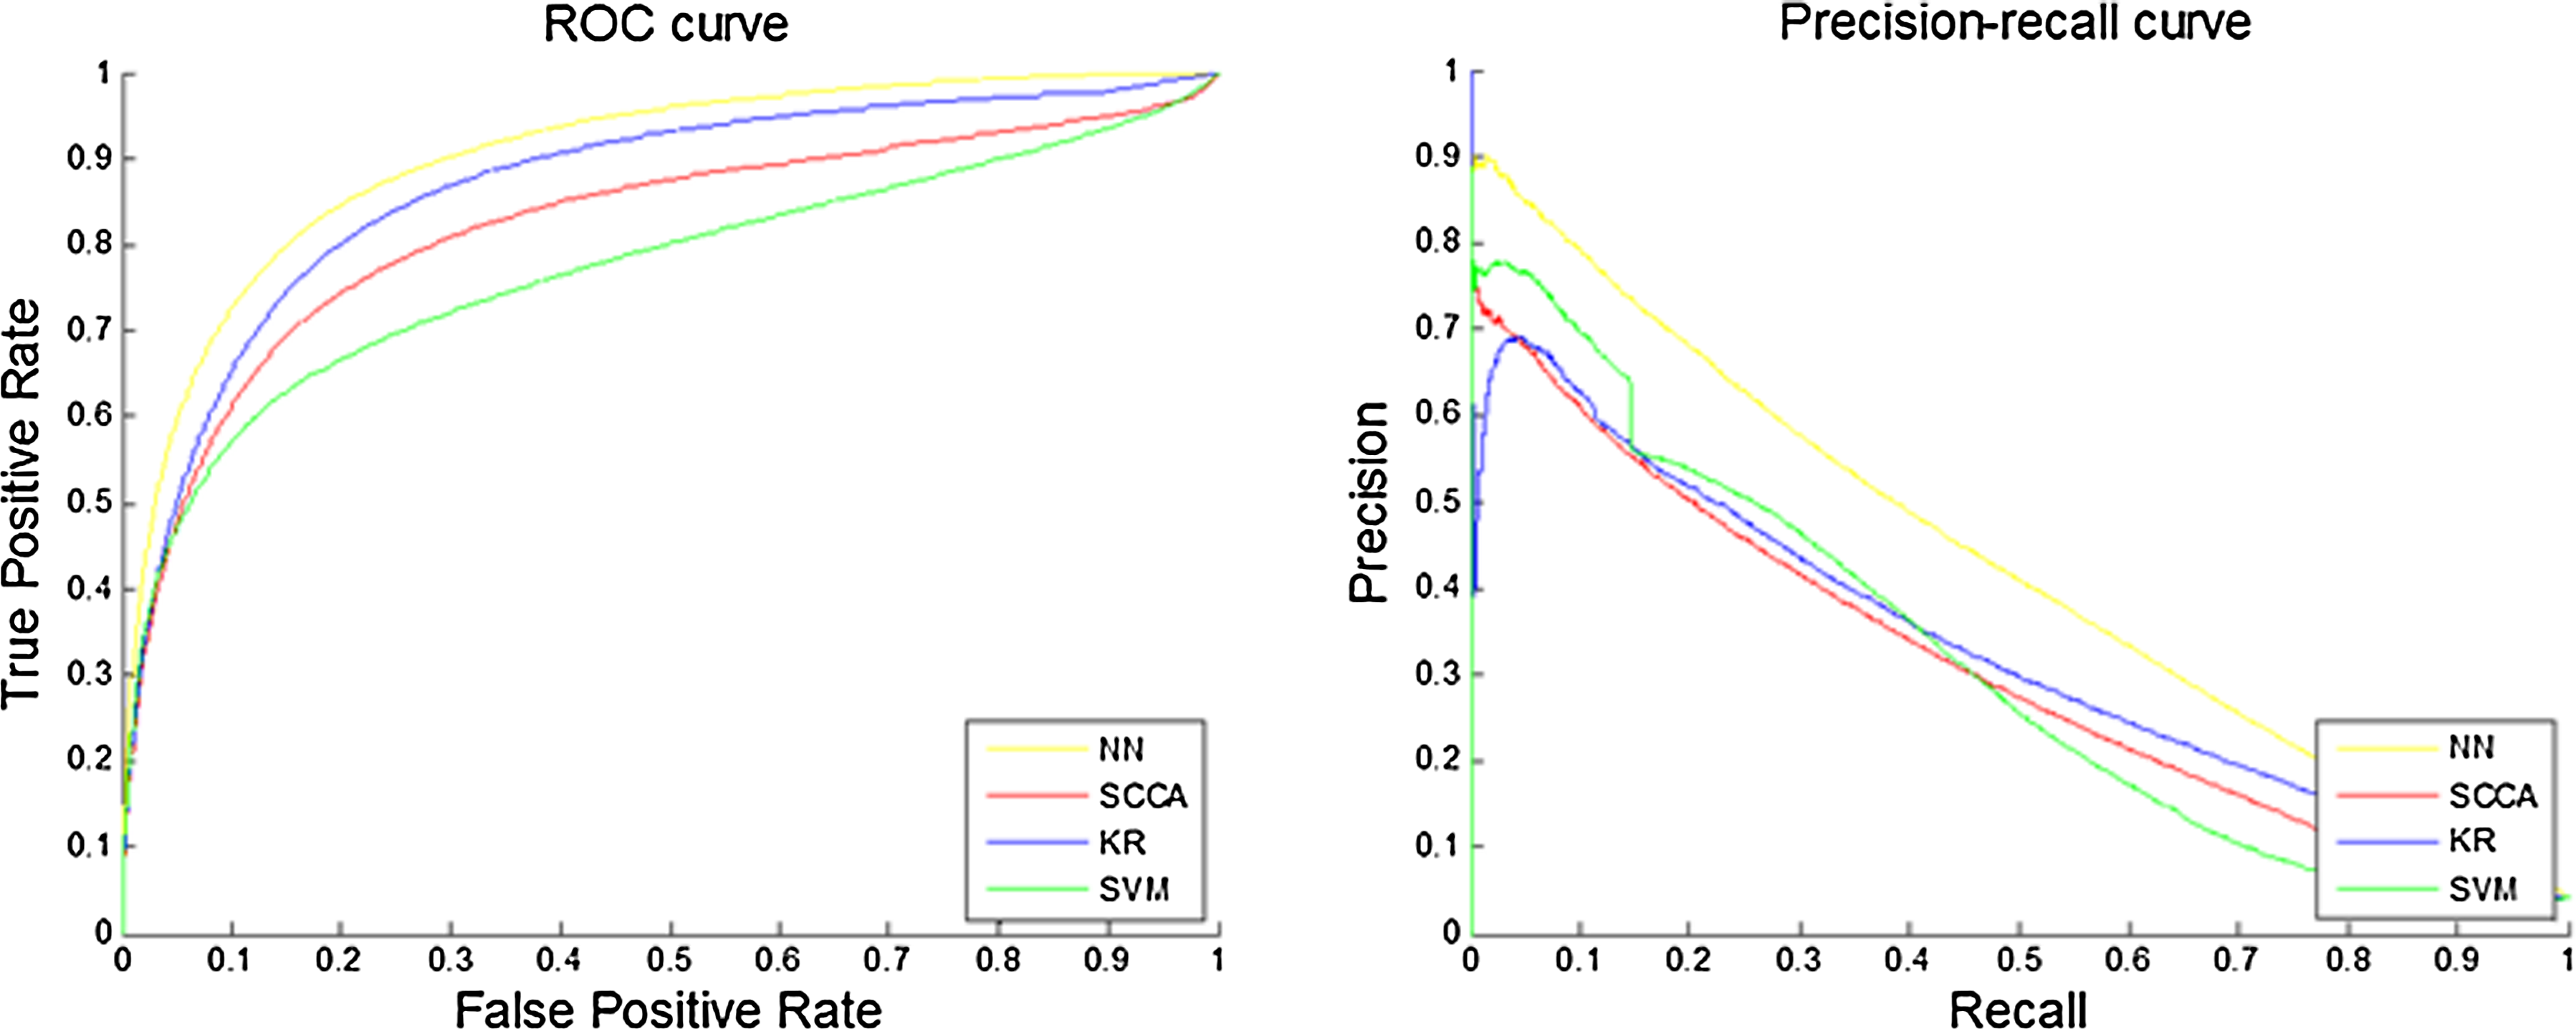
The ROC (receiver operating characteristic) curves and PR (precision-recall) curves for four methods under fivefold cross-validation using chemical substructures as features.
4. Results and Discussion
4.1. Implemented tool for the proposed method
Based on the above prediction algorithm, we developed a tool named DSEP for drugs' ADR prediction. Some tools or databases have been constructed to predict or inquire drug–ADR associations (for instance, Cheng et al., 2013; Juan et al., 2015). However, these tools or databases have limitations, which are overcome by DSEP. They only allow the user to search predicted ADRs of drugs that are belong to their dataset. The users will get a result of “No matches found” if they try to inquire a drug that is not in the records, let alone searching and predicting ADRs for drugs under development that have not been included into any database. To conquer those limitations, the DSEP user interface offers two analysis services: database analysis service and molecular file analysis service to analyze the new drugs to be predicted in batches (hereinafter refer to as the new drug). User tutorial can be viewed from Zhenran, J., 2015.
4.1.1. Input
The user can select one of the two analysis services. As Figure 4A shows, the database analysis service needs the user to import a list of the drugs' database ID either by copy–paste or as a text file. For instance, 5287543 is a PubChem ID, DB00413 is a DrugBank ID, and D07567 is a KEGG ID. For the molecular file analysis service, the user can upload molecular files of the new drug or just drag the files and drop them into the DSEP screen. The molecular file format can be *.smiles, *.mol, *.sdf, and *.Inchi.
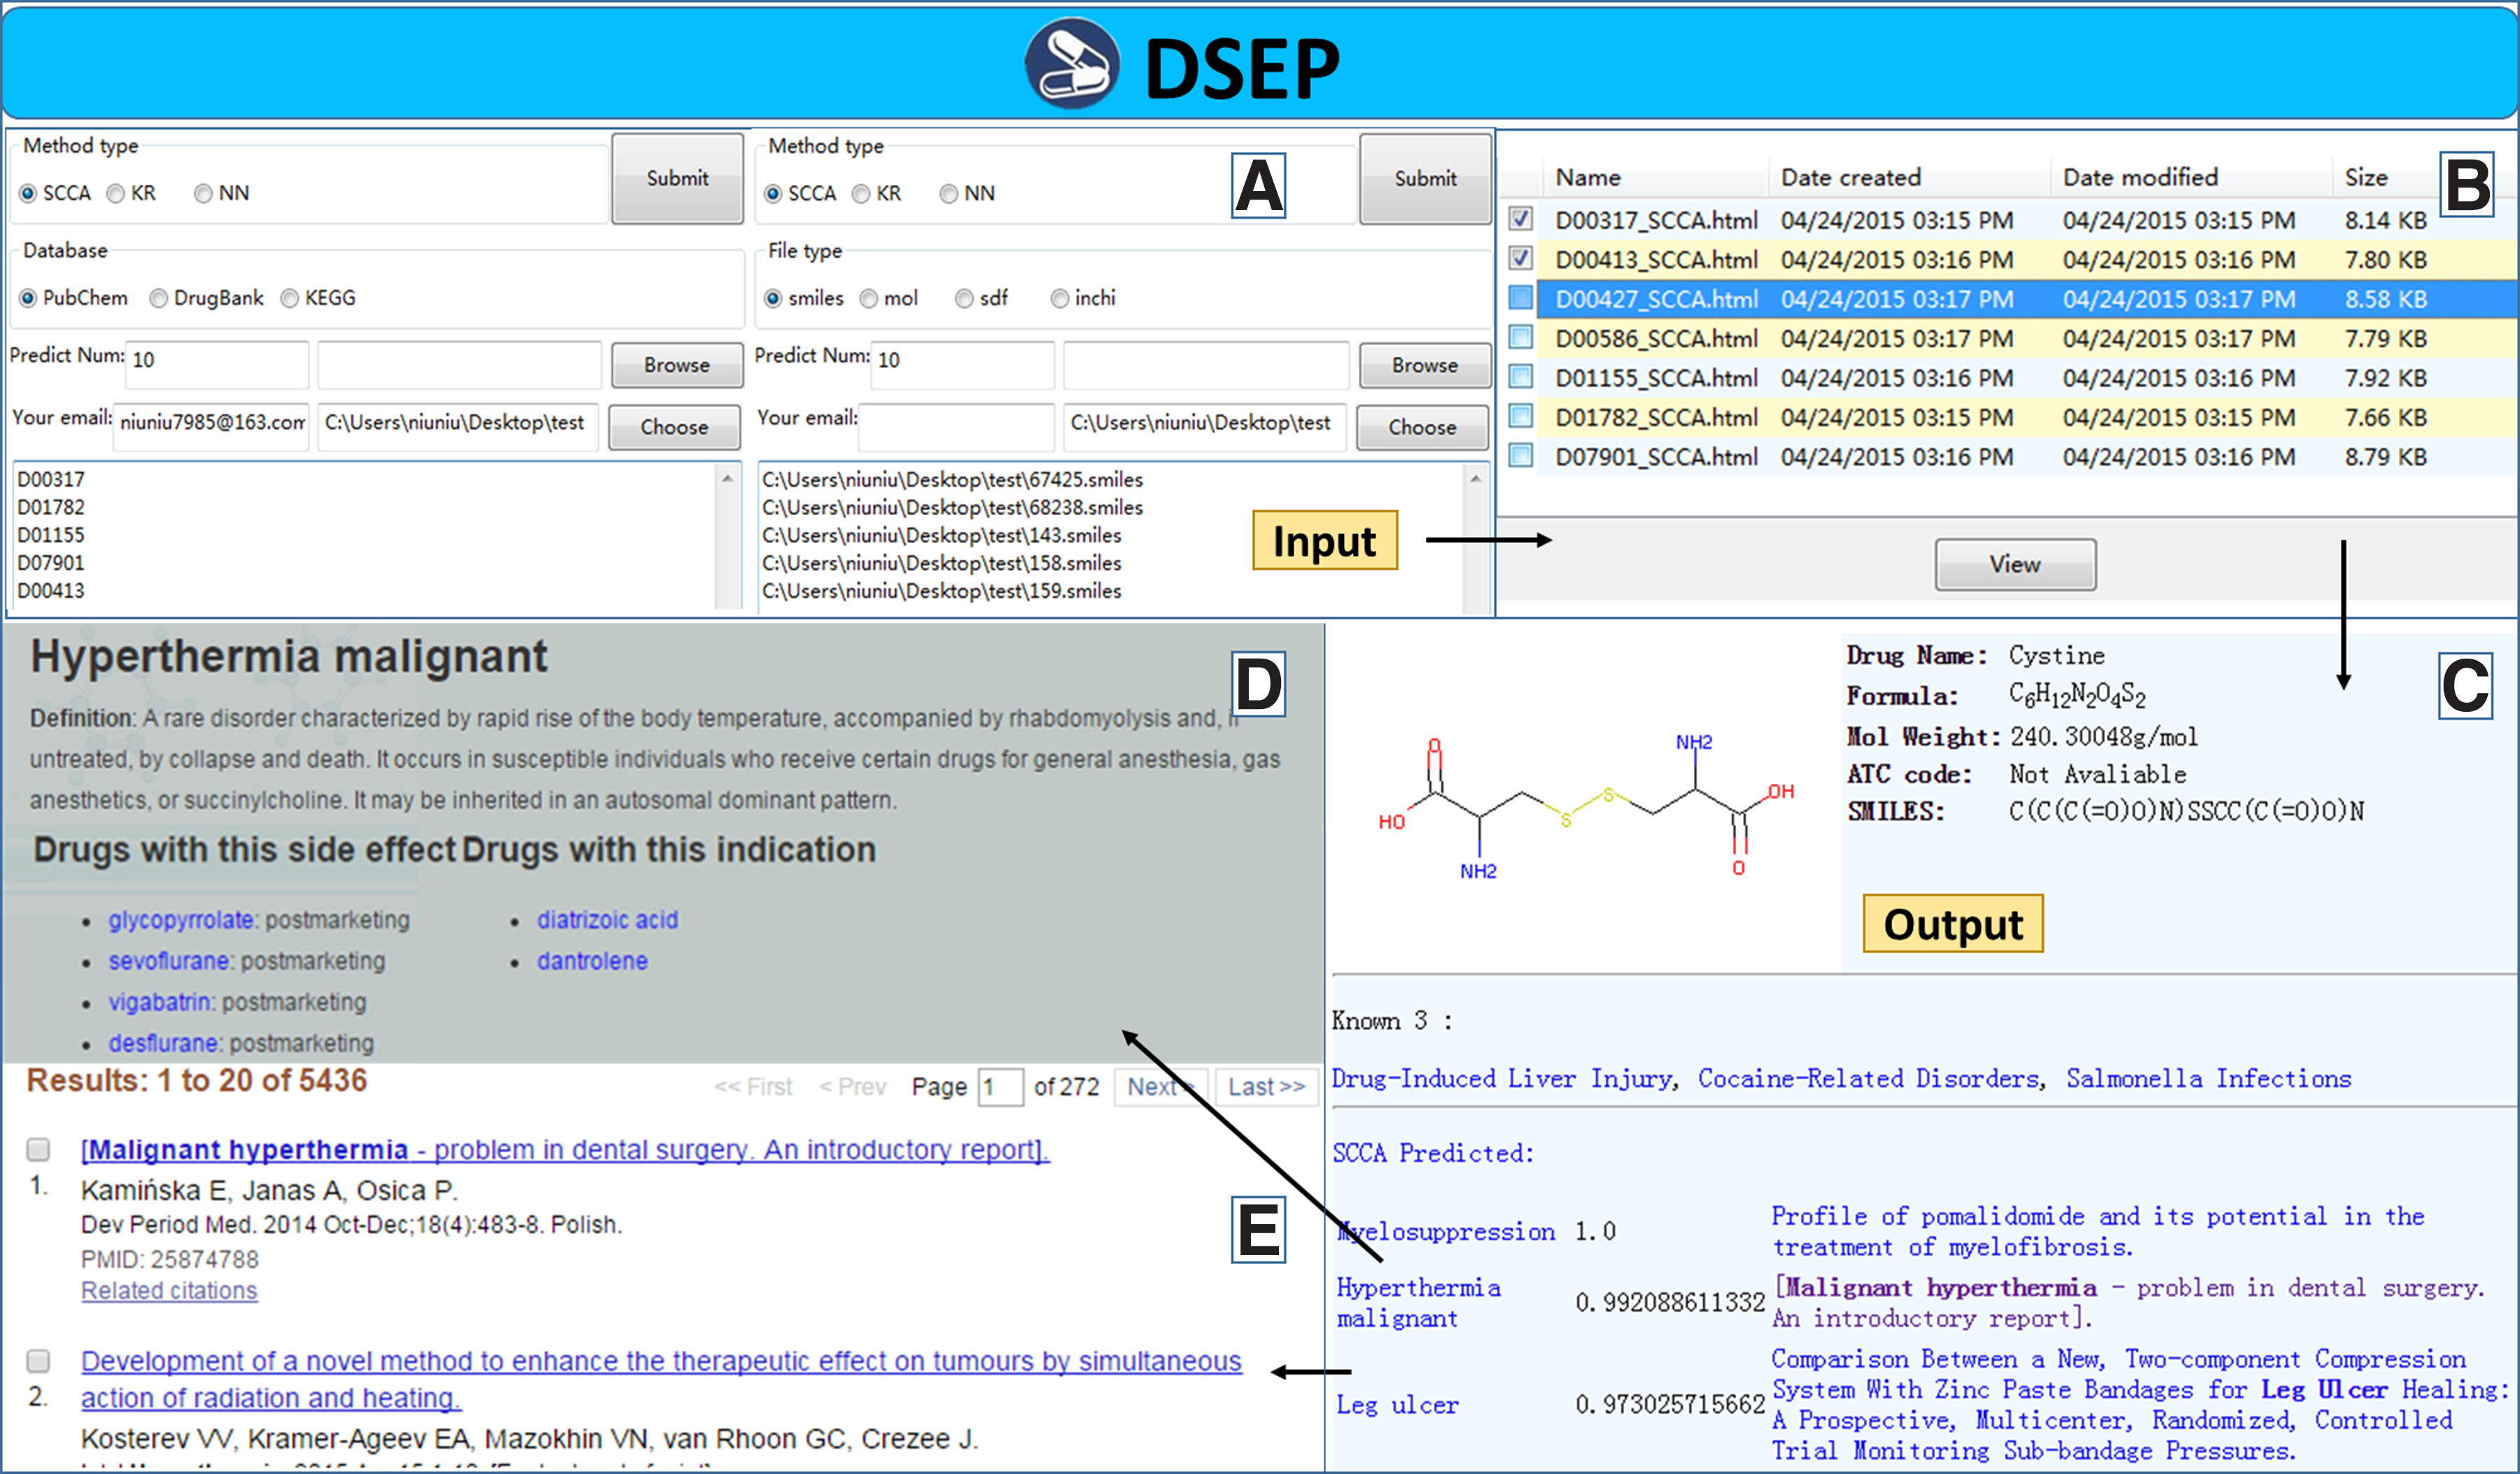
Screenshots and output result of DSEP.
4.1.2. Process
For each compound from the batch input of DSEP, the compound's information is analyzed by internal model of DSEP. We have modified the source code of a third-party open source package named CINFONY to fit in with the DSEP for calculating the 881 chemical substructure fingerprints (O'Boyle and Hutchison, 2008). Therefore, each drug is represented by a 881-dimensional feature profiles. Then the method that the user has chosen will use the analyzed chemical substructures as chemical profiles for the new drug and begin to predict the drug's side effect.
4.1.3. Output
DSEP will generate an HTML result file for each drug as shown in Figure 4C. We choose HTML to be the file format because it can show figure, text, and hyperlinks at the same time. DSEP will visualize the two-dimensional structure of the new drug and analyze its basic information, including drug's name (for database analysis service), drug's molecular formula, drug's molecular weight, drug's ATC codes (if any), and drug's smiles. For the database analysis service, if the new drug has been marked with an MeSH term in the database, then DSEP will obtain the new drug's recorded side effects by the drug's MeSH ID. Every side effect predicted by DSEP for the new drug has three elements: the name of the side effect, the score of the side effect, and the latest related literature about this side effect. The user can click on the side-effect name to get more information, and click on the literature to see more details.
4.2. Comprehensive side-effect prediction for new drugs
In order to make a comprehensive prediction for side effects, we focused on 230 drugs in PubChem for which side-effect information was not available in the SIDER database. It is hard to prove that a given drug does not cause a certain side effect. Therefore, we try to notarize some side effects that can be confirmed by a database or literature report. We checked the 230 drugs' DSEP predicted results with the record in the CTD database (Davis et al., 2011), 212 drugs' top 50 side effects predicted by NN have records that can be confirmed by CTD, while 193 drugs predicted by KR and 70 drugs predicted by SCCA can be confirmed.
Take terfenadine (compound ID is 5405 in PubChem, also known as Seldane or Aldaban; its active metabolite is fexofenadine) for instance; it is a selective histamine H1-receptor antagonist devoid of central nervous system depressant activity. The drug was used for allergy. Table 3 shows the side effects that confirmed in the top 30 scoring elements predicted by DSEP, where “*” represents that the corresponding side effect was confirmed by the CTD database and “∼” represents that the corresponding side effect was confirmed by the literature report.
“*” Represents that the corresponding side effect was confirmed by the CTD database, and “∼” represents that the corresponding side effect was confirmed by the literature report.
From Table 3 we can see that SCCA, KR, and NN successfully predicted 5, 3, and 6 side effects confirmed by CTD (terfenadine's CTD ID is D016593). In addition, five SCCA-predicted side effects (dry mouth, blurred vision, dizziness, drowsiness, and edema) can be confirmed by the literature (Mattila and Paakkari, 1999; Miyabe et al., 2003; Zhu et al., 2014), six KR-predicted side effects (dry mouth, blurred vision, dizziness, head ache, nausea, and drowsiness) can be confirmed by the literature (Markham and Wagstaff, 1998; Mattila and Paakkari, 1999; Miyabe et al., 2003), and eight NN-predicted side effects (dry mouth, blurred vision, dizziness, headache, nausea, drowsiness, edema, and hypotension) can be confirmed by the literature (Markham and Wagstaff, 1998; Usui et al., 1998; Mattila and Paakkari, 1999; Miyabe et al., 2003; Zhu et al., 2014). Side effects tachycardia, dry mouth, blurred vision, dizziness, and drowsiness were the common predictions by three methods. It can also be learned that the ability of NN to predict side effect is better than the other method no matter in global accuracy or local accuracy.
We further detect the relationship between side-effect profiles and chemical substructure profiles mined by the NN method. Take tachycordia for instance; it is one of the six CTD-confirmed side effects of terfenadine predicted by NN. From the 212 drugs that ADRs predicted by NN can be confirmed by CTD, we check the intersecting chemical substructure of drugs predicted to have tachycardia and find out that they all have common chemical substructures (0, 1, 9, 10, 283, 284, 332, and 344 as shown in Figure 5). We consider the common chemical substructures as a functional group that may be related with the mechanism of action of causing tachycardia. To validate this conjecture, we found aminolevulinic acid (compound ID is 137 in PubChem), which does not belong to the 230 drugs we focused on and has the functional group of 0, 1, 9, 10, 283, 284, 332, and 344 within its chemical substructures. It can be confirmed that aminolevulinic acid (CTD ID is D000622) correlates with tachycardia from CTD and literature (Waidelich et al., 2001). This in turn proved the advancement of NN digging deeper information from the drug–ADR–chemical structure network.
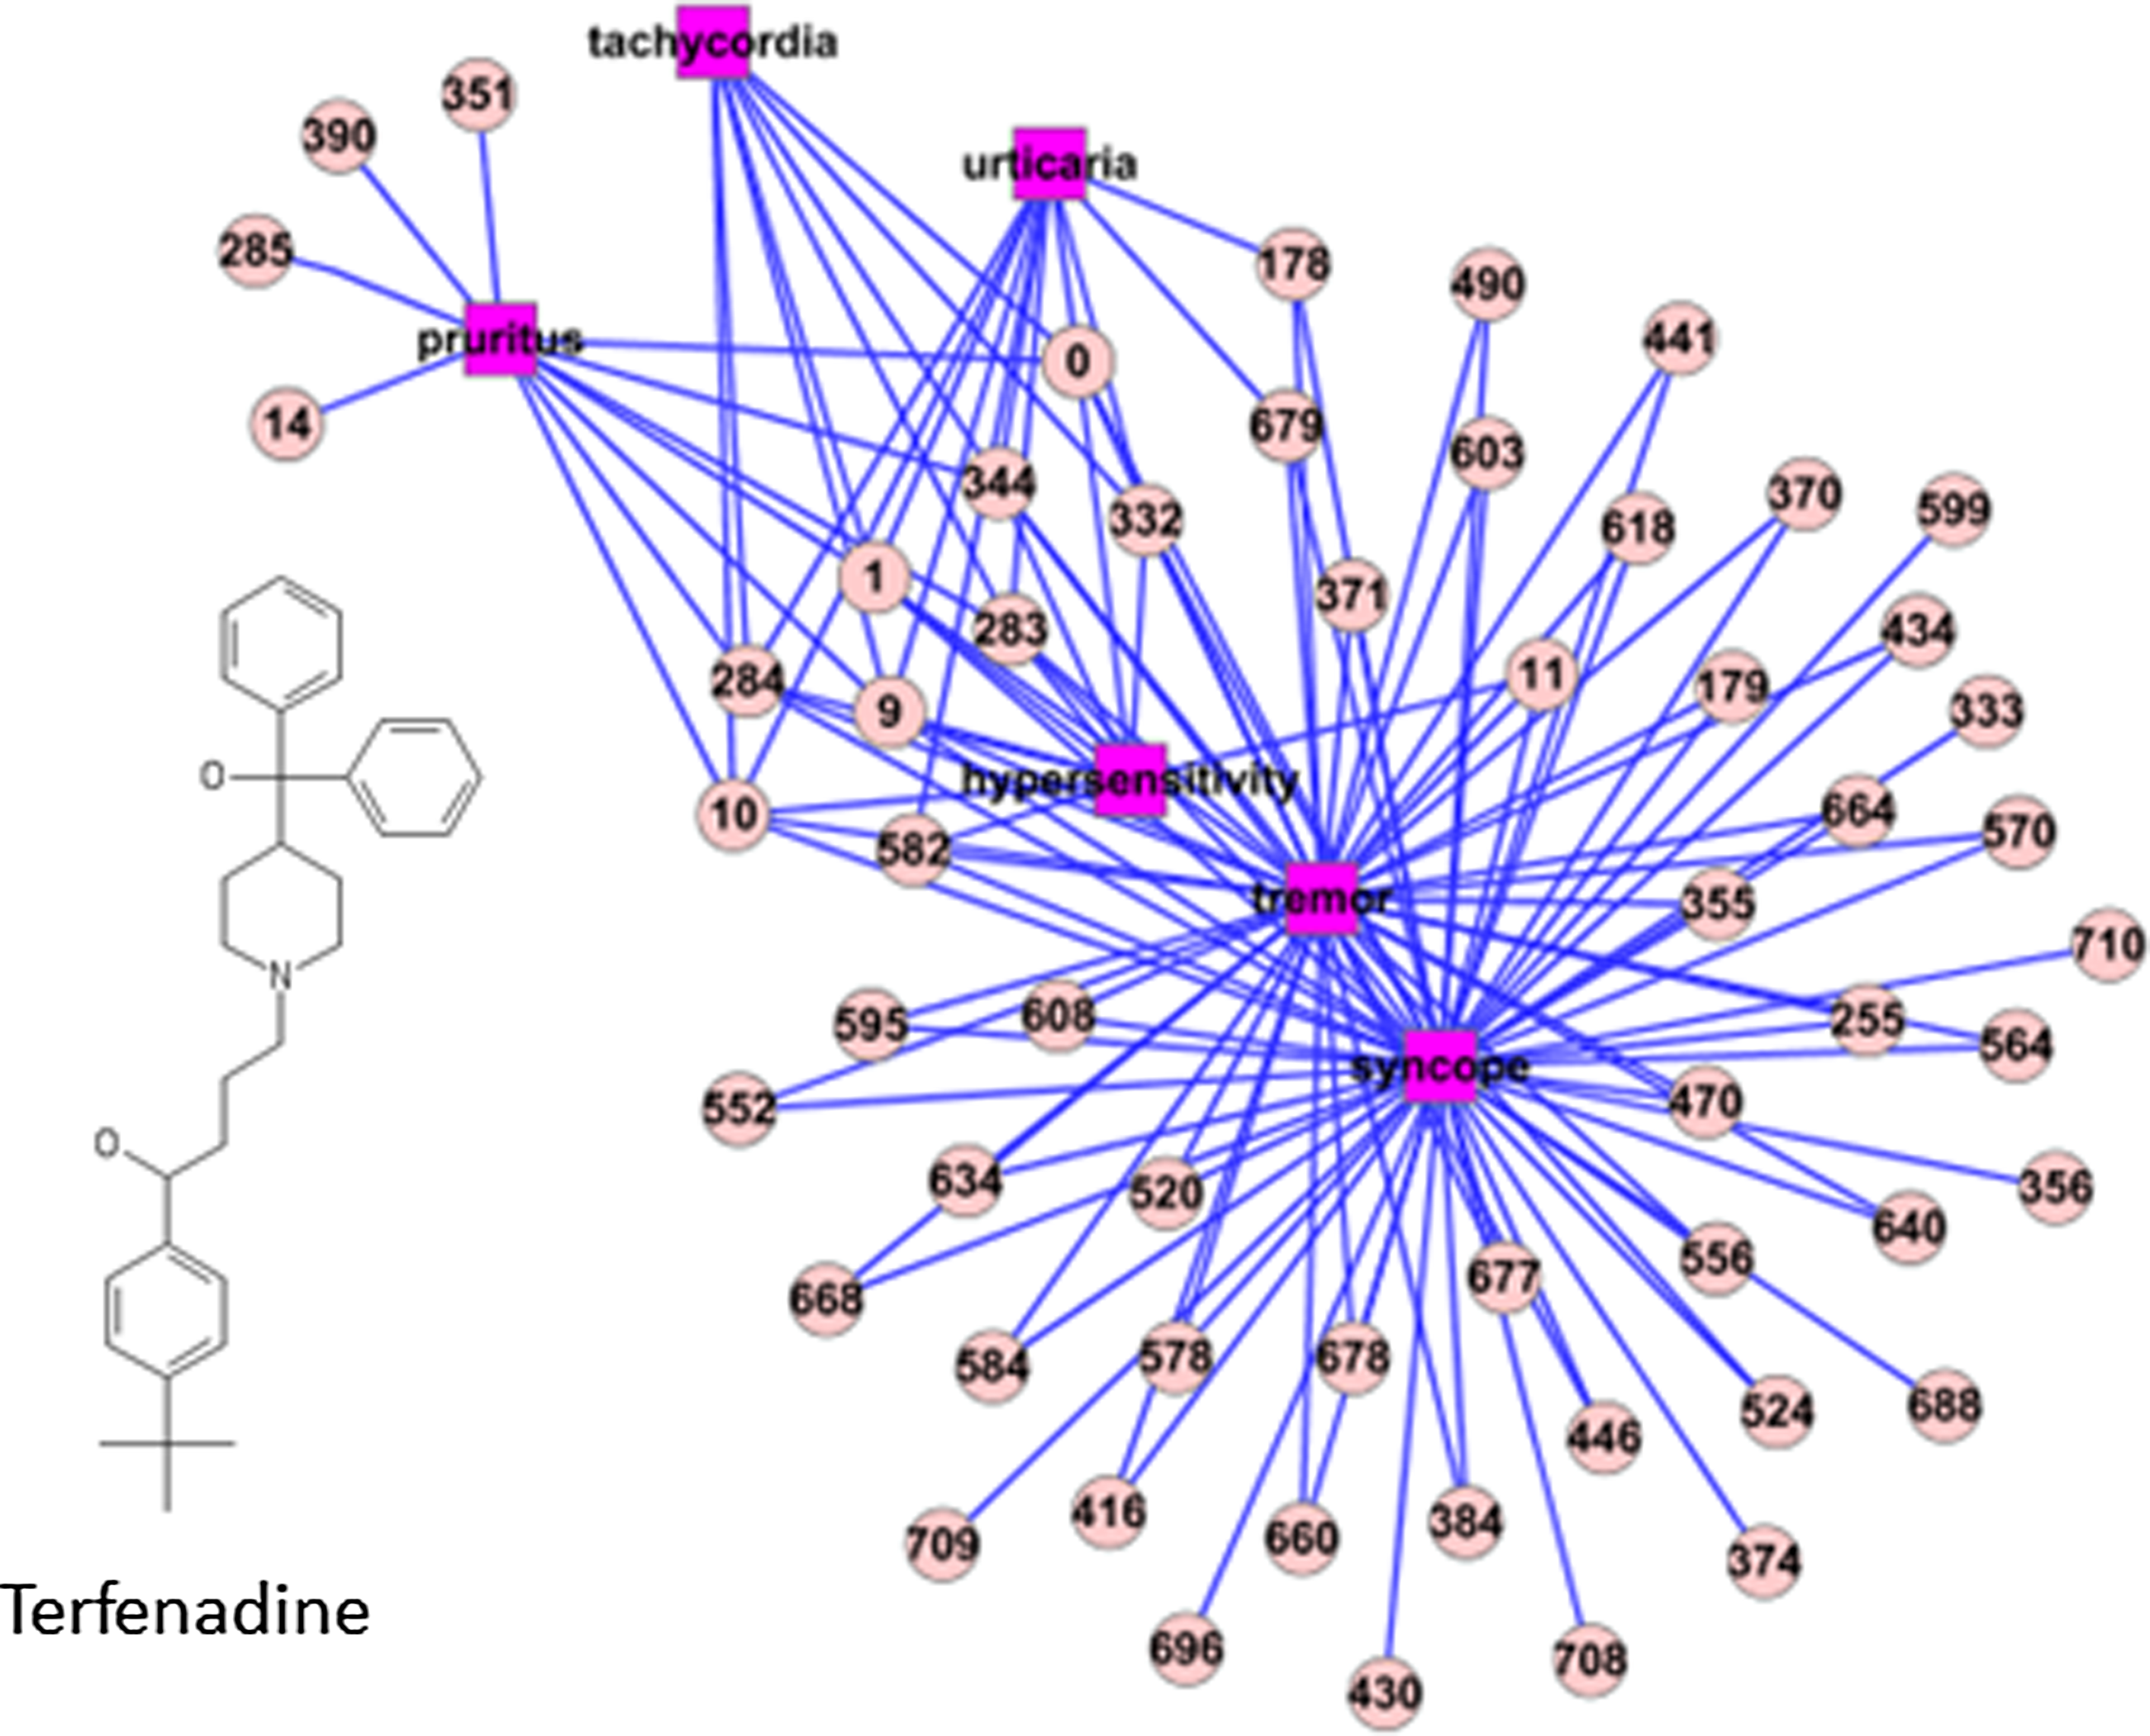
Adverse drug reaction–chemical substructure network of terfenadine.
Retinoic acid (compound ID is 444795 in PubChem) is used in the treatment of psoriasis, acnevulgaris, and several other skin diseases. It has also been approved for use in promyelocytic leukemia. Six of the top-20-ranked NN-predicted side effects can be confirmed by CTD (hypotension, pruritus, nausea, headache, vomiting, and erythema).
Floxuridine (compound ID is 5790 in PubChem) is an antineoplastic antimetabolite that is metabolized to fluorouracil when administered by rapid injection. It has been used to treat hepatic metastases of gastrointestinal adenocarcinomas and for palliation in malignant neoplasms of the liver and gastrointestinal tract. Among the 25 top-ranked side effects predicted by the NN method, 8 can be confirmed by CTD (leukopenia, thrombocytopenia, abdominal pain, vomiting, hypersensitivity, fatigue, nausea, and anorexia).
Escitalopram (compound ID is 146570 in PubChem) is used in depressed patients who also suffer from tardive dyskinesia in preference to tricyclic antidepressants, which aggravate this condition. Five of the top-20-ranked side effects predicted by the NN method can be confirmed by CTD (dizziness, abdominal pain, nausea, hypotension, and constipation).
There are many other drugs analyzed by the NN method that can be confirmed by CTD as well as literature reports. These confirmations imply that the NN method is an effective prediction method that made DSEP a reliable tool to anticipate side effects for uncharacterized drugs.
5. Conclusions
In this article, we proposed a novel method to predict potential side effect for drugs. High AUC value of 0.8927 and the AUPR of 0.4143, which is higher than other previous methods, imply that the proposed method is useful for drug side effect prediction. We then developed DSEP, a tool based on the method we proposed to predict side effects for drugs and compounds. Besides analyzing drugs from the commonly used database, as far as we know, no other tools except DSEP are able to analyze potential side effects from chemical files of drugs under development that do not exist in any database. The molecular file format for the new compound is diversiform, which provides convenience to the user. This work is very helpful during drug discovery and drug side-effect evaluation.
We intend to further develop DSEP by constructing a web server. Our focus in designing DSEP is to predict ADRS for drugs in batches so that it is more stable when operating on the client side. However, it would be more convenient to use a web server for those users who only need to anticipate a small amount of drugs. We also intend to select a specific disease and try to anticipate ADRs for drugs related with the disease. Different features of drugs have been integrated in chemical and biological spaces, including chemical substructures, molecular descriptors, chemical entities, scaffolds, and drug bounding targets. It would be interesting to put the phenotypic similarity of side effects based on their MeSH terms into the network to facilitate the mechanistic interpretations.
Footnotes
Acknowledgments
This work was partially supported by National Basic Research Program of China (Grant No. 2012CB910400), National Natural Science Foundation of China (Grant No. 81330049), National Major Scientific and Technological Special Project for “Significant New Drugs Development” (2013ZX09507001), and the Science and Technology Commission of Shanghai Municipality (14DZ2270100).
Author Disclosure Statement
The authors declare that no conflicts of interest exist.