
Abstract
Abstract
Increasing evidence indicates that different morphological types of cell death coexist in the brain of patients with Parkinson's disease (PD), but the molecular explanation for this is still under investigation. In this study, we identified perturbed pathways in two different cell models for PD through the following procedures: (1) enrichment pathway analysis with differentially expressed genes and the Reactome pathway database, and (2) construction of the shortest path model for the enriched pathway and detection of significant shortest path model with fitting time-course microarray data of each PD cell model to structural equation model. Two PD cell models constructed by the same neurotoxin showed different perturbed pathways. That is, one showed perturbation of three Reactome pathways, including cellular senescence, chromatin modifying enzymes, and chromatin organization, while six modules within metabolism pathway represented perturbation in the other. This suggests that the activation of common upstream cell death pathways in PD may result in various down-stream processes, which might be associated with different morphological types of cell death. In addition, our results might provide molecular clues for coexistence of different morphological types of cell death in PD patients.
1. Introduction
P
Since the discovery that people who are intoxicated with 1-methyl-4-phenyl-1, 2, 3, 6-tetrahydropyridine (MPTP) develop a syndrome nearly identical to PD (Langston et al., 1983), MPTP has been widely used as an animal model to replicate human PD symptoms in nonhuman primates and rodents. MPTP can rapidly cross the blood–brain barrier, and MPTP inside the brain is converted by MAO-B (monoamine oxidase) into a neurotoxin precursor, 1-methyl-4-phenylpyridinium (MPP+), which causes selective destruction of dopaminergic neurons in the SNpc (substantia nigra pars compacta) (Sharma and Taliyan, 2015). MPP+ induces neurotoxicity primarily by inhibiting complex I of the mitochondrial electron transport chain, resulting in ATP depletion and increased oxidative stress (Castro et al., 2012; Sharma and Deshmukh, 2014). Several cell culture studies of PD have reported other pathological effects of MPP+, which include synaptic dysfunction, α-synuclein aggregation, impairment of retrograde/anterograde transport, mitochondrial swelling and loss of cristae, upregulation of autophagy, lysosomal expansion, lysosomal dysfunction, and capase 3-independent cell death (Dagda et al., 2013). Thus, MPP + has been commonly used in experimental PD both in vitro and in vivo models.
Increasing evidence indicates that different morphological types of cell death coexist in the brain of PD patients, all of which may result from the activation of common upstream programmed cell death pathways that are mitochondrion dependent (Perier et al., 2012). In this study, we identified pathways associated with MPP+-induced neuronal cell death in two types of human neuroblastoma cells, that is, SH-SY5Y and SH-EP cells, by using time-course microarray data for the estimation of cell type–specific effects by MPP+ treatment. Neuroblastoma cells have been categorized into broad groups that have distinct morphologies and biochemical properties: neuroblast-like N-type cells (e.g., SH-SY5Y), which are clonigenic and tumorigenic and grow rapidly in cultures; S-type cells (e.g., SH-EP), which are not; and I-type cells, which have characteristics of both N- and S-types (Do et al., 2011).
Biological pathway databases such as Kyoto Encyclopedia of Genes and Genomes (Kanehisa et al., 2012) and Reactome (Croft et al., 2014) can capture what is already known about the interplay of genes, proteins, and small molecules using a data model that is accessible to computation. Here, we focused on comparison of perturbed pathways between SH-SY5Y and SH-EP cells using the data model of Reactome, whose central class is a Reaction, and subclasses of Reaction depict these core biological events. Reactions are grouped into pathways, which in turn are assembled into a hierarchy of biological processes. To identify perturbed Reactome pathways from time-course microarray data, we employed structural equation model (SEM) with shortest path model (SPM) for each Reactome pathway as our previous approach (Pepe and Do, 2015). However, in this study we added time, an additional variable to the SEM for the consideration of time effect on the pathway. Perturbed pathways in SH-SY5Y and SH-EP cells showed difference. That is, chromatin/nucleosome modification-related pathways showed significant perturbation in SH-SY5Y cells, while metabolism disorder-related pathways showed significant perturbation in SH-EP cells. This suggests that neuronal cell death by MPP+ treatment may occur via various down-stream processes, which might be dependent on cell type or condition.
2. Methods
2.1. Microarray data
Microarray data were obtained from our previous reports (Kim et al., 2013; Do, 2014) and included whole genome expression level at eight time points (0 [control] and 0.5, 1.5, 3, 6, 9, 12, and 24 h) after MPP+ treatment for human neuroblastoma cells SH-SY5Y and SH-EP. The number of replicated microarray data at each time point was three and two for SH-SY5Y and SH-EP cells, respectively. After log2 transformation, the expression data were normalized using quantile normalization. After filtering redundant probes, the number of common probes in two groups of experimental data, SH-SY5Y and SH-EP, was 30,483 and had one-to-one mapping of Entrez gene identifier.
2.2. Identification of differentially expressed genes from time-series microarray data
To find differentially expressed genes (DEGs) from time-series microarray data, a Bioconductor R package called maSigPro was employed (Conesa et al., 2006). This program uses a two-step regression approach in which experimental groups are defined by dummy variables. The first regression adjusts a global model and serves to select DEGs, while in the second step a variable selection strategy is applied to identify significant profile differences between experimental groups. In this study, there are no time-series expression data of control group, and we considered each set of time series data separately and found out the genes that show significant regression coefficient only for the variable time with third degree.
2.3. Identification of enriched pathways for significant genes and construction of their shortest path models
Enriched pathways for the set of DEGs during time-course were examined with a Bioconductor R package called ReactomePA, which allows enrichment analysis based on the Reactome pathways (Croft et al., 2014). After identification of enriched pathways in the set of DEGs, the connected structures of DEGs within them were surveyed by considering each pathway as a directed graph. All the shortest paths among differential genes for each enriched pathway were detected with the function get.shortest.paths() of the R package igraph and fused to construct the SPM for the corresponding pathway, as used in our previous work (Pepe and Do, 2015).
2.4. Measurement of modularity for shortest path model
The modularity for each SPM was estimated by the function modularity() of the R package igraph. When the division of the shortest pathway model produces a modularity value greater than 0.4, the community in the SPM was surveyed by using the walktrap.community() function of the R package igraph, and each community or module detected in the shortest model is tested separately.
2.5. Estimation of shortest path model/module showing perturbation during time-course
We evaluated SPM/module showing significant perturbation during time-course by using SEM. For this test, the first is to specify a model describing the causal relationships among variables. In general, all the variables can be represented as a system of structural linear equations as showed below:
and a covariance structure:
The system of linear equations considers every ith node (Yi), belonging to the set of variables V, as characterized by uni-directed relationships with its “parents” pa(i), defined by path coefficients (βij). The covariance structure describes the bi-directed relationships between the unmeasured component of the ith node (Ui) and its “siblings” sib(i), quantified by their covariance (ψij). For each model we fitted two systems of linear equations, one in which we incorporated time and the other we did not. The system of linear equations with time is showed below:
where the only difference in the equation, compared to the first system, is that we add the influence of time for each gene in the model. αi represent the influence of time on the node Yi. For the estimation of the parameters θ = (βij; ψij, αi) the maximum likelihood estimation was used by the R package lavaan (Rosseel, 2012). To find the significant module/pathway models, the following omnibus test was performed:
where
2.6. Disease ontology enrichment analysis
To discover disease associations of significant genes, disease ontology (DO) enrichment analysis was carried out with the R package DOSE (Yu et al., 2015), which provides semantic similarity computations among DO terms and genes, and allows biologists to explore the similarities of diseases and of gene functions in disease perspective.
3. Results and Discussion
3.1. Identification of differentially expressed genes in two sets of time-course microarray data
The time-course microarray data for SH-SY5Y and SH-EP cells were obtained from our previous reports (Kim et al., 2013; Do, 2014). The microarray data consisted of eight time points, 0, 0.5, 1.5, 3, 6, 9, 12, and 24 h, after MPP+ treatment. The replicate number at each time point was three and two, respectively, for SH-SY5Y and SH-EP cells. To identify DEGs from time-course microarray data, an R package called maSigPro (Conesa et al., 2006) was employed. Before use of the maSigPro program, time-course microarray data were log2 transformed and normalized. After filtration of redundant probes, the common probes between two groups of time-course data (SH-SY5Y and SH-EP cells) were considered for further analysis. The total number of common probe was 30,483 and showed one-to-one mapping gene symbol and Entrez gene identifier. Since both data sets had no time series expression data for control groups, that is, SH-SY5Y and SH-EP cells without MPP+ treatment, MaSigPro was applied separately for each time-course data of SH-SY5Y and SH-EP cells. That is, we applied MaSigPro for single group of time-course data and found genes that show significant regression coefficient only for the variable time with third degree. If the regression coefficients of a gene are significant different from 0, the gene is considered as DEG.
The number of DEGs was 406 for SH-SY5Y, and 3,075 for SH-EP cells. The percentage of DEGs in the total genes was 1.3% and 10%, respectively, for SH-SY5Y and SH-EP cells. This suggests that SH-EP cells might be more reactive to MPP+ treatment than SH-SY5Y cells. The number of common DEGs between SH-EP and SH-SY5Y cells was 172 (Fig. 1). The common DEGs might be related to core mechanism of MPP+-induced neuronal cell death. Pearson correlation coefficients for common DEGs between gene expression profiles of SH-SY5Y and SH-EP cells were estimated and 66 genes with high coefficient values (
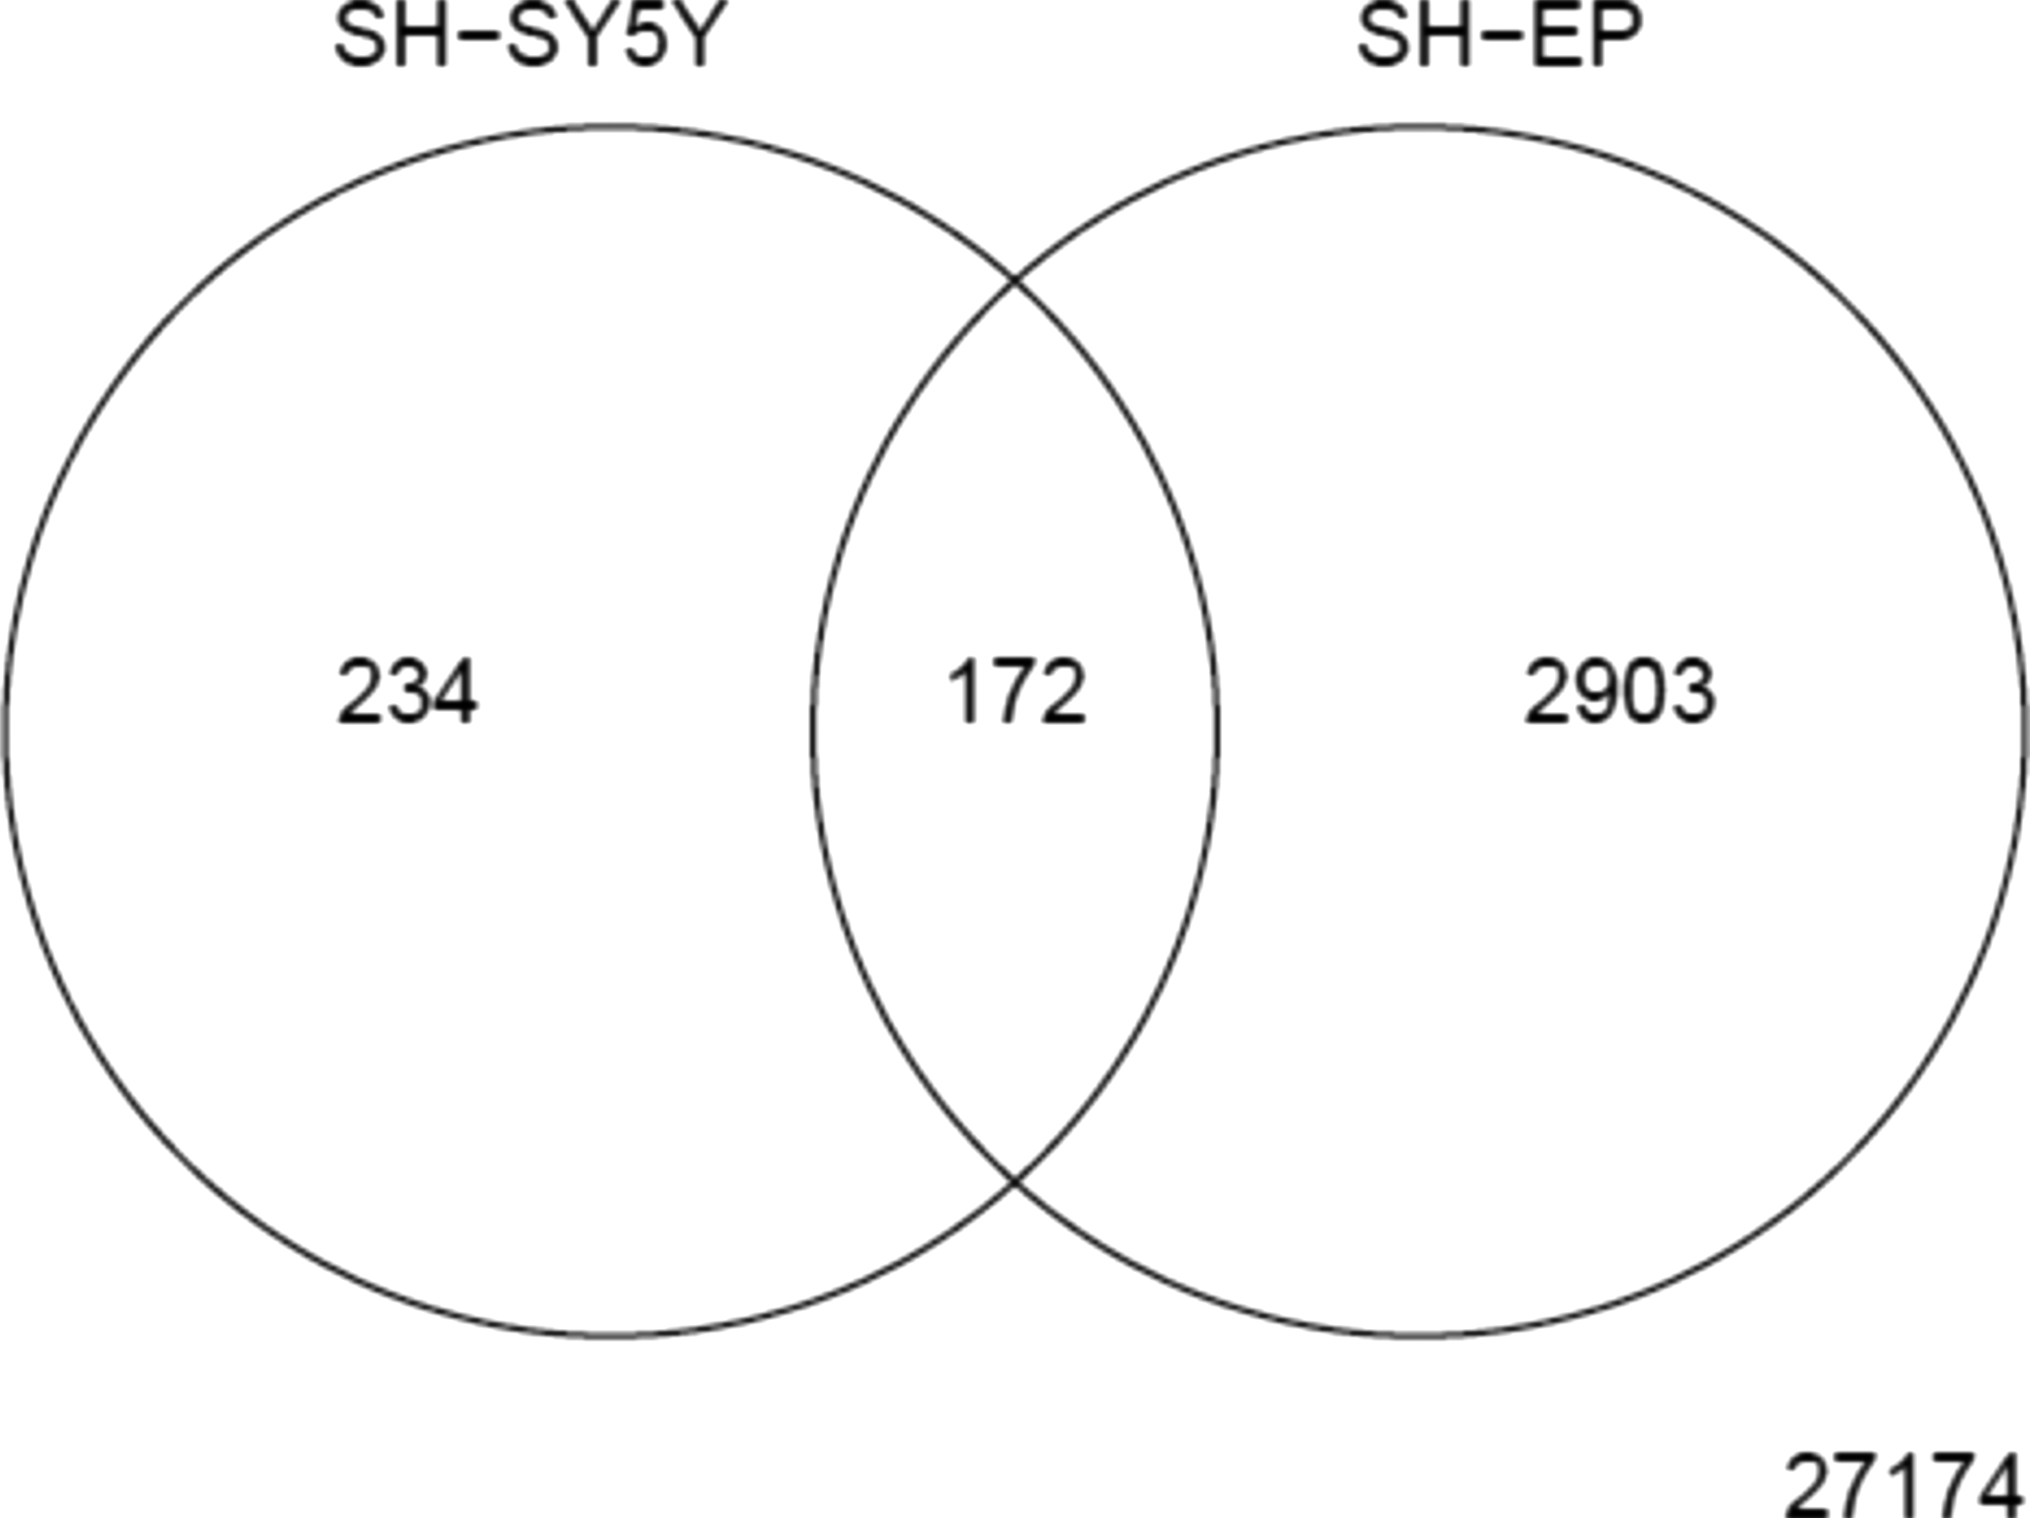
DEGs in SH-SY5Y and SH-EP cells. The number within circle represents the number of DEGs and the number outside of two circles represents the number of non-DEGs. DEGs, differentially expressed genes.
Cor, Pearson correlation coefficient.
3.2. Enrichment pathway analysis based on Reactome database
Based on the assumption that genes involved in the same biological processes, functions, or localizations present correlated behaviors in gene expression levels, signal intensities, allele occurrences, and so on, statistical tests can be applied to find perturbed or enriched pathways (Hung, 2013). In the case of microarray experiment that changes the expression pattern of thousands of genes, it may only affect the expression patterns of a small handful of biological pathways. Therefore, the identification of enriched pathways in DEGs would be helpful for understanding which molecular mechanisms were evolved in gene expression changes. Here, an R package called reactomePA was employed for the identification of enriched Reactome pathways in DEGs. To determine whether any Reactome pathways annotate a list of DEGs at frequency greater than that would be expected by chance, rectomePA calculates a p-value using the hypergeometric distribution:
In the above equation, N is the total number of genes in the background distribution (all Reactome pathways), M is the number of genes within that distribution annotated to the pathway of interest, n is the size of the list of DEGs, and k is the number of genes within that list that are annotated to the pathway. The p-values were adjusted for multiple comparisons. Table 2 shows enriched Reactome pathways of SH-SY5Y and SH-EP cells when the cutoff of adjusted p-value is 0.05. Except for metabolism, no common enriched pathways were observed between SH-SY5Y and SH-EP cells. That is, SH-SY5Y cells mainly showed enrichment on the pathways related to oxidative stress-induced senescence and chromatin organization, while pathways such as mitotic G1-G1/S phase and protein folding were enriched for SH-EP cells. This indicates that MPP+-induced neuronal cell death mechanism might not be unique. That is, the inhibition of mitochondrial complex I inhibition by MPP+ might cause various detrimental down-stream processes depending on cell type.
BgRatio, ratio of the corresponding pathway gene number to the all reactome pathways' gene number; GeneRatio, ratio of the corresponding pathway gene number within the list of differentially expressed genes (DEGs) to the all reactome pathways' gene number in the list of DEGs.
3.3. Construction of shortest path model for enriched pathways and identification of perturbed regions during time-course with SEM
Although enriched pathways identified in the above section might play a role in MPP+-induced neuronal cell death, there is no information on which areas of pathways are actually perturbed over time. To detect perturbed regions of pathways over the time, we employed the model-implied covariance approach by SEM. This analysis consisted of three steps: the first is to construct an SPM for each enriched pathway by using shortest path, which is defined as minimum step from one DEG to the other DEG on the pathway. Thus, an SPM for each pathway was built by the union of all shortest paths connecting the DEGs, and may include DEGs or non-DEGs (Pepe and Do, 2015); the second step is to fit each SPM to two SEMs, one describing the causal relationships among variables (genes) and the other describing the causal relationships among variables (genes) affected by time. When the modularity of SPM was higher than 0.5, communities/modules were detected by the walktrap algorithm of the R package igraph. In this case, the fitting to SEM was carried out at level of each module within the SPM rather than the SPM itself (see Materials and Methods for detail); the third step is to compare the likelihood-ratio-test chi-square (χ2) values of two fitted SEMs. If there was a significant difference (p-value <0.05) in the chi-squared goodness-of-fit index, the module/pathway model was considered statistically significant.
Three SPMs for enrich pathways of SH-SY5Y cells were detected with p-values less than 0.00001. These are relative to the Reactome pathways: (1) cellular senescence; (2) chromatin modifying enzymes; (3) chromatin organization (Fig. 2). In the case of SH-EP cells, there were no significant pathways at SPM level but six significant modules (five with p-values <0.00001 and one with p-value = 0.009) were detected within SPM of the metabolism pathway (Fig. 3). These results show that the perturbed pathway regions in SH-SY5Y and SH-EP cells are different. This suggests that the cell death mechanism by MPP+ might depend on cell type. All the genes on the significant pathway/module might play a key role in the process of MPP+-induced neuronal cell death. Thus, we defined these genes as significant. The number of significant genes was 27 and 109, respectively, for SH-SY5Y and SH-EP cells.
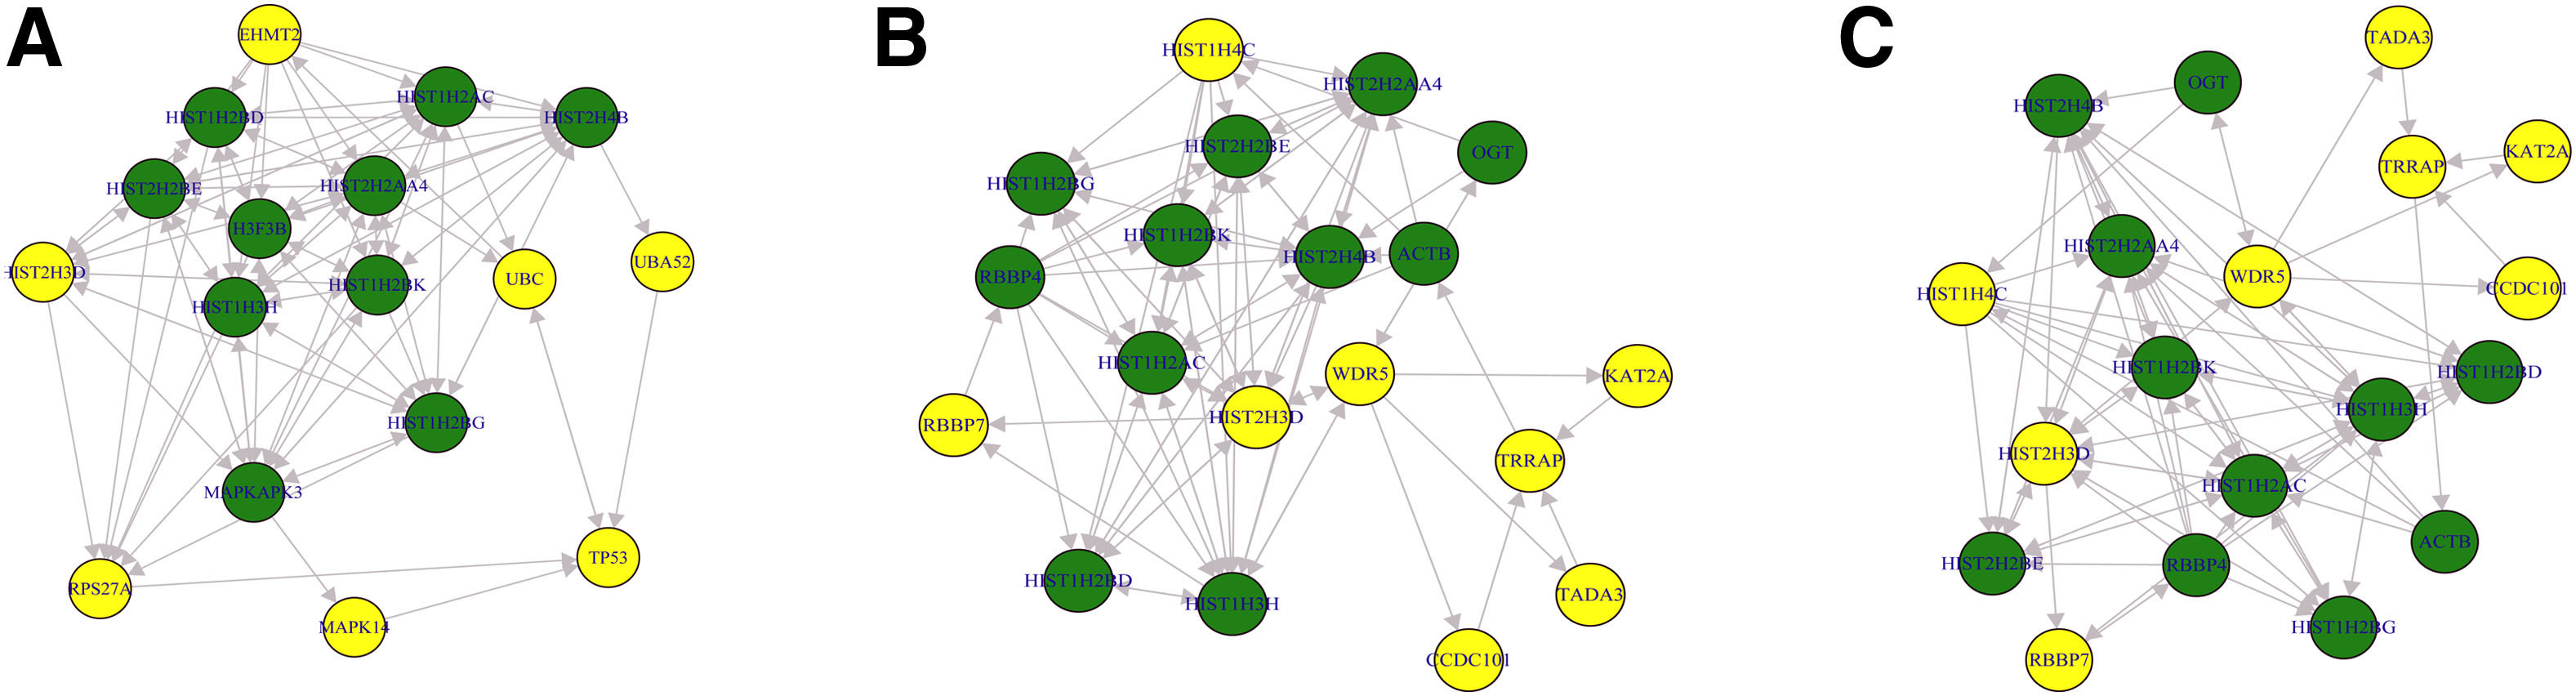
Significant shortest path models for enriched reactome pathways in SH-SY5Y cells.
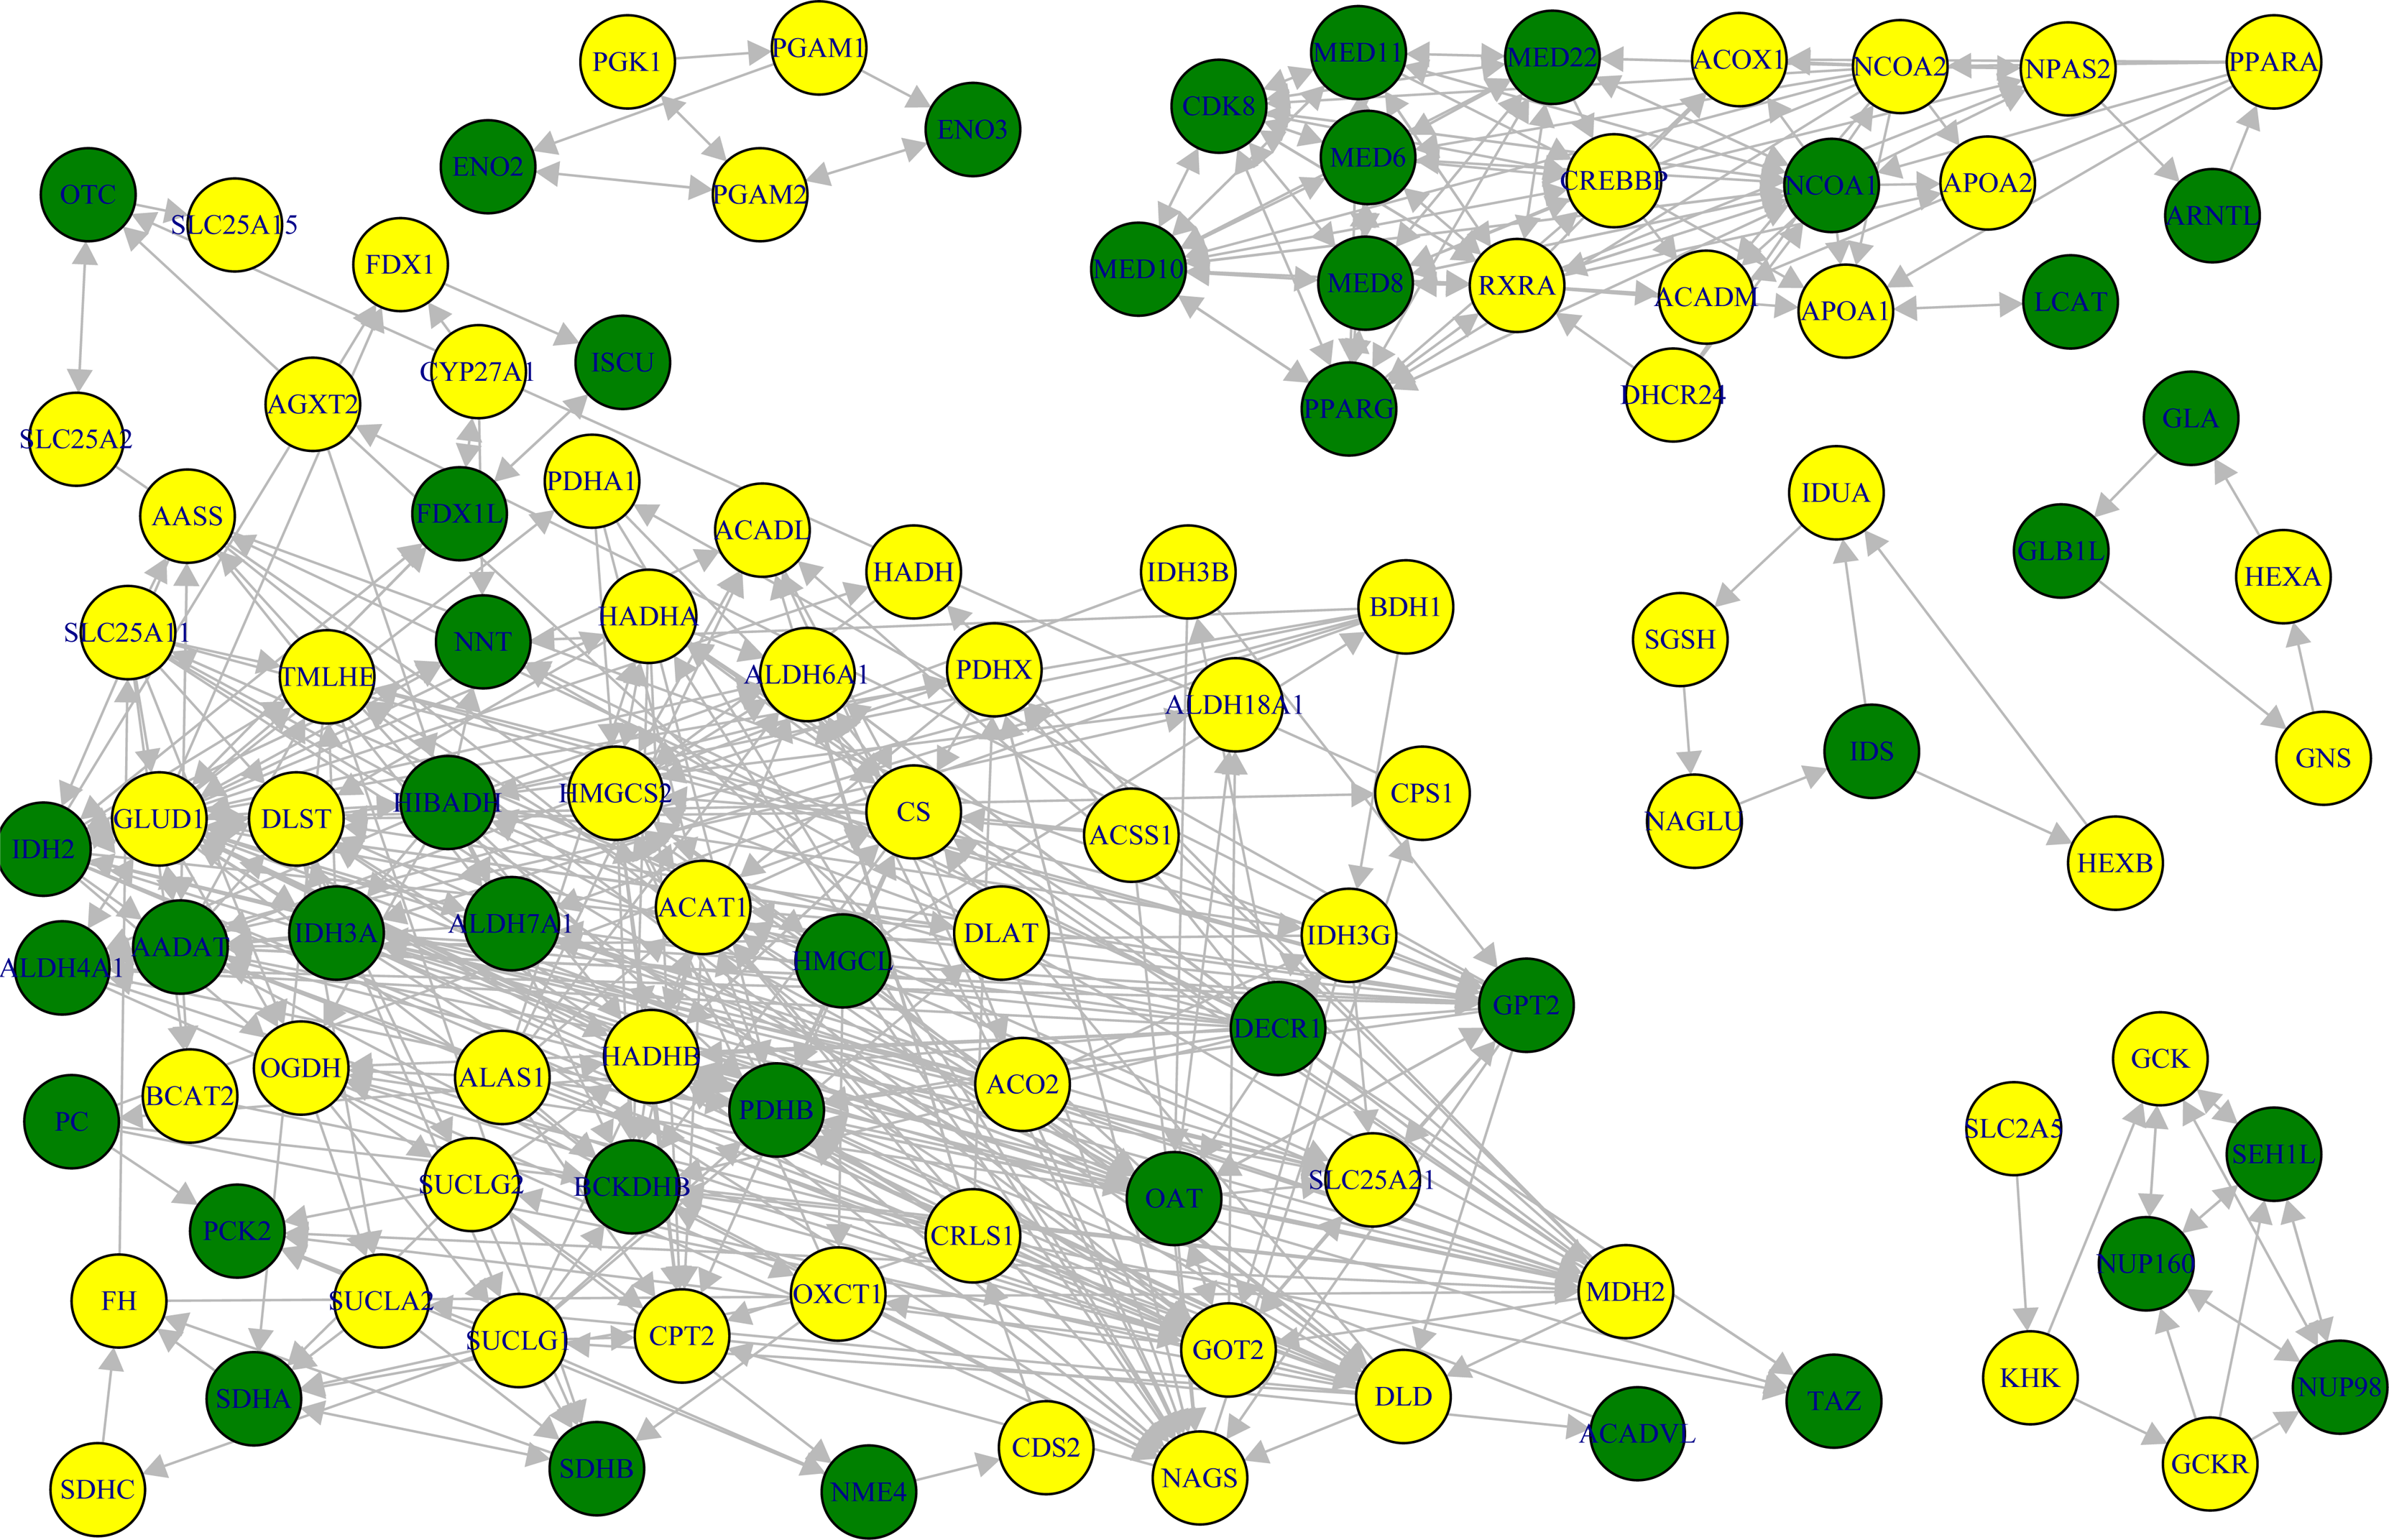
Six significant modules for the reactome metabolism pathway in SH-EP cells.
To survey disease associations of these significant genes, we carried out DO enrichment analysis with the R package DOSE (Yu et al., 2015). Table 3 shows significantly enriched DO terms for SH-SY5Y and SH-EP cells. DO terms, including cancer and disease of cellular proliferation were zenriched for significant genes for SH-SY5Y cells. These DO terms included five genes related to chromatin modification. Entrez genes, including 10919 (EHMT2), 2648 (KAT2A), 8295 (TRRAP), 5931 (RBBP7), and 11091 (WDR5), are involved in histone modification process within chromatin. The modification of histones is often dynamic and reversible and mediated by two antagonistic sets of enzymatic complexes that attach or remove the corresponding chemical groups in a site-specific manner (Sharma and Taliyan, 2015). The purpose of the chromatin remodeling proteins is to alter the nucleosome architecture such that genes are exposed to or hidden from the transcriptional machinery. Recent investigations suggest that gene expression modulated by histone acetylation might be associated with neurodegenerative processes (Sadri-Vakili and Cha, 2006; Harrison and Dexter, 2013). However, in SH-SY5Y cells the expression values of those genes involved in histone modification process were not changed during time-course, while several histone genes such as HIST1H2BD, HIST1H2BK, HIST1H2AC, HIST2H2BE, and HIST2H2AA4 showed downregulation (Table 4).
In the case of SH-EP cells, downregulation was observed not only in histone genes, including HIST1H3H, HIST2H2AA4, HIST1H2BK, HIST2H2BE, HIST1H2BG, and HIST1H2AC, but also histone modification process-related genes such as EHMT2, KAT2A, and TRRAP. This suggests that MPP+ might induce chromatin structural defect rather than modification in SH-SY5Y cells. This might lead to chromatin modification as well as chromatin structural defect. Enriched DO terms in SH-EP cells included many diseases associated to metabolism such as inherited metabolic disorder, acquired metabolic disease, carbohydrate metabolism disease, and glucose metabolism disease. Entrez genes such as 5091 (PC), 3033 (HADH), and 2026 (ENO2), which are involved in carbohydrate/glucose metabolism disease, showed downregulation in SH-EP cells, while expression change of these genes was not observed in SH-SY5Y cells (Table 4). It has been reported that lysosomal storage disorder and dysregulation of glucose metabolism are associated with PD (Shachar et al., 2011). Especially, as dysregulation of glucose metabolism is an early event in sporadic PD (Dunn et al., 2014), the understanding of metabolism changes occurring in SH-EP cells might provide a clue for PD development. Our result suggests that MPP+ in SH-EP cells might lead to metabolic disorder or stress as well as changes in chromatin structure.
4. Conclusions
The effects of a parkinsonian neurotoxin, MPP+, on two types of human neuroblastoma cells, that is, N-type SH-SY5Y and S-type SH-EP cells, were investigated using time-course microarray data. The number of DEGs in SH-EP cells was ∼7.6 times of those in SH-SY5Y cells. This indicates that SH-SY5Y and SH-EP cells may lead to different downstream responsiveness in MPP + treatment although they share a common upstream molecular event, such as the inhibition of mitochondrial complex I by MPP+. Pathway analysis with Reactome clearly showed the difference of perturbed pathways between SH-SY5Y and SH-EP cells. Pathways related to cellular senescence and chromatin modification/organization showed perturbation in SH-SY5Y cells, while pathways related to many metabolisms represented perturbation in SH-EP cells. In SH-SY5Y cells, expression values of genes such as KAT2A, EHMT2, TRRAP, RBBP7, and WDR5, which are involved in chromatin modification, were not changed over time, but histone genes, including HIST1H2BD, HIST1H2BK, HIST1H2AC, HIST2H2BE, and HIST2H2AA4, showed downregulation. This suggests that MPP+ in SH-SY5Y cells might induce structural defect rather than modification in nucleosome.
On the other hand, MPP+ in SH-EP cells led to perturbation of metabolisms that include Entrez genes such as 5091 (PC), 3033 (HADH), 2026 (ENO2), and 3030 (HADHA). Pyruvate carboxylase (PC) is involved in gluconeogenesis, lipogenesis, insulin secretion, and synthesis of the neurotransmitter glutamate, while hydroxyacyl-CoA dehydrogenase (HADH) and long-chain-3-hydroxyacyl-CoA dehydrogenase (HADAH) are mitochondrial functional proteins. Neural enolase (ENO2) has neurotrophic and neuroprotective properties on a broad spectrum of central nervous system (CNS) neurons. These four metabolic genes showed downregulation. This indicates that metabolic stress or disorder may play a key role in MPP+-induced cell death for SH-EP cells. In addition, MPP+ might lead to chromatin modification as well as chromatin structural defect in SH-EP cells via expression changes of corresponding genes. This suggests that effect of MPP+ on chromatin might play an important role in both cell types: N-type SH-SY5Y and S-type SH-EP cells. Conclusively, the mitochondrial complex I inhibition by MPP+ might lead to neuronal cell death via cell type-dependent downstream processes. This might provide a hint of explanation for coexistence of different morphological types of cell death in PD patients. In addition, our results might be useful in the development of multitarget PD drugs because MPP+-induced cell death mechanisms in both SH-SY5Y and SH-EP cells show association with pathogenesis of PD.
Footnotes
Acknowledgment
This study was supported by the Basic Science Research Program through the National Research Foundation (NRF) of Korea funded by the Ministry of Education, Science, and Technology (MEST) (No. 2012R1A1A2005622).
Author Disclosure Statement
The authors declare that no financial conflicts of interest exist.