
Abstract
Abstract
The accelerated growth of protein databases offers great possibilities for the study of protein function using sequence similarity and conservation. However, the huge number of sequences deposited in these databases requires new ways of analyzing and organizing the data. It is necessary to group the many very similar sequences, creating clusters with automated derived annotations useful to understand their function, evolution, and level of experimental evidence. We developed an algorithm called FastaHerder2, which can cluster any protein database, putting together very similar protein sequences based on near-full-length similarity and/or high threshold of sequence identity. We compressed 50 reference proteomes, along with the SwissProt database, which we could compress by 74.7%. The clustering algorithm was benchmarked using OrthoBench and compared with FASTA HERDER, a previous version of the algorithm, showing that FastaHerder2 can cluster a set of proteins yielding a high compression, with a lower error rate than its predecessor. We illustrate the use of FastaHerder2 to detect biologically relevant functional features in protein families. With our approach we seek to promote a modern view and usage of the protein sequence databases more appropriate to the postgenomic era.
1. Introduction
P
Several algorithms attempt to overcome this problem by clustering sets of protein sequences based on sequence similarity, such as CD-HIT (Huang et al., 2010) and kClust (Hauser et al., 2013), or taking into account also structural annotations, such as PISCES (Wang and Dunbrack, 2005). Databases such as UniRef (Suzek et al., 2015) use the CD-HIT algorithm to generate clusters of similar proteins, creating sets of related but independent entries, but not integrating their common annotations. Although these approaches can reduce the redundancy of the database, they lack a comprehensive and integrative view of the results, for example, by examining the annotations of the sequences in the clusters.
Despite having a common evolutionary origin, homologous sequences from distantly related species can be part of different biological processes, having diverse functions and subcellular locations. A midpoint of commitment in sequence clustering is desired that will avoid redundancy in sequence by making many small clusters of highly similar sequences while at the same time making clusters large enough that will include proteins with similar biological function and annotations. One way to reach this midpoint is the clustering of homologous sequences with similar length under the assumption that proteins with similar domain architecture will have a certain level of functional similarity (Ponting et al., 2000). Following this idea, our group previously developed FASTA HERDER to cluster protein databases by aggregating near-full-length homologs (Louis-Jeune et al., 2015). This approach is very restrictive in requiring the protein similarity to be full length, whereas the similarity threshold is significant but low.
We have made several important improvements to FASTA HERDER, leading to the creation of FastaHerder2. Building from the clustering method used in FASTA HERDER, FastaHerder2 adds a second clustering step using a high threshold of sequence identity. This new strategy allows, in addition, the “coclustering” of a query sequence to a preclustered database. The preclustering reduces the complexity of the protein databases, easing the interpretation of the results of a sequence similarity search and allowing the user the fast retrieval of sets of clusters with a certain set of annotations. The use of preclustered databases allowed us to expand the functionality of FastaHerder2 with respect to its previous version with three new working modes. FastaHerder2 constitutes a new type of protein sequence database that would eventually replace the current unclustered databases, whose usage has become increasingly impractical.
2. Methods
2.1. Clustering methods
FastaHerder2 uses three different methods for clustering sets of proteins. Given a file with protein sequences, the longest one (of length q) is chosen as the leader of a cluster and a greedy search is executed to look for sequences similar to the leader among those of length ≥q – 2n (method 1, cluster). The value of n depends on q. The values of n and q were optimized in the previous version of this tool, FASTA HERDER (Louis-Jeune et al., 2015). BLAST is used for the searches (Altschul et al., 1997). The sequences that match the identity threshold (24.8%) (Sander and Schneider, 1991) are clustered with the leader and removed from the initial file. The process is repeated until no sequence remains unchecked.
Some proteins might not have been placed in a cluster because they did not match the requirements used in method 1. These singletons are taken as queries in the clustering method 2 (recluster). FastaHerder2 perform then BLAST searches using each of the queries against the complete set of clusters' leaders. The query is included in the best result leader's cluster if the identity is greater than a threshold of 53% given by a modified Rost curve (Rost, 1999), which yielded good results in a previous work (Mier et al., 2015).
A similar approach is followed by the third method to cocluster one sequence of interest within a previously clustered database (method 3, cocluster). It BLASTs the sequence of interest against a database containing the clusters' leaders from a given clustered database, clustering it with the most similar cluster's leader.
2.2. The FastaHerder2 web application
FastaHerder2 was implemented in Perl, and can be used in a standalone version or in an easy-to-use web application. File uploads are allowed but limited to a file size of up to 2 Mb, because of time constraints. To cluster bigger files, we provide the user with the standalone version of FastaHerder2 mode 1 in the FastaHerder2 homepage.
2.3. Data retrieval and cluster annotation
The complete set of annotations of all clustered sequences was extracted from UniProt, downloaded from the UniProt FTP site (release 2015_05) (The UniProt Consortium, 2015). Annotations that were considered for each sequence were length, taxonomy, Protein Data Bank (PDB) information (Rose et al., 2015), Pfam information (Finn et al., 2014), PubMed identifier (PMID) citations, and positional annotation concerning domains. Only PMIDs cited less than 13 times were taken into account, to discard literature reporting genomes, libraries, or large-scale reports (Schaefer et al., 2012). We also calculated if the proteins had any amino acid repeats (polyX regions), validating the polyX if there were at least 8 occurrences of amino acid X in a recurrent window of 10 amino acids (Schaefer et al., 2012). The taxonomy information was used to calculate the minimum common taxonomy (joint taxonomy, JT) from the complete taxonomies of all the proteins within a cluster.
2.4. Benchmark of the new algorithm
To benchmark FastaHerder2, we downloaded the set of manually curated protein families OrthoBench (Trachana et al., 2011). It includes 7962 proteins, belonging to 99 families sorted in 12 classes (Supplementary Table S1; Supplementary Material is available online at www.liebertonline.com/cmb). OrthoBench is used to assess ortholog detection methods. We put all sequences together and then clustered them using FASTA HERDER (Louis-Jeune et al., 2015) and the standalone version of FastaHerder2. The results were evaluated taking into account the number of clusters generated for each family and the number of initial proteins in a family versus the number of clusters given by the compression of the initial file. We also noted the number of wrongly clustered proteins in each set of clusters belonging to one family (misclassifications), and so if two proteins from different families are clustered together, there will be one misclassification in both of their families.
3. Results and Discussion
3.1. FastaHerder2 provides a significant upgrade compared with its previous version
FastaHerder provides four modes of action, each for a specific way of working with protein clusters. In mode 1: cluster, given a file with protein sequences, it clusters them based first on the protein length and identity, and then the ones that were not successfully clustered go through the clustering method 2 based purely on sequence identity (Fig. 1).
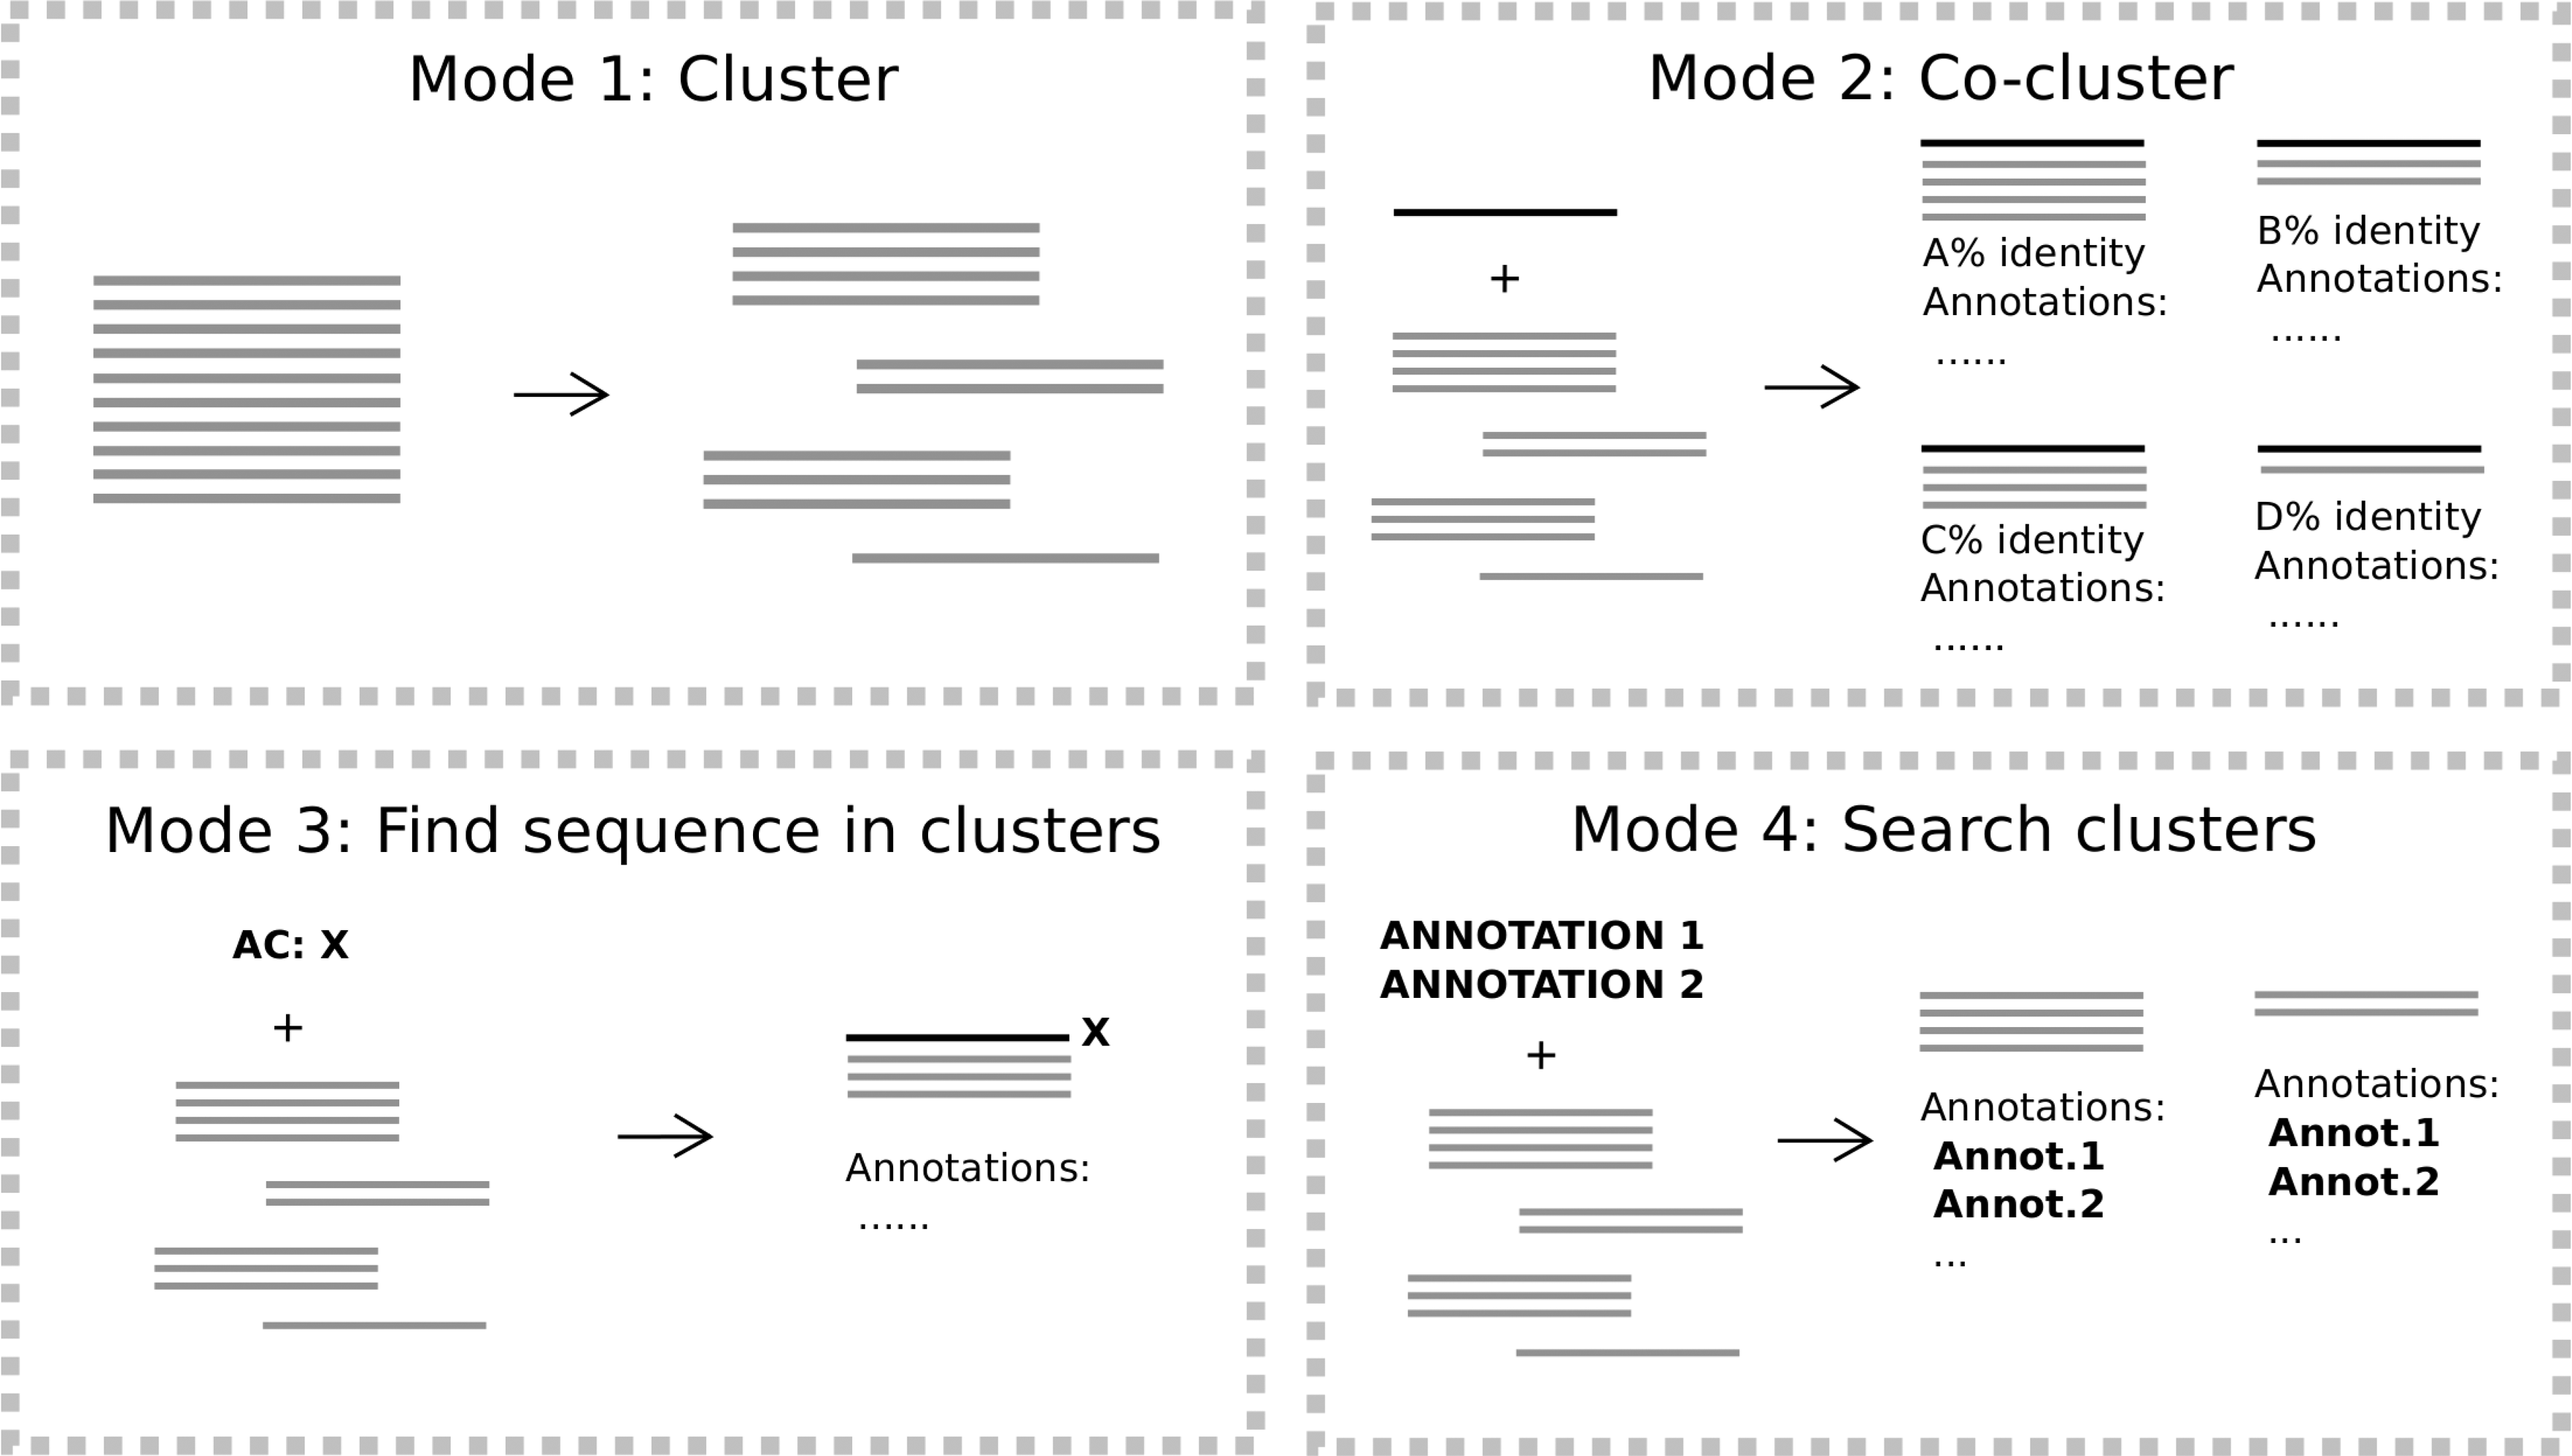
Overview of FastaHerder2 working modes. Mode 1 uses a set of sequences as query and clusters them. Mode 2 coclusters one query sequence with clusters from preclustered databases. Mode 3 finds clusters in preclustered databases that contain a protein of interest. Mode 4 retrieves clusters with a certain set of annotations.
In mode 2: cocluster, FastaHerder2 looks for the most suitable cluster for a protein query to cluster within from a preclustered dataset. We currently offer coclustering against the clustered SwissProt database (release 2015_05) (The UniProt Consortium, 2015), as a way to compare with a very well-annotated database, and with 50 independently clustered proteomes (Supplementary Table S2). Each of the databases was clustered using mode 1.
FastaHerder2 mode 3: find sequence in clusters retrieves the cluster containing a given (UniProt) protein identifier if present in a preclustered dataset. In mode 4: search clusters the user can query the SwissProt precomputed cluster dataset with a combination of annotations. Eligible annotations include cluster length subrange, number of proteins in a cluster, having or not a specific set of Pfam domains, having PDB annotations, having related publications (PMIDs), single amino acid repeats (e.g., polyA), and organism. Single amino acid repeats were included as a first approach for the detection of compositionally biased regions, which, although do not tend to form globular domains, are very frequent in proteins and often conserved and functional (Sim and Creamer, 2004).
3.2. FastaHerder2 proteome compression depends on the protein redundancy of the database
As a set of protein sequences, any proteome can be clustered using FastaHerder2 mode 1. We selected a set of 50 complete reference proteomes from diverse taxonomic groups and clustered them using this mode. The resulting clustered proteomes are used in FastaHerder2 modes 2 and 3. The percentage of compression (comparing the number of clusters to the number of initial sequences) achieved with each proteome varies widely according to its level of sequence redundancy (Fig. 2a) (complete results in Supplementary Table S3). Generally, we observed in the set of 50 proteomes correlation between the number of proteins in a proteome and the percentage of compression that can be obtained with FastaHerder2 (multiple R2 = 0.73, p = 2.71e-15). This shows that larger proteomes have a tendency to accommodate a higher level of gene duplication than smaller proteomes. Compression results obtained with the reclustering strategy used solely in FastaHerder2 are better than the results obtained just by clustering the proteomes as was done in FASTA HERDER and, interestingly, there is less correlation between compression and proteome size (multiple R2 = 0.43, p = 1.98e-07).
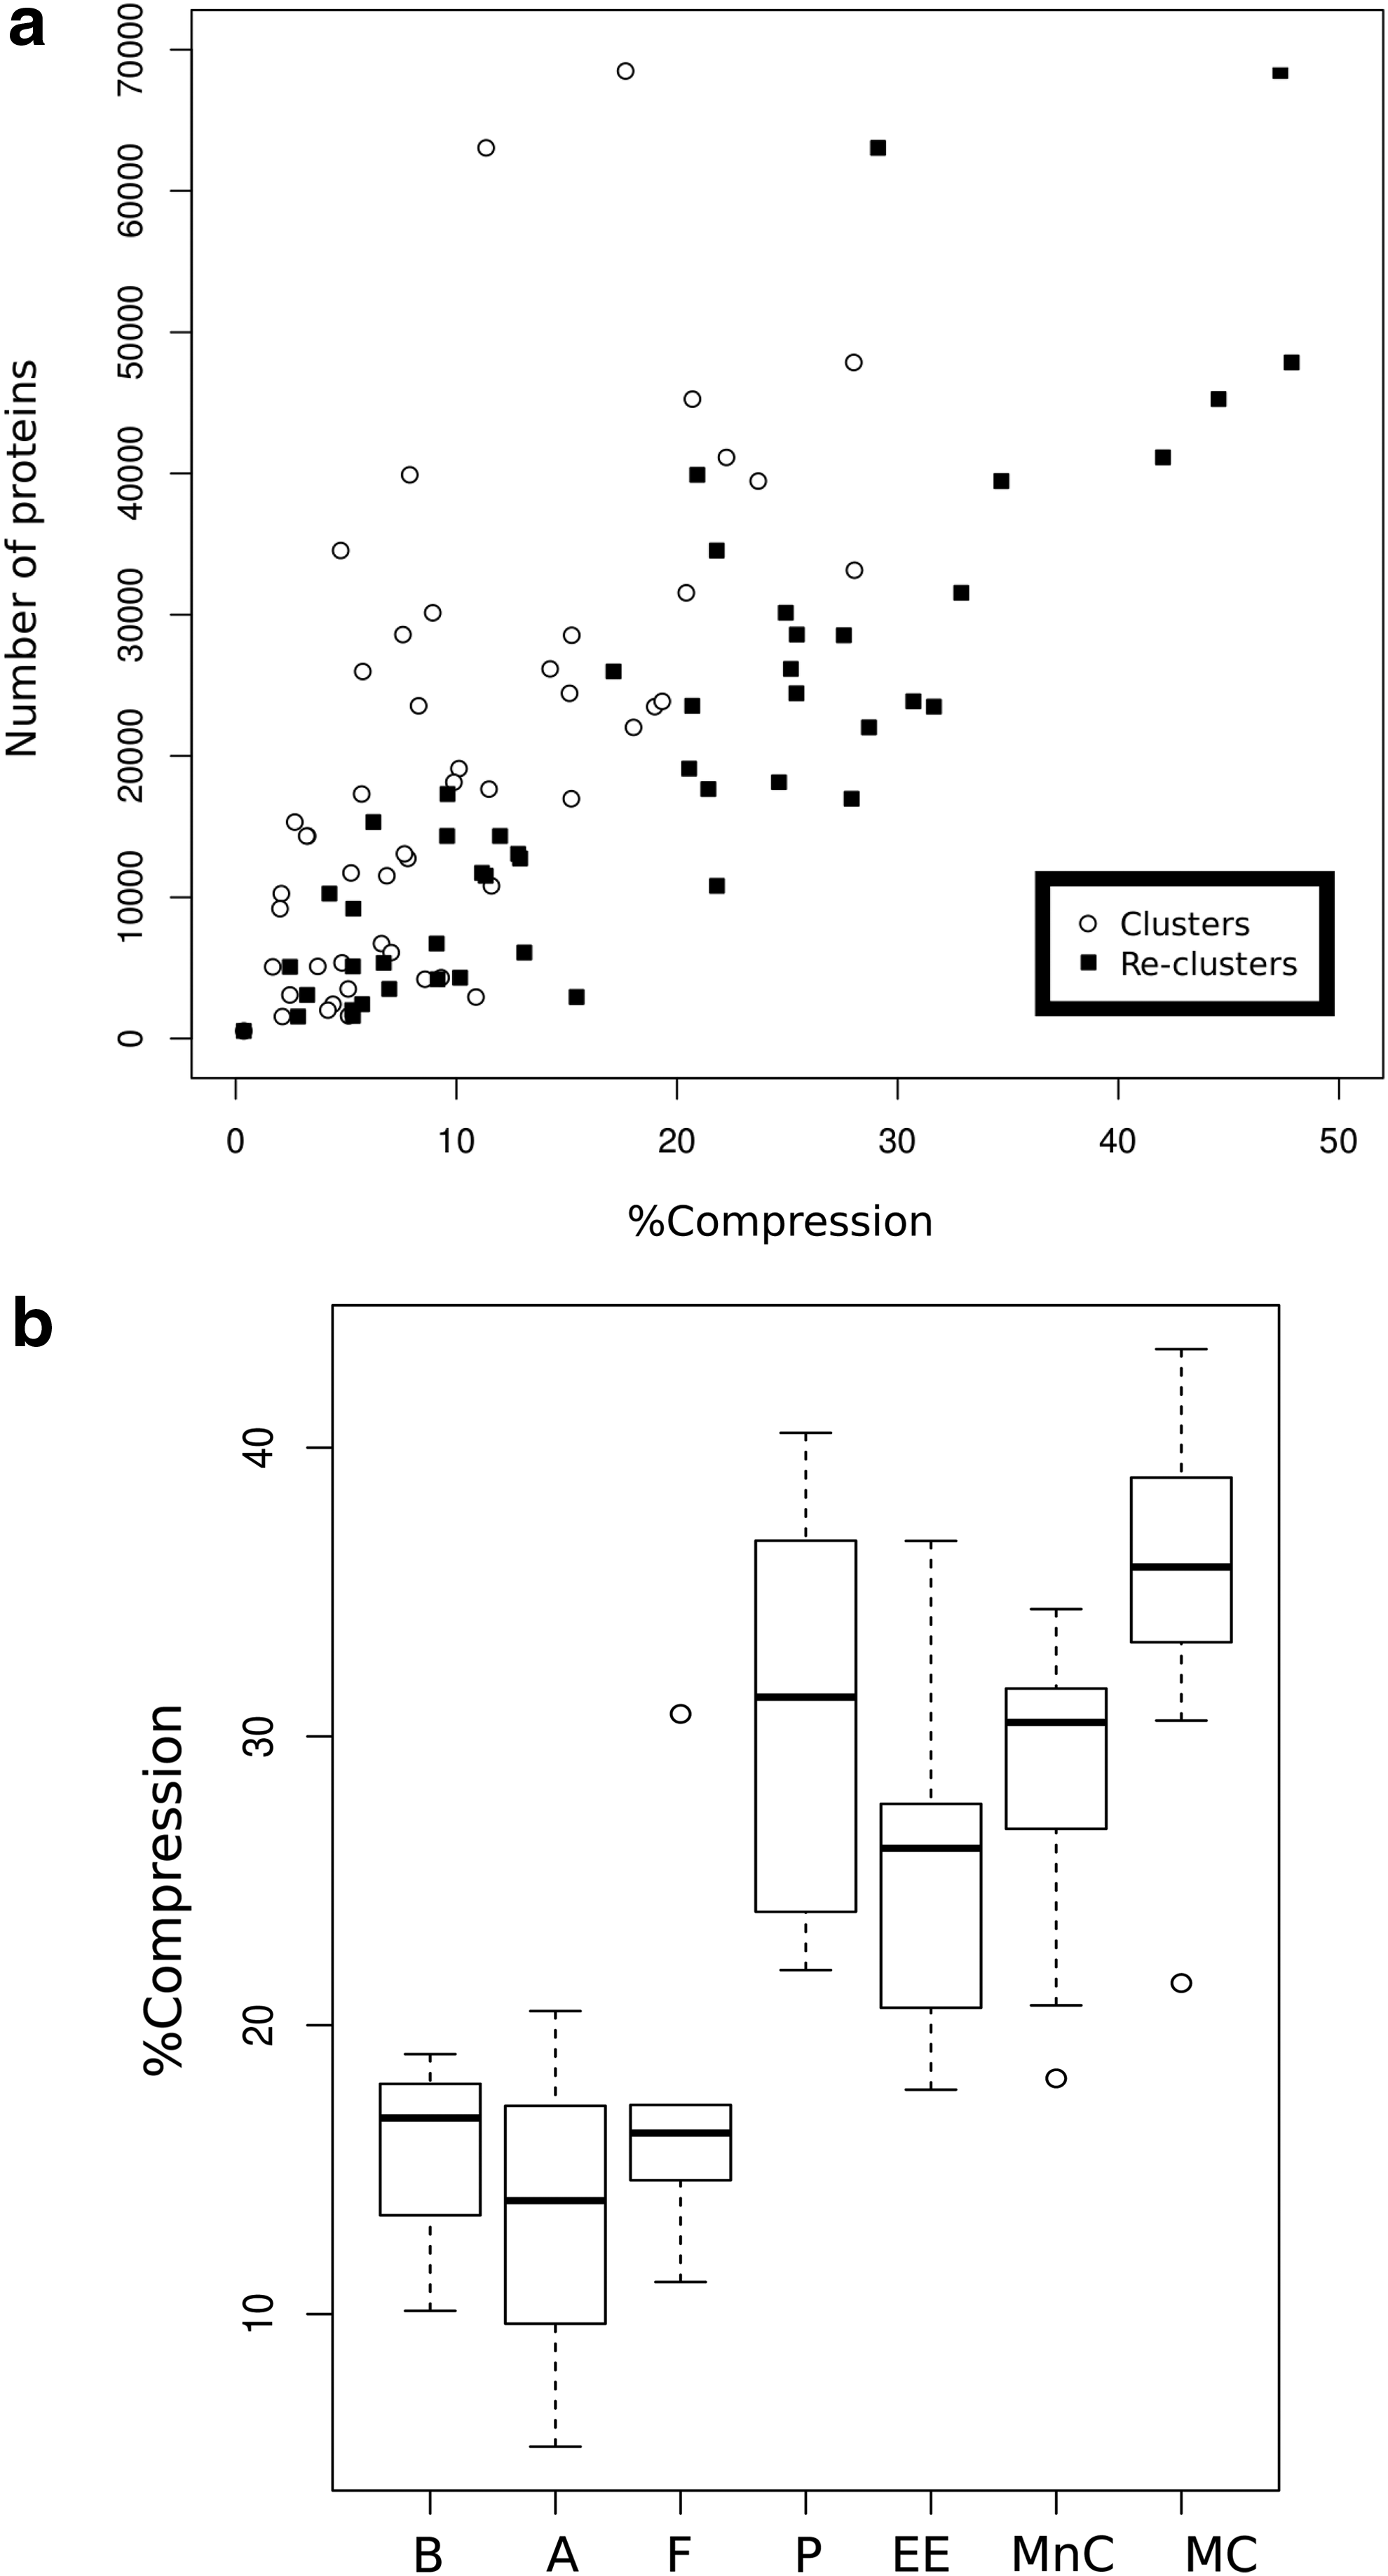
Results of the clustering of 50 complete reference proteomes using FastaHerder2 mode 1.
We observed that, within a taxonomic group, the number of proteins in a proteome and their compression rate varies in a wide range, depending on the specific characteristics of an organism. For example, both Ciona intestinalis and Homo sapiens are Chordata organisms, having the first 17,308 proteins (compression 9.60%) and the latter 68,485 proteins (compression 47.33%). This is nearly a fourfold difference in the number of proteins and a fivefold difference in compression, reflecting the large variability of Chordata organisms (Dehal et al., 2002). However, when grouping the clustered proteomes by taxonomic group, there is a general correlation between gross taxonomic divisions and percentage of compression (Fig. 2b): the more complex taxonomic groups yield a higher proteome compression rate, probably because they tend to be more redundant. While Bacteria, Archaea, and Fungi proteomes tend to yield less than 10% compression, Plantae and Metazoa organisms have in general more than 10% compression.
In addition, we clustered the manually curated protein database SwissProt, which is obviously much more redundant than any given individual proteome. FastaHerder2 compressed SwissProt by 74.7%, generating 138,778 reclusters from the initial 548,454 sequences. Here the gain in compression with respect to the FASTA HERDER strategy is not so large: 153,429 clusters and 72.03% compression. This showcases that the reclustering strategy resolves mostly protein entries regarding paralogs and variants of the same protein (e.g., fragments and splice variants).
3.3. FastaHerder2 modes 2 and 3 allow a full search of preclustered datasets
FastaHerder2 modes 2 and 3 query previously clustered datasets. We used SwissProt and the selection of 50 proteomes described above. In mode 2 the input is a protein sequence, which is coclustered with each clustered dataset. In mode 3 the input is a UniProt AC or ID and the clusters that contain it are retrieved.
The distribution of results from a sequence search in mode 2 (coclustering) over the 50 proteomes gives an idea of its level of conservation. It constitutes a novel experimental way to search for homologs that offers two advantages over a classical sequence similarity search: (1) the proteomes are somewhat simplified by their clustering, and (2) we have chosen a selection of proteomes to cover major taxonomic divisions thus to allow a quick overview of the taxonomic range of the homologs to the query.
The clusters from SwissProt provide a different way to inspect taxonomic distributions. On the one hand, these will be more informative because SwissProt contains information from many more than 50 species. On the other hand, the distribution of species in a cluster might be very large and heterogeneous and the results thus difficult to interpret. To offer a simplified view of the taxonomy information of the proteins within a cluster, we calculate its minimum common taxonomy (joint taxonomy, JT). The JT may be taken as an indication of the cluster's age. If proteins from two evolutionarily distant organisms are present in one cluster, this suggests that the protein family is ancient (in the absence of events of horizontal transfer). On the contrary, clusters limited to proteins from one organism mean that these proteins are different from their closest orthologs, and so they have recently been either created or modified.
The distribution of JTs in a clustered dataset depends on three factors. Two have biological relevance and there is not much we can do about them: there can be more variation and thus more species in particular taxonomic divisions depending on the speed of evolution and in how these divisions are defined, and even if evolution was homogeneous in time, space, and divisions, extinctions might have erased parts of the tree of life in heterogeneous ways. The third factor is the choice of organisms for sequencing. This factor can be eventually corrected because it is possible to direct sequencing projects to cover better less known parts of the tree of life.
To examine the distribution of JTs in SwissProt clusters, from the point of view of the human proteome, we selected the 8294 clusters from SwissProt that had at least one human protein. We then studied the frequency of each possible JT, from 1-cellular organisms (in the cluster there is at least one bacterial or archaean protein) to 15-Homo (the cluster contains only human proteins). As expected, there are some JT hotspots (Fig. 3): clusters originated with 10-Euarchontoglires (2776 clusters) might include rodents (e.g., Mus musculus), clusters originated with 9-Eutheria (1868 clusters) might include bovines (e.g., Bos taurus), and clusters originating with 7-Euteleostomi (1764 clusters) might include fish (e.g., Danio rerio). The sequence data gap from Chordata to Vertebrata is evident and one would like to have a larger number of sequenced proteomes from marine species such as tunicates and lancelets.
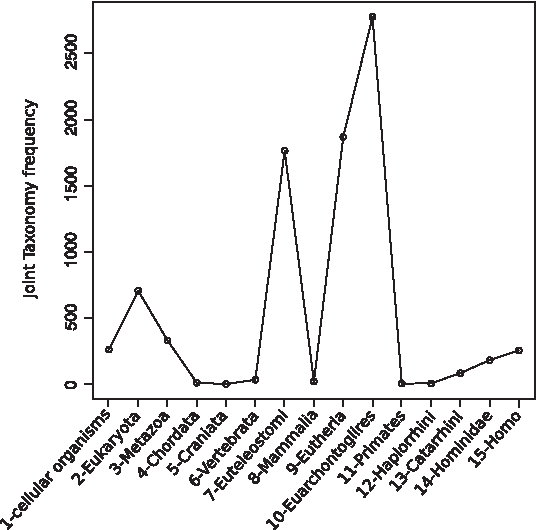
Minimum common taxonomy (joint taxonomy, JT) frequency of all SwissProt clusters with at least one human protein. Human taxa are numbered by their evolutionary age, from the oldest (1-cellular organisms) to the youngest (15-Homo).
3.4. FastaHerder2 mode 4 allows the retrieval of sets of clusters sharing annotations
Working with sequences is not the same as working with annotations. Sometimes it is useful to know how many clusters share a specific annotation or set of them. FastaHerder2 mode 4 allows the fast retrieval of sets of clusters sharing annotations (Table 1) from the SwissProt clustered dataset.
AAR, amino acid repeat; PDB, Protein Data Bank; PMID, PubMed identifier.
Clusters are annotated with the set of annotations retrieved from the protein sequences they contain.
As an illustrative example of the extreme power of this search mode, we present the result of a query to research polyQ function in prokaryotic organisms. PolyQ stretches are relatively frequent among eukaryotic proteins but very rare in prokaryota; for example, Escherichia coli has only one protein with polyQ (Schaefer et al., 2012). PolyQ have been associated in eukaryotic organisms to function as modulators of protein–protein interactions; they are hypothesized to extend a coiled-coil-situated N-terminal to the polyQ region upon a coiled-coil interaction with another protein (Petrakis et al., 2013). This situation would have been attained by multiple protein families by convergent evolution. Until now, no examples of such a polyQ-mediated interaction had been proposed for prokaryotic proteins. To search for such a case, we tried FastaHerder2 mode 4 with a query for clusters containing at least one protein from E. coli (taxonomic id: 83333) and at least one sequence with polyQ.
The result of this query was a single cluster, which contained chaperon dnaK (Hsp70) of E. coli together with 242 other sequences from proteobacteria. Although the E. coli sequence was not the one containing the polyQ, it was present in a region near the C-terminal in three species of Bordetella: B. pertussis, B. parapertussis, and B. bronchiseptica (clustered together in the phylogenetic tree of the cluster members; data not shown). Other tree species had a polyA in the same region: Delftia acidovorans, Acidovorax ebreus, and Burkholderia thailandensis (located in near regions of the tree). Actually, the E. coli dnaK has two stretches of three consecutive glutamines and is alanine-biased in that region. Interestingly, the structure of E. coli dnaK displays a coiled-coil region ending at the first glutamine triplet and this protein is known to homodimerize. The structure of the homodimer indicates that the C-terminal region with the coil could be involved in a coiled-coil interaction of dnaK (PDB id: 4b9q) (Kityk et al., 2012). This FastaHerder2-facilitated protein sequence analysis supports the finding that the C-terminal of human DnaK is needed for its dimerization (Marcion et al., 2015).
3.5. FastaHerder2 reduces the number of misclassifications maintaining a high compression
To compare the performance of FastaHerder2 to its previous version, FASTA HERDER, we used the manually curated benchmark sets of protein families OrthoBench. As observed with the compression of SwissProt, the overall compression of the initial protein file from OrthoBench is very similar between both algorithms (Table 2 and Supplementary Table S4). More significantly, FastaHerder2 was able to reduce the number of misclassified proteins from 63 to 7. In FastaHerder2, two proteins from different families (RefOG003 and RefOG004) but from the same OrthoBench class (low complexity regions/repeats) cluster together. Whereas the family RefOG003 contains ankyrin (ANK) repeat proteins, RefOG004 contains osteoclast proteins, which contain SH3 and ANK repeats. They are in fact very similar (57% identity, e = 2e-79), but because they are grouped in different families they are reckoned as misclassifications.
For each algorithm (FASTA HERDER and FastaHerder2), the results are the number of clusters that contain the complete set of proteins from a class (number of proteins), how much compression that means (taking into account the number of proteins from a class), and the number of misclassified sequences in those clusters.
Both algorithms had trouble clustering proteins from the families RefOG86 (membrane GTPases involved in stress response) and RefOG035 (ATP-binding cassette subfamily A). However, while FastaHerder2 clusters together three proteins from the first family with two from the latter, FASTA HERDER clusters three with 60 proteins. FastaHerder2 reduces the number of misclassifications in the clustering of OrthoBench compared with the same clustering using FASTA HERDER, while keeping a nearly identical compression rate (85%). Results indicate that FastaHerder2 can cluster a set of proteins yielding a high compression, with a very low error rate (0.088%).
4. Conclusions
We have developed FastaHerder2 as a resource to cluster sets of protein sequences and to mine those clusters. FastaHerder2 means a significant upgrade compared with FASTA HERDER, in terms of less misclassifications in the clustering method (mode 1), as well as the development of three new working modes (modes 2, 3, and 4) that expand the functionality of the web tool. Our examples illustrate that there is much more than can be done with the current protein database if it is given some structure.
Footnotes
Acknowledgments
The authors thank all members of the CBDM group for helpful and constructive discussions. We acknowledge the support of the COST Association (Cost Action BM1405). We thank Carol Perez-Iratxeta for the development of the previous version of this tool. This work was supported with funds from the Center for Computational Sciences Mainz (Johannes Gutenberg University of Mainz, Germany).
Author Disclosure Statement
The authors declare that there are no known conflicts of interests.
References
Supplementary Material
Please find the following supplemental material available below.
For Open Access articles published under a Creative Commons License, all supplemental material carries the same license as the article it is associated with.
For non-Open Access articles published, all supplemental material carries a non-exclusive license, and permission requests for re-use of supplemental material or any part of supplemental material shall be sent directly to the copyright owner as specified in the copyright notice associated with the article.