
Abstract
Abstract
This article is about the assessment of several tools for k-mer counting, with the purpose to create a reference framework for bioinformatics researchers to identify computational requirements, parallelizing, advantages, disadvantages, and bottlenecks of each of the algorithms proposed in the tools. The k-mer counters evaluated in this article were BFCounter, DSK, Jellyfish, KAnalyze, KHMer, KMC2, MSPKmerCounter, Tallymer, and Turtle. Measured parameters were the following: RAM occupied space, processing time, parallelization, and read and write disk access. A dataset consisting of 36,504,800 reads was used corresponding to the 14th human chromosome. The assessment was performed for two k-mer lengths: 31 and 55. Obtained results were the following: pure Bloom filter-based tools and disk-partitioning techniques showed a lesser RAM use. The tools that took less execution time were the ones that used disk-partitioning techniques. The techniques that made the major parallelization were the ones that used disk partitioning, hash tables with lock-free approach, or multiple hash tables.
1. Introduction
K-
In the last years, several tools have been developed using different techniques to reduce the excess demand of these resources. In this article, the assessment is documented for the main k-mer counters developed in the last 5 years. To achieve a comparison that covers their main aspects, first, a qualitative analysis was performed describing the technique used and its main characteristics, and then a quantitative assessment was executed comparing the computational resources used such as the processor time, RAM space, the algorithm parallelization, and read and write disk access, and finally the quantitative and qualitative assessment results were taken and a reference framework was generated to identify the challenges to solve in future developments.
2. Materials and Methods
2.1. Counting tools to assess
For the counting k-mer techniques analysis, nine bioinformatics tools were chosen that focus in this process and look for optimization in the computational resources use. These tools were chosen in such a way that the various counting techniques and structures proposed in the last years were included in the assessment. Finally, the tools to assess were BFCounter (Melsted and Pritchard, 2011), which uses a probabilistic data structure called Bloom filter; DSK (Rizk et al., 2013), in which data are partitioned in disk and are loaded to memory in parts; Tallymer (Li, 2015), which uses lpc-interval trees; Jellyfish (Marçais and Kingsford, 2011), which uses a hash table with a lock-free approach to concurrent access; MSPKmerCounter (Kurtz et al., 2008), which uses minimizers; KMC2 (Deorowicz et al., 2015), which uses signatures; Turtle (Roy et al., 2014), which uses Bloom filter along with a technique called sort and compress (SAC); KAnalyze (Audano and Vannberg, 2014), which divides the k-mer load and upload it to memory; and KHMer (Zhang et al., 2014), which uses a probabilistic data structure called Count-Min Sketch. In the following, each tool is presented along with its counting algorithm.
2.1.1. BFCounter
It is a method to identify, count, and store only the k-mers with more than one repetition into a dataset of genomic sequences. It makes use of the probabilistic data structure called Bloom filter (Bloom, 1970), which implicitly stores all the observed k-mers with a significant reduction of space in memory (only one array is used; the k-mer existence is recorded by altering some bits of the array according to the output of some hash functions). This method consists of three steps: the first step goes through every k-mer and uses the Bloom filter to detect the k-mers that have been seen more than one time. The second step is responsible for counting the previously filtered k-mers. Finally, the last step is responsible to clean the false-positive k-mers that passed through the filter.
2.1.2. DSK
It is K-mer counting that optimizes the RAM memory use through reads partitioning in small sets that are stored in disk and loaded in memory in small amounts. This algorithm is divided into three steps: the first step calculates the number of k-mers, the number of iterations to go through the k-mers, and the number of partitions to save on disk. The second goes through all the k-mers that are driven by a hash function that distributes the k-mers into the partitions. The third step is about to load the k-mers of each partition on a hash table and count them occupying in memory only one partition at a time. Finally, all the three steps are repeated until all k-mers have been inserted.
2.1.3. Jellyfish
This method makes use of a hash table and a lock-free approach that allows access and updates the tables through several threads at the same time with a technique called lock-free queues based upon the compare-and-swap (CAS) operation (Ladan-Mozes and Shavit, 2008). The algorithm is divided into two steps: the first step is responsible to find the first k-mer and obtain its key (if it has been stored already) or insert the k-mer in the hash table with a reprove strategy if it does not exist previously; in case a collision is generated, the algorithm tries to insert the k-mer again a number of times indicated by max_reprobe. The second step is responsible to increase the k-mer count, also with a CAS operation.
2.1.4. KAnalyze
This algorithm divides the sequences in subsets to load them to memory in small amounts, which allows a much lower memory use. This method is divided into two steps: split and merge. The first step is responsible to take the k-mers and load them into an array until it is full and then the array is ordered, and the k-mers are counted and written to disk. The second step reads the count files and loads them in memory with a buffer to not use all available memory and merge the files in the final count file that is ordered and saved on disk.
2.1.5. Khmer
This method uses a probabilistic data structure called Count-Min Sketch (Cormode and Muthukrishnan, 2005), which is based upon a Bloom filter and the use of multiple hash tables to detect the k-mers that repeat more than one time and count them. This method is divided into three steps: the first step creates a certain amount of hash tables (according to the maximum amount of required false positives). The second step verifies the k-mer repetition with the Bloom filter. Finally, in the third step the k-mers are inserted and the count increases.
2.1.6. MSPKmerCounter
This method is based upon a technique called minimum substring partitioning (MSP) (Li et al., 2013), which divides the reads in super-k-mers, which are chains that group k-mers with the same minimizer (Roberts et al., 2004). A minimizer is the subchain (fixed size less than k) of a k-mer with the lesser lexicographical weight. The k-mer storage is done by partitioning the disk in such a way that the super-k-mers with the same minimizer will be stored in the same partition. Next to the partitioned storage of the super-k-mers, a stage is responsible to read those partitions, divide the super-k-mers and obtain the k-mers to insert them into a hash table, make the count on each insertion, and finally save the count on the disk.
2.1.7. KMC 2
This method uses minimizers (Roberts et al., 2004) that meet certain characteristics to reduce the amount of these and solve some present problems when used. The selected minimizers must meet the following rules: do not start with AAA, do not start with ACA, and do not contain AA anywhere (except from the beginning) (Li, 2015). The minimizers with these characteristics are called signatures. The k-mer processing is divided into two phases: distribution and ordering. The first phase loads the reads to find the regions (super-k-mers) with the same signatures and save these in the same disk partition identified by that signature. The second phase reads each file, extracts the (k,x)-mers from the super-k-mers, orders these, calculates the statistics for the k-mers, and finally saves the k-mer database (in a binary compact form).
2.1.8. Tallymer
This method uses the enhanced suffix array and lpc-interval tree type (Abouelhoda et al., 2004) to save implicitly the number of occurrences of the subchains in a sequence. This method divides the sequence into smaller sections (which does not overlap) to be processed by a machine with few RAM resources, and then it saves these sequences into an enhanced suffix array and from this array builds the lpc-interval tree. A count in each of these sections from the tree is then made.
2.1.9. Turtle
It is a method of k-mer counting based upon a Bloom filter to detect the k-mers that repeat more than one time, in a similar way as the BFCounter does. Turtle novelty focuses on the use of a method called SAC for counting the k-mers iteratively so that at each iteration the k-mers are loaded (and filtered) to fit in the available memory (or a defined threshold) to proceed to organize them and compact the ones that are equal (performing the count) from the actual iteration as well as the previous iterations, and thereby an iteration is finished and a new one will be executed that will use the freed memory with the compression to load another k-mer package. Finally, an array is produced with all the k-mers ordered and counted.
2.2. Datasets
To carry out the measurement of the computational variables, a large dataset was chosen with a short “paired-end” reads belonging to the 14th human chromosome that contains 36.504.800 read with an average of 101 of base pairs per read.
2.3. Variables
For each of the tools, the above datasets were used and the k-mer counting was performed using processor time use, RAM memory use, parallelization (number and percentage of used cores), and read and write access to disk. All the measures were done for two k-mer lengths, k = 31 and k = 55.
2.4. Computer
The computer in which the assessment was performed had the following hardware description:
• Processor: Intel(R) Xeon(R) CPU E7450 @ 2.40 GHz, 24 cores • RAM: 64 GB • Hard disk: 160 GB (HDD)
3. Results
3.1. Execution time
In Figure 1 and Table 1, the following are shown: the tools that require less execution time are KMC2, DSK, and Jellyfish; the tools that require more execution time are Turtle and Tallymer; the tools DSK, MSPKmerCounter, and Tallymer increase the execution time considerably when the length of k-mers increases; the tools BFCounter and Turtle reduce their execution time when the k-mer length increases; and the tools Jellyfish and KMC2 do not significantly alter their execution time when the length of the k-mers varies.
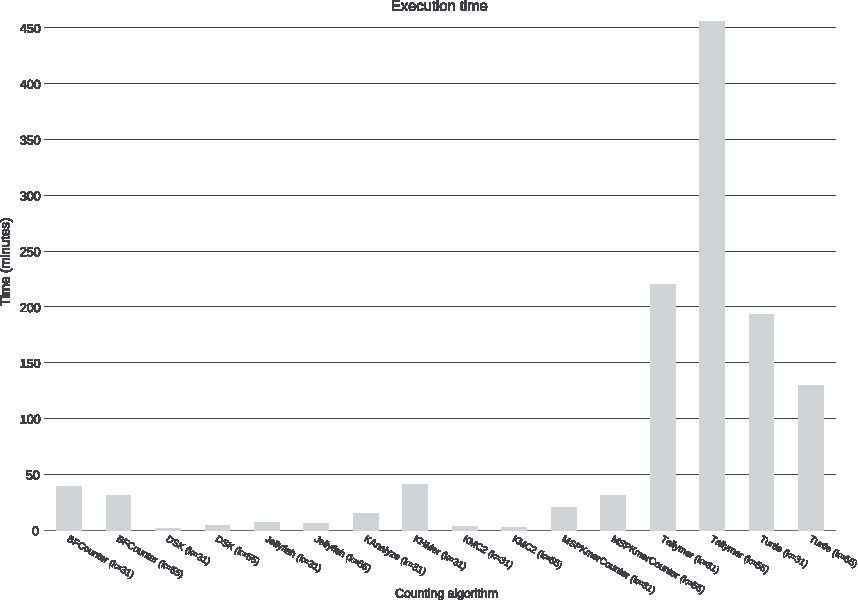
Execution time. In the x axis are the assessed tools, and in the y axis is the execution time of each of the tools.
Rows show the obtained results for each of the tools (with both k-mer sizes, k = 31 and k = 55). Listed in the first column are the tools used. In the second column, the execution time is listed. In the third and fourth columns, the average and the maximum used cores are listed. In the fifth and sixth columns, the average and maximum RAM used are shown. In the seventh and eighth columns, the average and maximum disk access are listed.
3.2. RAM
Figure 2 and Table 1 show the following: the tools with lesser memory requirement are BFCounter, DSK, and KAnalyze; the tools with more memory requirement are KHMer and Turtle; the tools BFCounter, DSK, Jellyfish, and MSPKmerCounter increase their demand for memory when the k-mer length is increased; the tools KMC2, Tallymer, and Turtle reduce their memory requirement when the k-mer length is increased; and the tool Jellyfish shortly alters its memory requirement when the k-mer length varies.
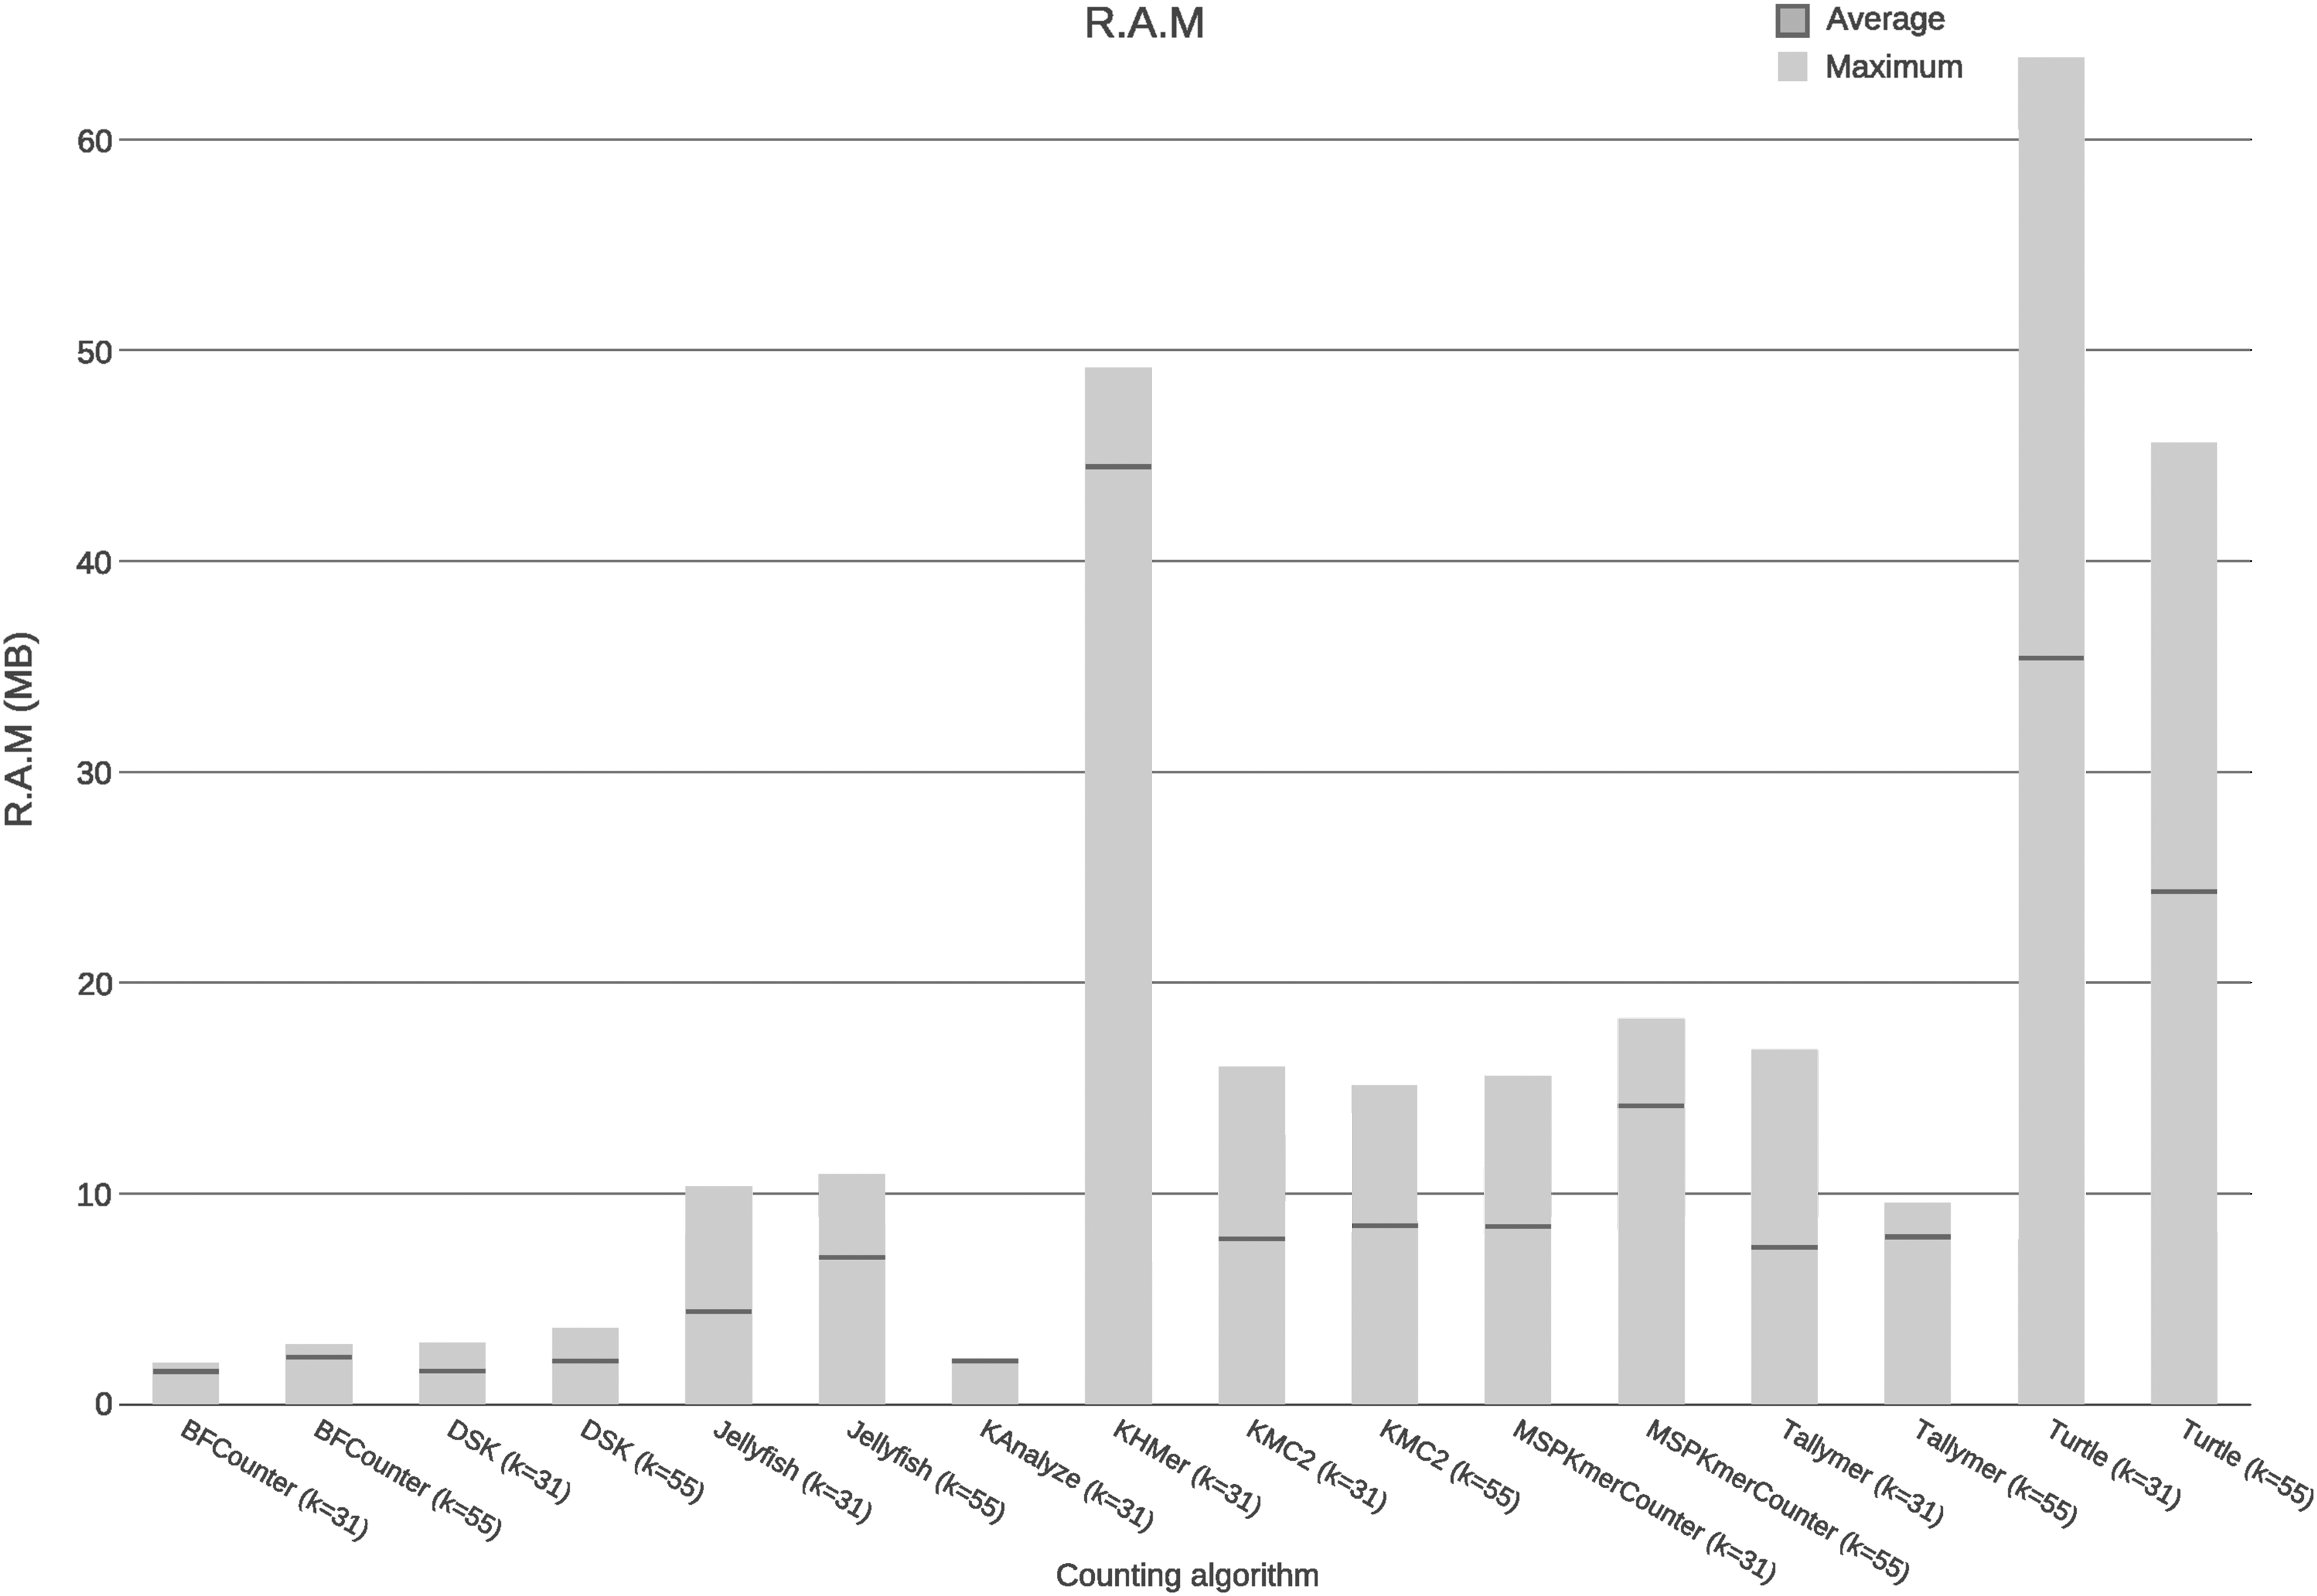
RAM. In the x axis are the tools assessed, and in the y axis are the maximum amount and average amount of RAM memory used by the tools.
3.3. Disc I/O
Figure 3 and Table 1 show the following: the tools with lower average read/write to disk are BFCounter, Turtle, and Tallymer; the tools that have higher average read/write to disk are KAnalyze, DSK, Jellyfish, and KHMer; the DSK tool increase its read/write to disk operations average when the k-mer length is increased; the tools Jellyfish, KMC2, MSPKmerCounter, Tallymer, and Turtle decrease their average read/write operations when the k-mer length is increased; and the BFCounter tool does not show changes in the average read/write operations when the k-mer length changes.
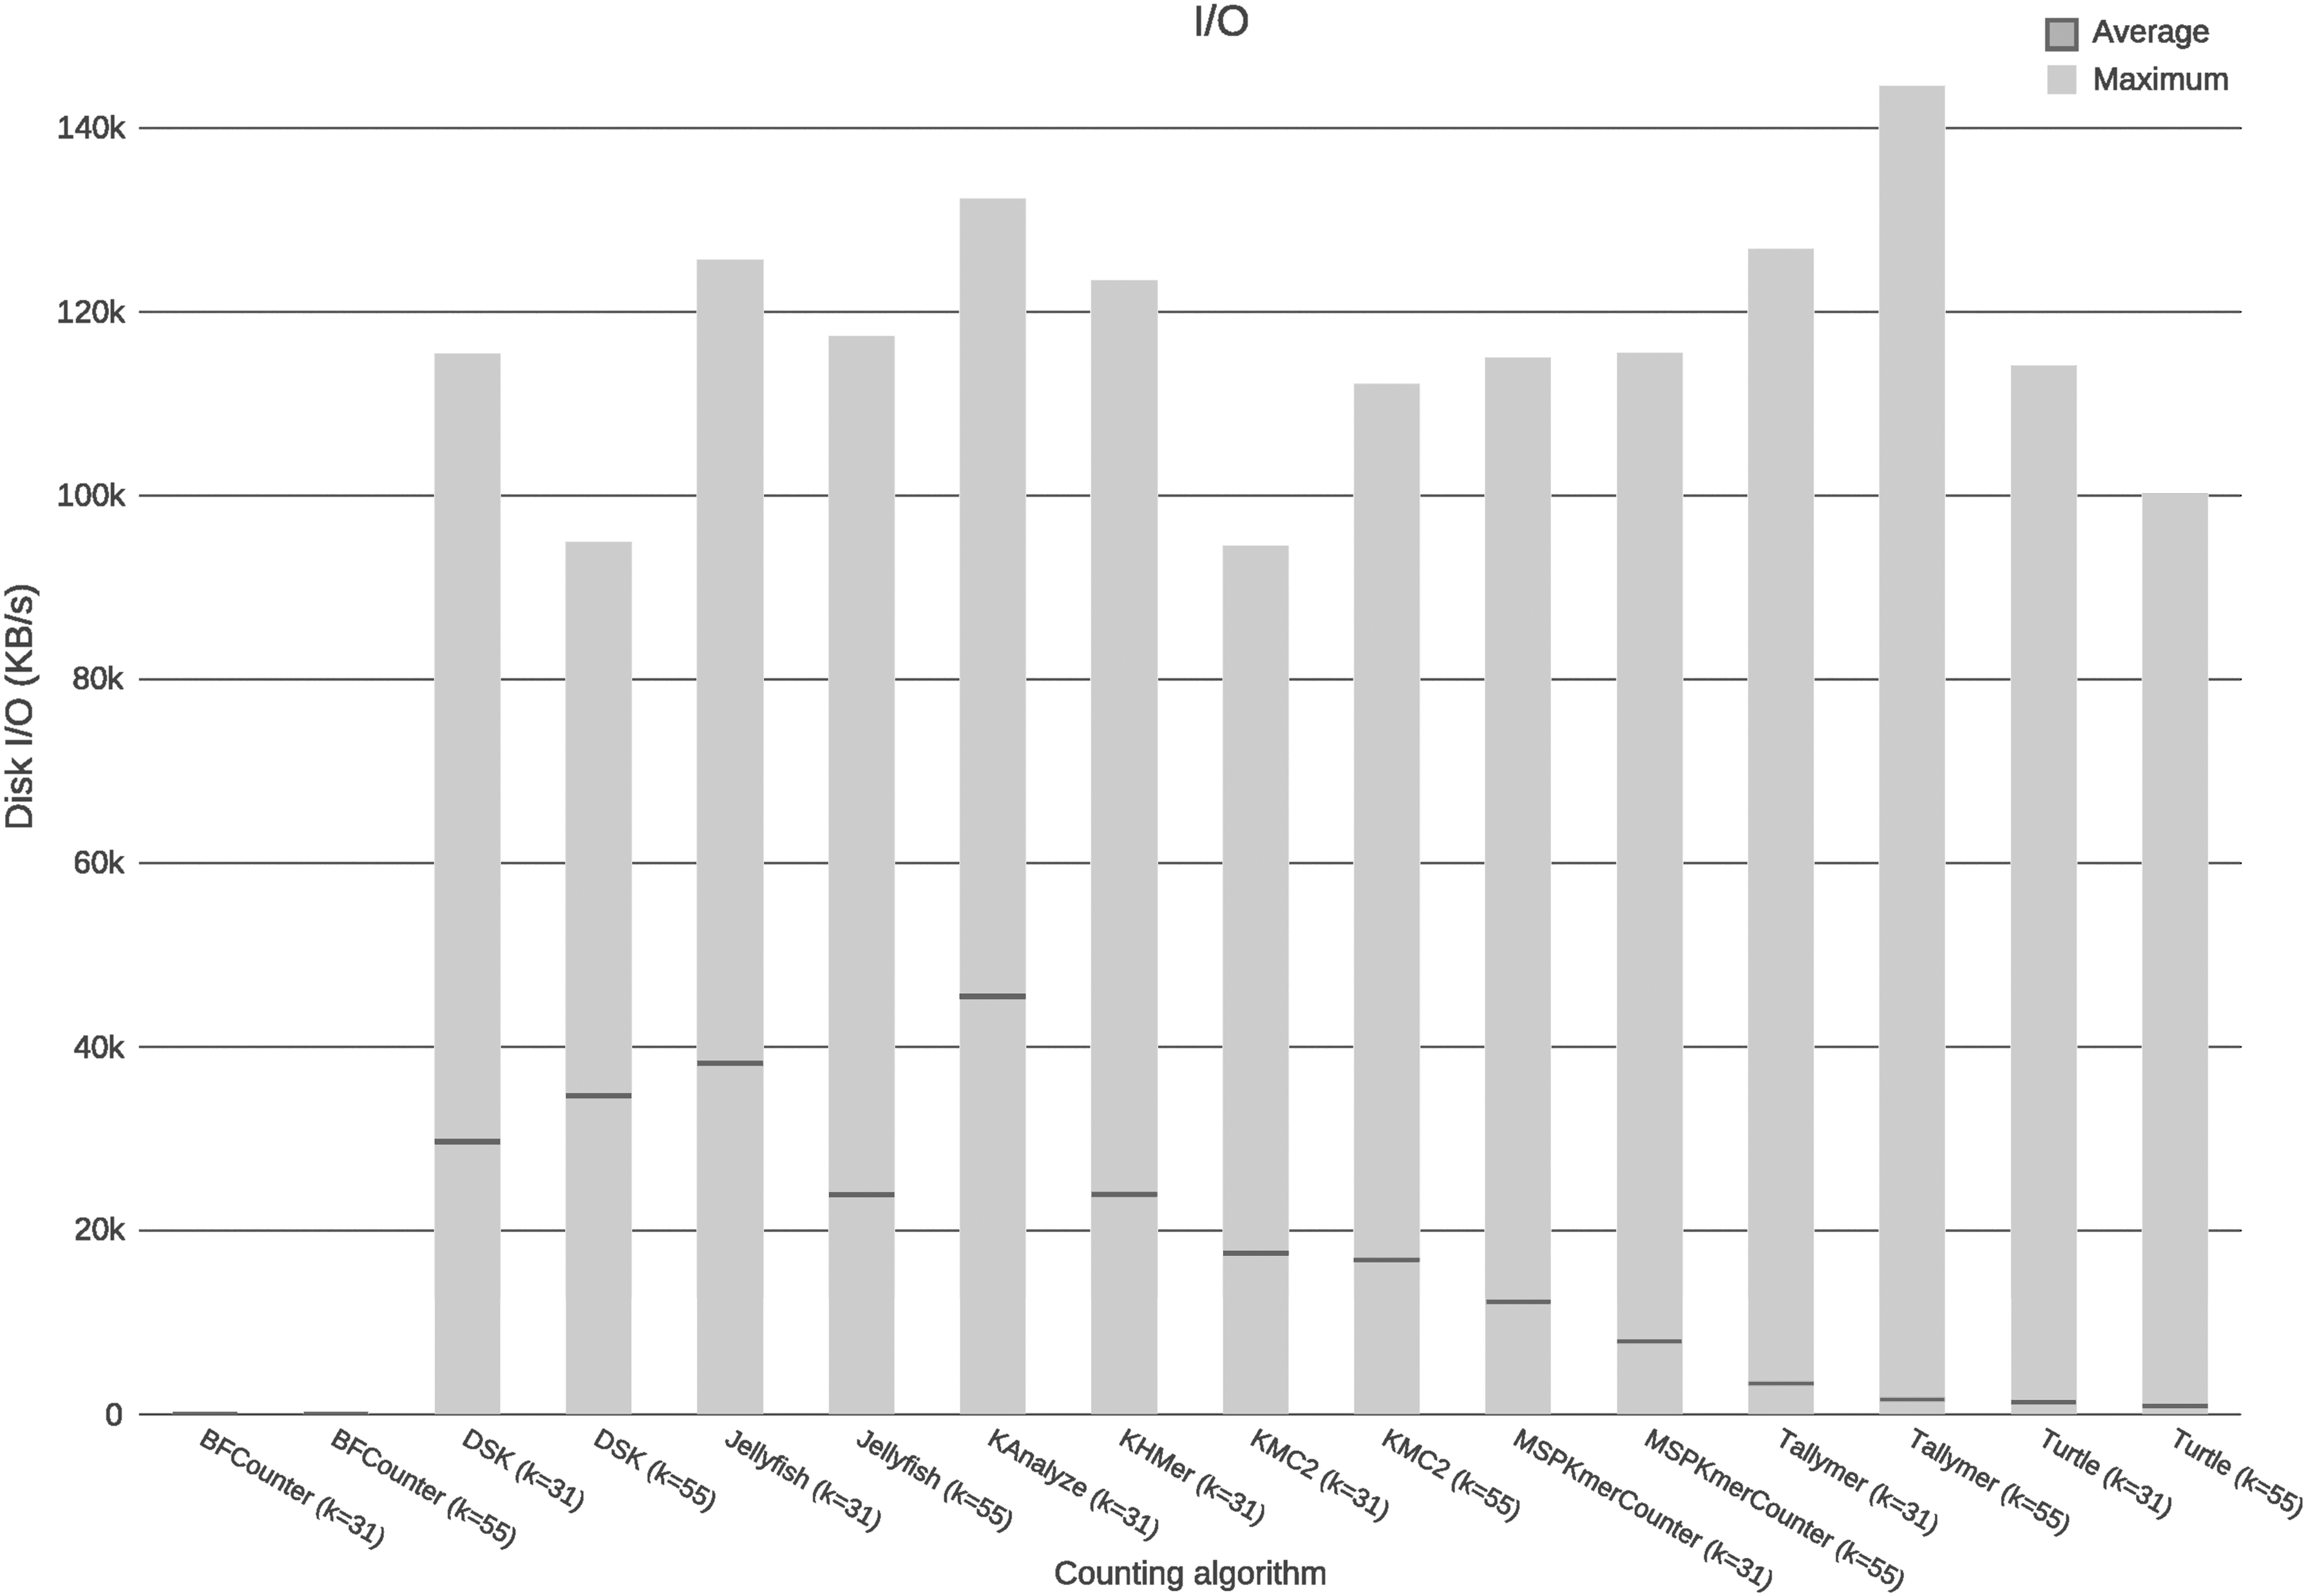
Disk I/O. In the x axis are the tools assessed, and in the y axis are the maximum amount and average amount of disk access used by each tool.
3.4. Parallelization
In Figure 4 and Table 1, the following are shown: the tools with high parallelization in some of their processes are DSK, Jellyfish, KHMer, KMC2, and MSPKmerCounter; the BFCounter tool presents average parallelization in some of its processes, and the tools KAnalyze, Tallymer, and Turtle show lesser parallelization of processes. The DSK tool shows high parallelization, only in few of its processes, unlike the high parallelization present in the majority of the KMC2 processes.
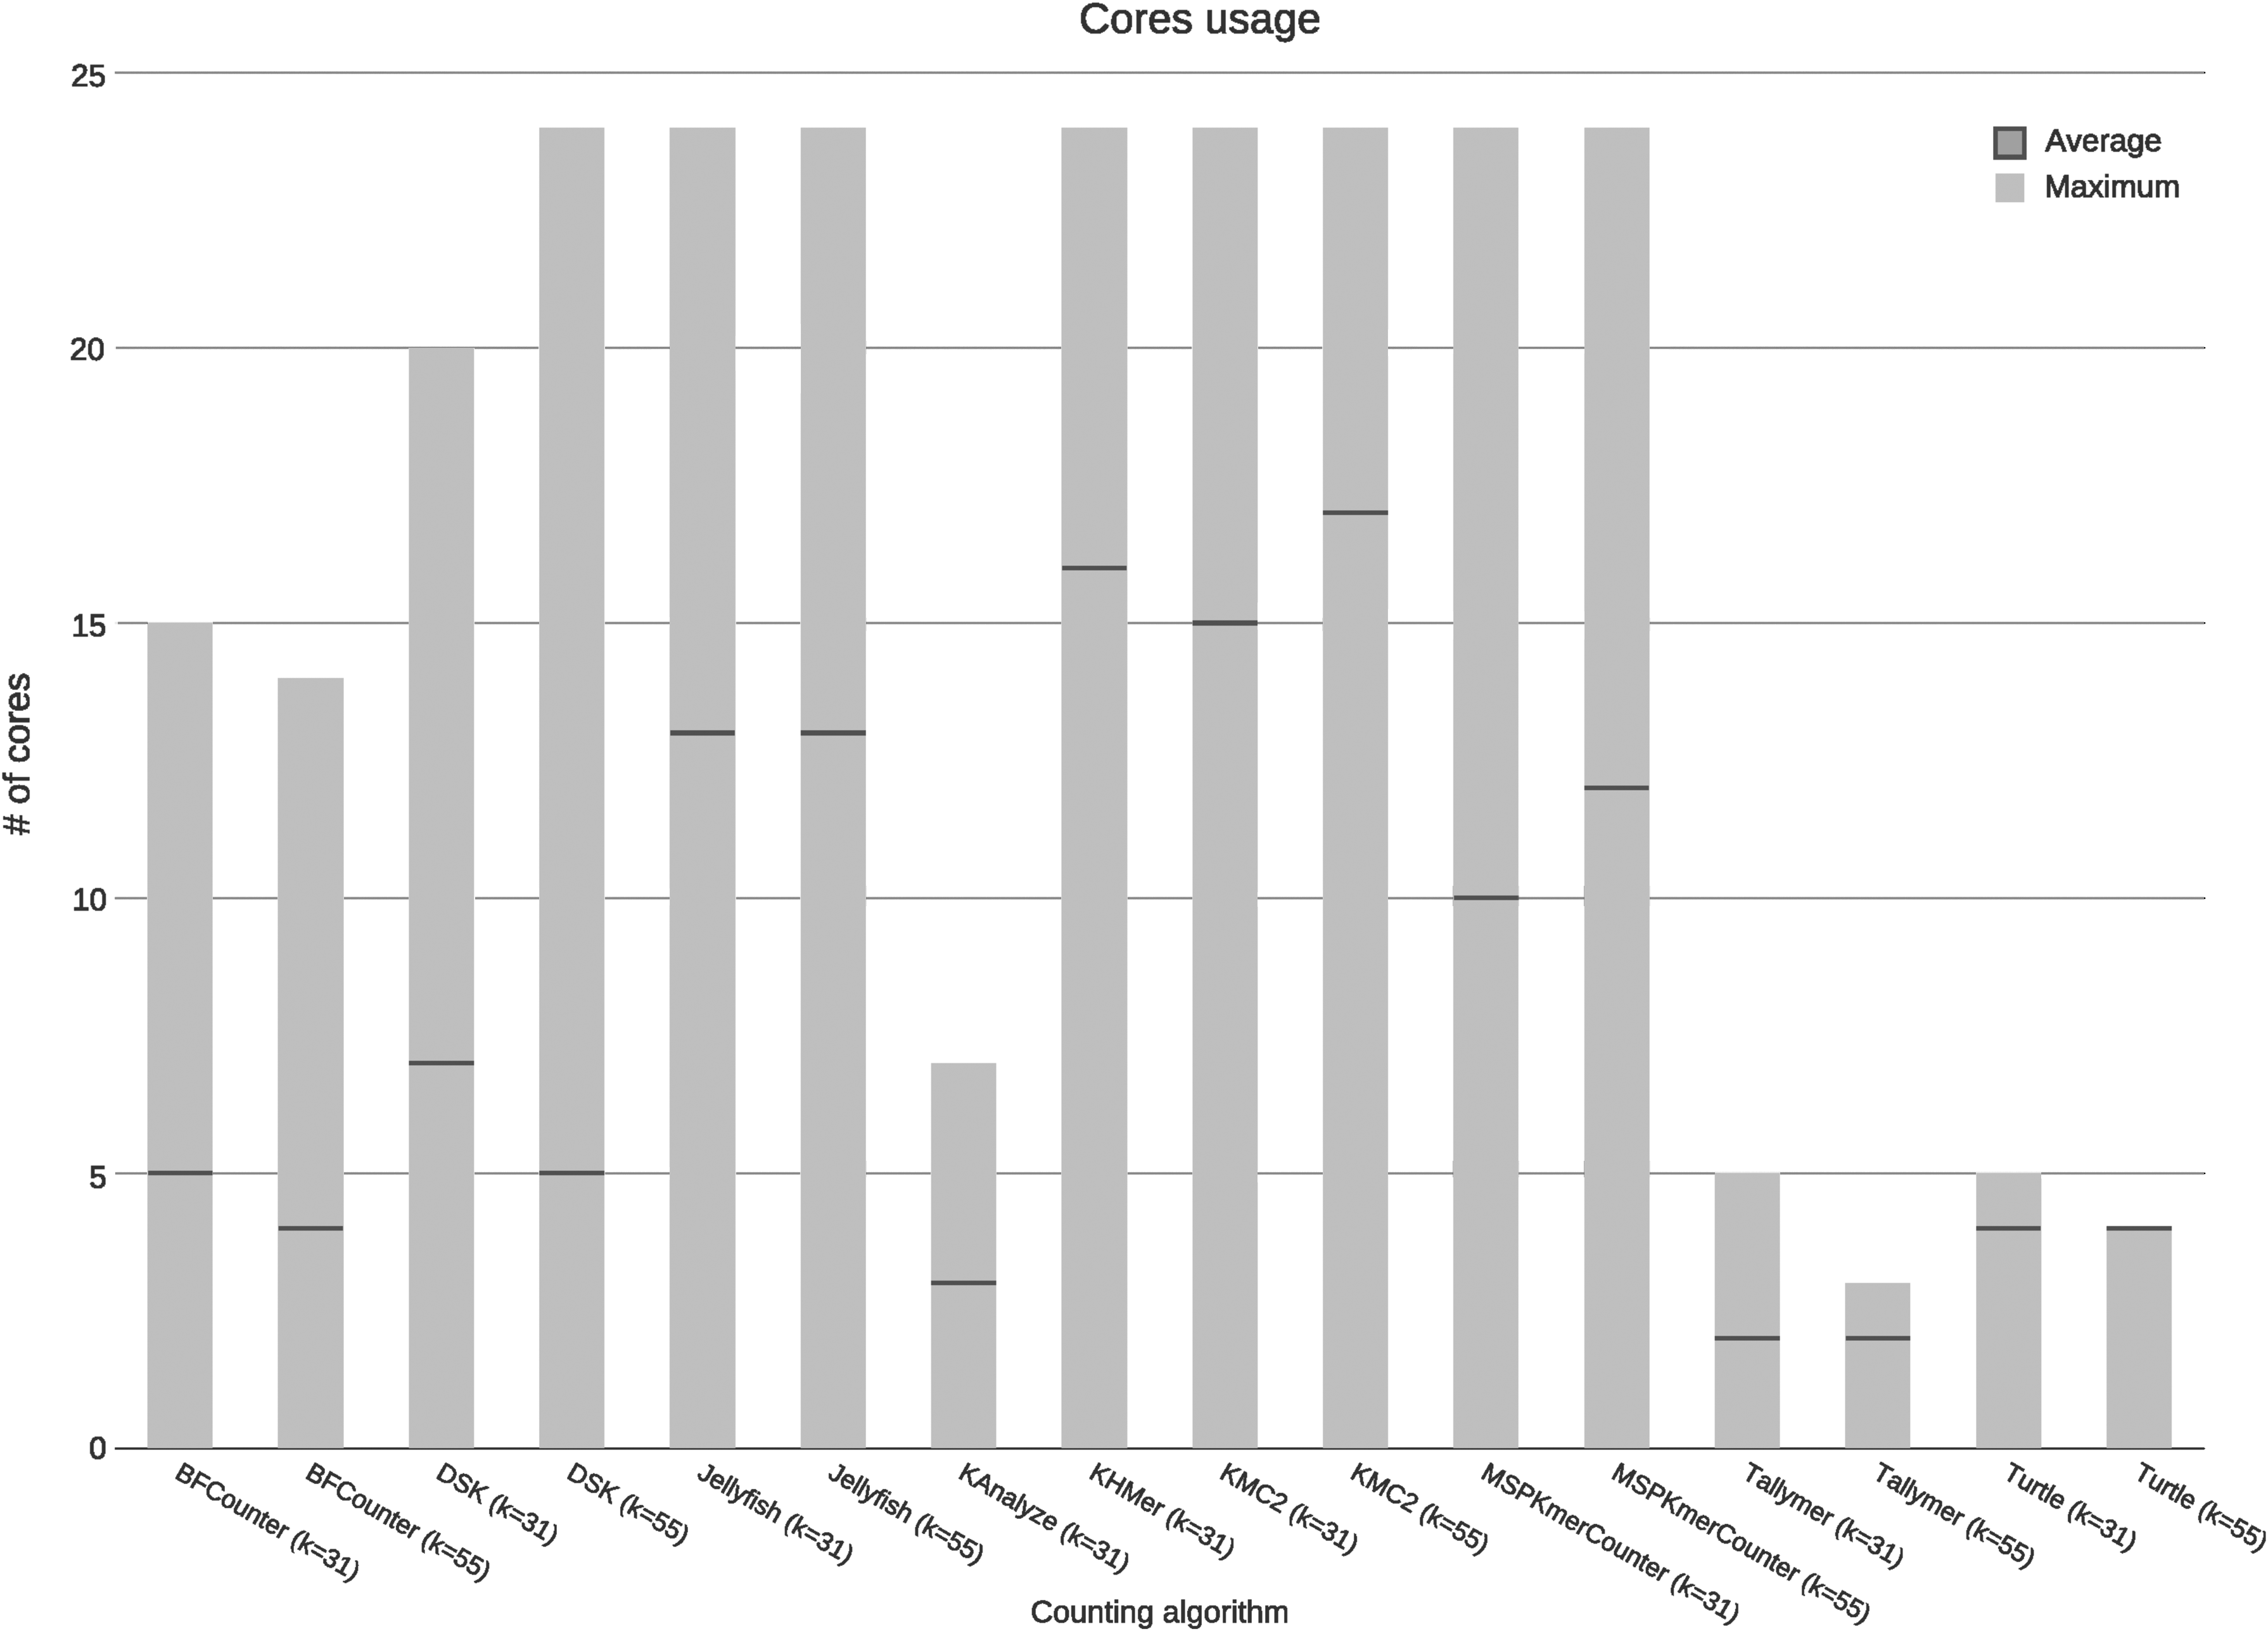
Parallelization. In the x axis are the tools assessed, and in the y axis are the maximum amount and average of processor cores used by each tool.
To see the computational resources required by each tool in function of time, please refer to the Supplementary Material.
4. Discussion
4.1. Bloom filter-based tools
The tools based on the Bloom filter data structure assessed were BFCounter, Turtle, and KHMer. It was evident that the techniques that use this data structure reduce significantly the memory consumption; however, when it is combined with other methods with the purpose of parallelizing its execution (multiple hash tables), the memory requirement increases.
The techniques that use this filter showed a short execution time; however, when the maximum memory use threshold is established using the SAC technique, the execution time increases.
4.2. Disk partitioning-based tools
The partitioning-based tools assessed were DSK, KMC2, MSPKmerCounter, and KAnalyze. It was evident that the tools that use this approach were the ones that took less time in the counting algorithm execution. Furthermore, this technique had access to disk (I/O disk operation) in a more intensive way than other techniques. Regarding the RAM use, moderate use (between 15 and 19 GB) was noted for the tools that used minimizers and a low use (between 2 and 4 GB) for the tools that did not use minimizers for partitioning. Finally, a good parallelism was noted for the tools that use this technique, with KAnalyze as an exception.
4.3. Lpc-interval-based tools
The tool that is based on lpc-interval trees is Tallymer. It was observed that this technique is the one with the major execution time for the chosen genome. Additionally, it was noted that it has a moderate use of RAM, using between 10 and 16 GB. Regarding disk access, a low average of read and write operations was noted. Finally, this technique had a low parallelism, using 3 and 4 cores out of 24 available.
4.4. Hash table with lock-free-based tool
The tool based on hash tables with a lock-free approach evaluated was Jellyfish. This technique has a short execution time, taking around 7 minutes to process the chosen genome. Otherwise, this approach has a moderate RAM use, using around 11 GB of memory. Regarding disk access, an intensive disk use was noted comparable to the partitioning technique on disk. Finally, this technique has a good parallelism, using all the available cores for its execution.
5. Conclusions
The k-mer counting technique that has better performance related to RAM use is Bloom filter, comparable to the tools that use disk partitioning without the minimizers use.
The k-mer counters that use the partitioning disk technique are the ones that took less to execute the counting.
The techniques that use disk partitioning, hash tables with lock-free approach, or multiple hash tables are the ones with the major parallelization, using all the available cores for its execution.
The tools that use the partitioning technique and multiple hash tables are the ones that access intensively the disk, whereas the others have a low amount of read and write operations.
Footnotes
Acknowledgments
Instituto de Genética de la Universidad Nacional de Colombia, Grupo de Inmunología Evolutiva de la Universidad Nacional de Colombia; Centro de Cómputo de Alto Desempeño de la Universidad Distrital Francisco José de Caldas; and Grupo Internacional de Investigación en Informática Comunicaciones and Gestión del Conocimiento de la Universidad Distrital Francisco José de Caldas.
Author Disclosure Statement
The authors have no competing interests to declare.
References
Supplementary Material
Please find the following supplemental material available below.
For Open Access articles published under a Creative Commons License, all supplemental material carries the same license as the article it is associated with.
For non-Open Access articles published, all supplemental material carries a non-exclusive license, and permission requests for re-use of supplemental material or any part of supplemental material shall be sent directly to the copyright owner as specified in the copyright notice associated with the article.