
Abstract
Abstract
The selection of relevant genes for breast cancer metastasis is critical for the treatment and prognosis of cancer patients. Although much effort has been devoted to the gene selection procedures by use of different statistical analysis methods or computational techniques, the interpretation of the variables in the resulting survival models has been limited so far. This article proposes a new Random Forest (RF)-based algorithm to identify important variables highly related with breast cancer metastasis, which is based on the important scores of two variable selection algorithms, including the mean decrease Gini (MDG) criteria of Random Forest and the GeneRank algorithm with protein–protein interaction (PPI) information. The new gene selection algorithm can be called PPIRF. The improved prediction accuracy fully illustrated the reliability and high interpretability of gene list selected by the PPIRF approach.
1. Introduction
B
Recently, a number of gene selection methods have been proposed for breast cancer metastasis prediction, including statistical test methods and correlation coefficient methods. The first category used the cox survival analysis models or other statistical tests to determine the role of the most significant gene sets (van de Vijver et al., 2002; van't Veer et al., 2002; Wang et al., 2005; Weigelt et al., 2005). For example, two large-scale expression studies by van't Veer et al. (2002) and Wang et al. (2005) each have identified ∼70 gene markers that were 60%–70% accurate for successful metastasis prediction. However, these two gene sets only shared three common genes. This will be described as an independent factor gene screening that cannot be obtained with high-robustness gene sets. The second category used a correlation coefficient (such as Pearson's correlation coefficient) between genes to establish coexpressed gene subnet or module to filter out the most relevant collections (Chuang et al., 2007; Ruan et al., 2010; Chen and Deem, 2013). However, the changes in gene chip types and experimental environment inevitably lead to changes in the value of the correlation coefficient, making it difficult to have a universal method calculated based on the coexpression subnet or module. Therefore, it is reasonable to incorporate new effective feature information and develop effective models to analyze the breast cancer risk for an individual patient.
Recently, the protein–protein interaction (PPI) network information has been proven to be effective in picking out the gene sets that are more explanatory (Binder and Schumacher, 2009; Johannes et al., 2010; Garcia et al., 2012; Wang et al., 2012, 2013). In this study, we attempted to incorporate this important information based on a new algorithm called PPIRF for breast cancer metastasis prediction. Our contributions here are not only in incorporating PPI information into the breast cancer metastasis prediction but also in putting GeneRank sort (Morrison et al., 2005) as an addition to the variable importance of Random Forests (RFs) classifier. The 10-fold cross-validation (CV) results demonstrated that the PPI as a priori knowledge of the genes can improve the accuracy. Furthermore, about 50 genes were identified as markers by the method. These genes can discriminate patients who developed distant metastases from those remaining metastasis free for 5 years.
2. Materials
2.1. Breast cancer data sets
In this study, we selected four types of breast cancer data sets (GEO accession Nos. GSE6532, GSE2034, GSE7390, GSE11121) from the GEO (www.ncbi.nlm.nih.gov/geo/) database (Barrett et al., 2007). These data sets were obtained from the node-negative breast cancer patients who only received surgical treatment without systematic chemical treatment. The microarray platform of the data sets used was Affymetrix HG-U133a. Raw data were preprocessed by the R package named “affy” (robust multichip average; Irizarry et al., 2003). Finally, we get the data sets consisting of 809 patients with 22,283 genes in each patient. Table 1 listed the breast cancer data sets used in the study.
2.2. Protein–protein interaction data
The Human Protein Reference Database (HPRD) (Prasad et al., 2009) is a database of curated proteomic information pertaining to human proteins. By mapping the proteins to the gene presented on the microarray in the experiments, we got 39,240 interactions between 7932 genes. Particularly, there is a situation when multiple protein isoforms for a gene exist. As long as a relationship between one protein isoform and another protein isoform in this situation is confirmed, an intersection between the two genes of these protein isoforms will be set. We obtained the PPI data from the HPRD (June 29, 2010). The element
3. Methods
3.1. Overview of the method
As shown in Figure 1, the PPIRF algorithm combines two classical gene selection methods based on the RF classifier. The first one is to consider the important score of the mean decrease Gini (MDG) criteria and recursive genetic screening. The second one is to apply GeneRank algorithm to calculate gene rank by integrating with gene expression data and PPI information. By combining the two sorting methods, the new sort of features (NewRank [NR]) with a priori knowledge was extracted and integrated into the RF classifier. Finally, we selected four data sets of patients with node-negative breast cancer to measure the classification results of PPIRF.
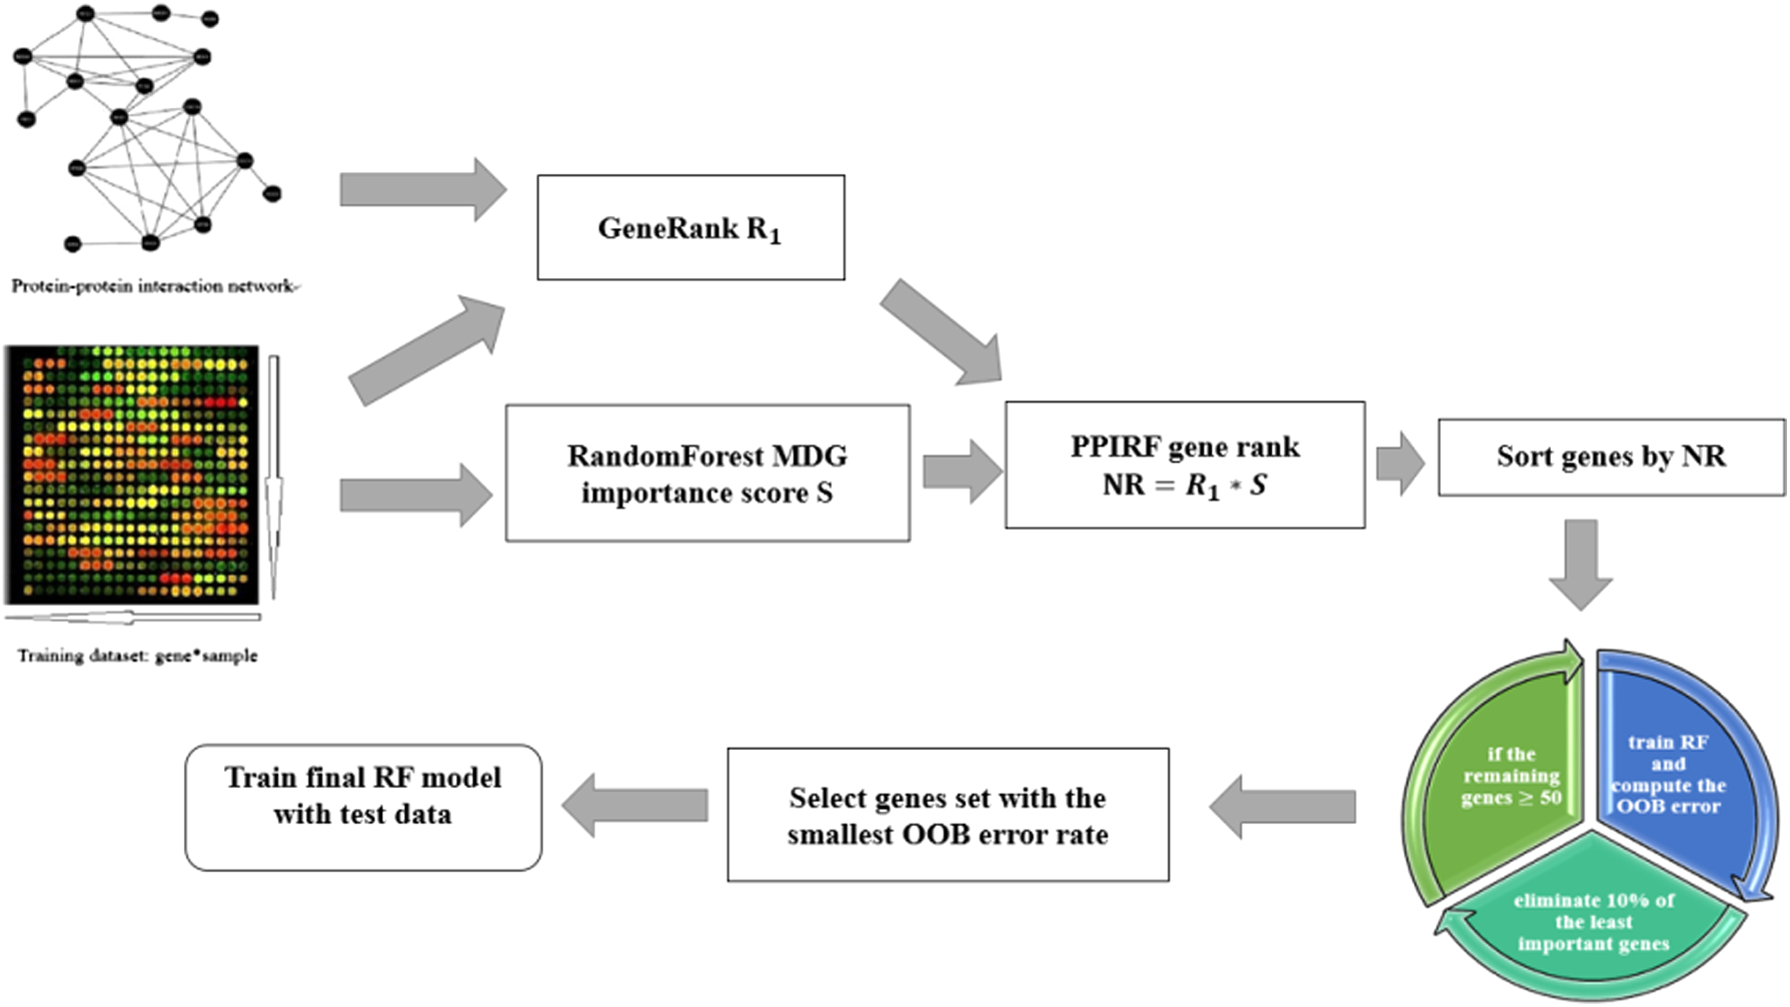
The flowchart of PPIRF method. PPI, protein–protein interaction; RF, Random Forest.
3.2. Random forest
RF is a classifier that contains multiple decision tree, which has been applied successfully for various bioinformatic problems in recent years (Breiman, 2001; Liaw and Wiener, 2002; Strobl et al., 2009). For each tree, it not only uses a bootstrap sample to build each of the classification trees but also randomly uses a certain percentage of all the features. A lot of research has demonstrated that RFs can provide a variable ranking mechanism to select important variables. Therefore, this study applies the RF method to deal with large numbers of predictor variables in the process of random feature selection.
3.3. Variable selection technique
The selection of a smaller number of variables before sample classification is critical for breast cancer gene selection. To select a subset of variables that has classification capability, the study uses two variable selection methods, including mean decrease Gini method and GeneRank method. The final procedures of variable selection are based on the combination of the variable importance scores.
3.3.1. Mean decrease Gini method
To establish variable importance, this study first uses the MDG method for variable selection (Strobl et al., 2007). MDG is the sum of all decreases in Gini impurity due to a given variable, normalized by number of trees (Menze et al., 2009). The Gini index at node v of RF, Gini(v), is defined as follows:
where
The formula represents the difference between the impurity and the weighted average of impurities at each node of v.
The importance score for gene
where
3.3.2. GeneRank method
GeneRank (Morrison et al., 2005) is an intuitive modification of Google PageRank algorithm (Brin and Page, 1998). GeneRank provides an alternative method to calculate a rank for each node by combining prior knowledge into the PPI network. This study attempted to use the GeneRank algorithm for gene selection. The GeneRank method includes several steps as given below.
Let the set
where 0 < d < 1 is the damping factor. If
The rank of gene
where the rank method is sorted in descending order. As
The fold-change information and PPI matrix were used to calculate a ranking (
3.3.3. Feature ranking criterion
By combining the two sorting methods, we get a new gene scoring method called NR, which is defined as follows:
This ranking method takes both the impact of a particular gene in classification algorithm and the connectivity of the gene in the underlying biological network into account, which can significantly reflect all the influences from the two parts. We iteratively fit the RF classifier and record each out-of-bag (OOB) error rate and then discard 10% genes with the smallest NR. As ∼70 genes have been previously identified as the markers for breast cancer metastasis, the threshold value was set as 50 to control the number of genes in the subset. After fitting all forests, we choose the smallest number of genes with a low OOB error rate.
3.4. Performance evaluation
The classification accuracy of the methods was assessed by two criteria: the area under precision–recall curve (AUPR) and the area under ROC curve (AUC). AUC is a composite indicator that reflects the sensitivity and specificity of continuous variables. When the AUC value approaches more to 1, it indicates the better classification. However, AUC criterion is magnitudes of ordering more negative than positive examples. So, we chose the P-R curve, which is the plot of the ratio of true positives among all positive predictions for each given recall rate. The AUPR is the area under P-R curve, and when AUPR value approaches more to 1, it indicates the better classification. Based on AUC value and AUPR value, the prediction accuracy of PPIRF algorithm is evaluated by 10-fold CV tests. In a 10-fold CV, the training data set was spilt into 10 subsets, where 1 of the data set was used as the test set while other 9 subsets were used for training the classifier. The trained classifier was tested by the test set. The process is repeated 10 times and takes a mean accuracy to get a fair evaluation.
4. Results and Discussion
4.1. The performance of breast cancer metastasis prediction
To illustrate the effect of the method, we chose VarSelRF (Díaz-Uriarte and De Andres, 2006) and RRFE (Johannes et al., 2010) for comparison. Both methods have been reported to have the ability to pick out the subset of genes for significant effect classification with a high accuracy. First, VerSelRF is the approach for gene selection using RF 10 genes, which is the same as part of our PPIRF. Díaz-Uriarte showed that the VarSelRF returns very small sets of genes compared to other variable selection methods, while retaining predictive performance. However, the VerSelRF does not consider the role of PPI information for the gene selection. Therefore, we chose the VerSelRF method for comparison to illustrate the importance of PPI information. Second, PPIRF was compared with the RRFE, which is based on the support vector machine (SVM) algorithms with the pathway knowledge. With the pathway knowledge, the RRFE method outperformed most of gene selection. So, we chose the RRFE as the other contrast algorithm.
Table 2 shows the AUC and AUPR values of three methods on the four data sets. It is obvious the AUC and AUPR values of PPIRF method have been significantly increased than the other two methods in the three data sets, except for GSE2034 fairly. Our empirical comparison with the two methods demonstrates that PPIRF is a promising approach to gene feature selection from high-dimensional gene expression data. Figure 2 shows the ROC and PR curve of three methods in four data sets.

ROC curve and PR curve of three methods in four data sets.
AUC, area under ROC curve; AUPR, area under precision–recall curve; PPI, protein–protein interaction; RF, Random Forest; SD, standard deviation.
4.2. Comparison with different data sets
According to the AUC and AUPR in Table 2, the PPIRF algorithm used with the four data sets has been proven to perform better than other methods. The result of GSE11121 presented the most significant improvement. Therefore, we chose the GSE11121 as the training data to pick out the 74 genes. To illustrate the ability of the 74 genes to predict breast cancer metastasis, we use them as the feature set for the four breast cancer data sets. We chose RF as the classifier and use AUC and AUPR values for evaluating classification performance. Figure 3 shows the classification result of four data sets based on 74 genes. As shown in Figure 3, the AUC values of GSE7390, GSE2034, and GSE11121 were greater than 0.6, and AUPR values were greater than 0.3. It means that the description of the 74 genes in the different data set was able to get a better classification result.

The ROC curve and PR curve of four data sets based on 74 genes (100 probes).
4.3. Predicted genes related with breast cancer metastasis
Table 3 lists the top 10 genes that are related with breast cancer in the 74-gene list. For instance, CD44 has been found to be upregulated in breast cancer, which is critical in tumor progression and metastasis (Anand and Kumar, 2014). SRC, TP53, and CDKN2A are already known to be metastasis related (De Mattos-Arruda et al., 2014; Fernandez et al., 2014; Sänger et al., 2014; Xiao et al., 2014). The results demonstrated that the gene list has strong predictive power and biological significance.
In addition, we analyzed the biological pathways associated with the 74 genes according to the Reactome database (www.reactome.org/). The 20 pathways with the smallest false discovery rate (FDR) are shown in Table 4. Although 21 of the 74 genes have unknown pathways, several pathways associated with cancer were identified, such as signaling by ERBB2 and loss of function of SMAD2 in cancer. It means the method of gene selection can return sets of genes that are highly correlated.
4.3.1. Survival analysis of the predicted genes
The SurvExpress is a web-based tool that provides survival analysis and risk assessment of cancer data sets. We applied survival analysis and risk assessment of breast cancer data sets (e.g., GSE2034) by the SurvExpress (Aguirre-Gamboa et al., 2013).
Figure 4 shows the Kaplan–Meier plot by risk group, red and green curves denoting high- and low-risk groups, respectively. The title of this plot shows the Concordance Index (CI), which is a generalization of the AUROC used in classification problems. The CI values approaching to 0.5 mean putatively “random,” whereas higher values mean better prediction. In addition, the p-value of log-rank tests for the differences of the two groups is smaller than 0.05. The p-value shows that the 74 genes can distinguish two risk groups significantly. An estimation of the hazard ratio by the Cox proportional hazards model represents the relative risk between two risk groups.

Kaplan–Meier curves and performance of the 74 genes as biomarkers in the GSE2034 data set. Low and high risks are drawn in green and red, respectively.
In addition, the heat map was further used for the survival analysis (Fig. 5). According to predictions, the sample was divided into high-risk and low-risk groups. Correspondingly, the truth is that 179 patients did not develop distant metastasis and others developed distant metastasis. By comparing the actual group and forecast group, we can see that 74 genes can obtain a good performance in survival risk prediction.
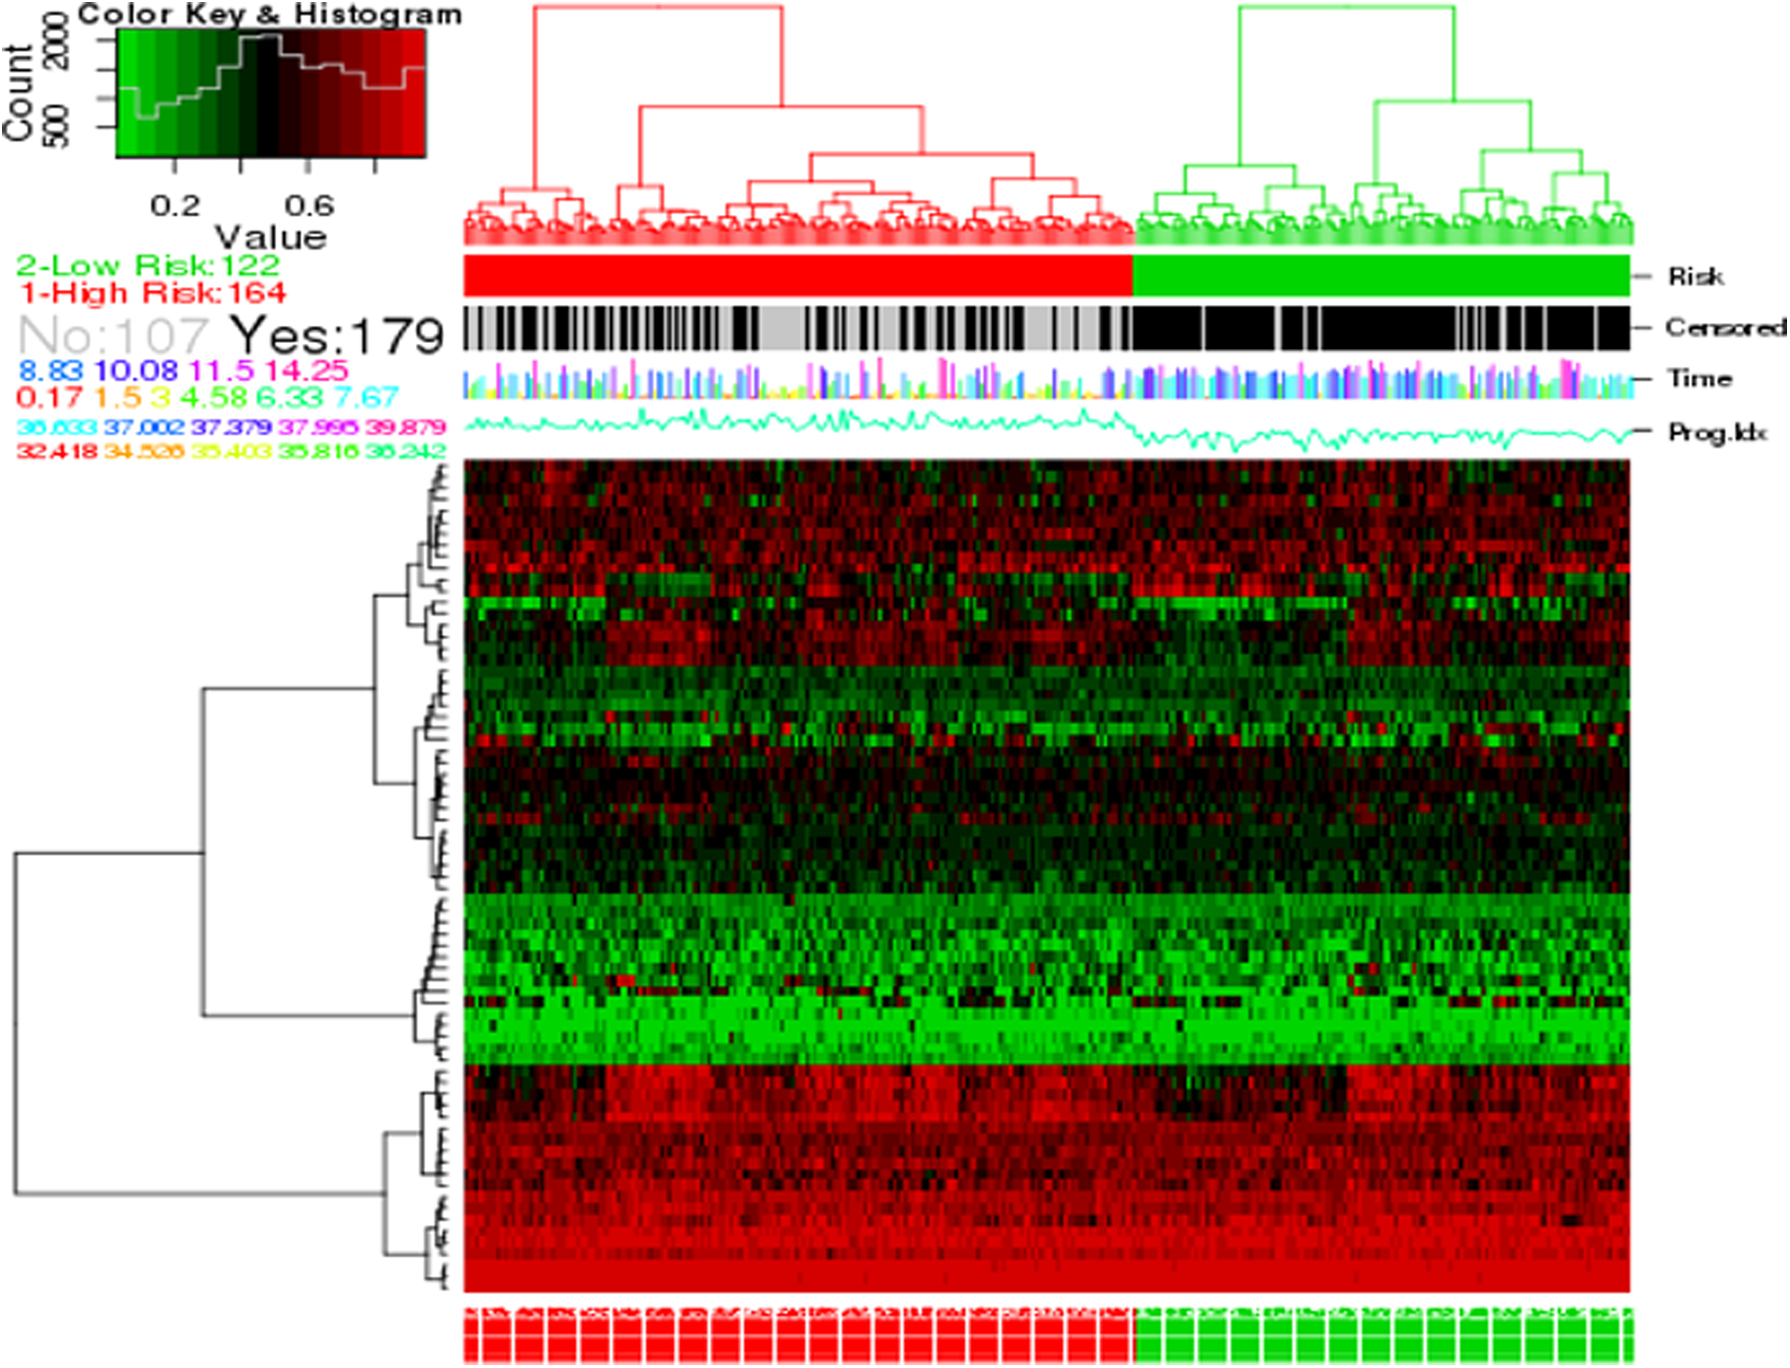
Heat map shows the expression of 74 genes (rows) along GSE2034 samples (columns) in risk groups.
5. Conclusion
Metastasis is one of the main causes of death for breast cancer patients. Picking out the subsets of the most relevant feature from high-throughput gene expression data is critical to predict distant metastasis of breast cancer. This study presented a new PPIRF algorithm to select the relevant genes for breast cancer metastasis with a high accuracy. The main contribution of this study lies in data integration via the use of different gene selection methods. The experiment, using four data sets of breast cancer, proves that the proposed gene ranking technique is capable of producing better classification performance over those that were produced by earlier methods. In addition, incorporating PPI information into the gene selection process can make the gene list more biologically explanatory. Theoretically, the proposed algorithm can be applied in any similar situation of gene selection. It is believed that the method will potentially provide more reliable functional linkage information and allow us to discover functional relationships between proteins more accurately and efficiently. However, the proposed algorithm applied on breast cancer cannot guarantee to be applicable in all other cases of gene selection. For the next step, we will test the method on more cases to improve its applicability and to further improve the algorithm from the various cases.
Footnotes
Acknowledgments
This work was partially supported by the National Basic Research Program of China (Grant No. 2012CB910400), the National Natural Science Foundation of China (Grant No. 81330059), the National Major Scientific and Technological Special Project for “Significant New Drugs Development” (2013ZX09507001), the National Science and Technology Support Plan Project (2015BAH12F01), and the Science and Technology Commission of Shanghai Municipality (14DZ2270100).
Author Disclosure Statement
The authors declare that no competing financial interests exist.