
Abstract
Abstract
SNP (single nucleotide polymorphism) is a popular tool for the study of genetic diversity, evolution, and other areas. Therefore, it is necessary to develop a convenient, utility, robust, rapid, and open source detecting-SNP tool for all researchers. Since the detection of SNPs needs special software and series steps including alignment, detection, analysis and present, the study of SNPs is limited for nonprofessional users. CsSNP (Comparative segments SNP, http://biodb.sdau.edu.cn/cssnp/) is a freely available web tool based on the Blat, Blast, and Perl programs to detect comparative segments SNPs and to show the detail information of SNPs. The results are filtered and presented in the statistics figure and a Gbrowse map. This platform contains the reference genomic sequences and coding sequences of 60 plant species, and also provides new opportunities for the users to detect SNPs easily. CsSNP is provided a convenient tool for nonprofessional users to find comparative segments SNPs in their own sequences, and give the users the information and the analysis of SNPs, and display these data in a dynamic map. It provides a new method to detect SNPs and may accelerate related studies.
1. Introduction
T
Comparative segments SNPs are those that exist in the synteny segments of different varieties or even different species, such as the function gene and the conserved segments. A recent study shows that these SNPs are closely related with human disease and gene functions (Marzolini et al., 2004). Some studies have even analyzed the evolution relationship of the comparative SNPs between different species (Chimpanzee Sequencing and Analysis Consortium, 2005), and more related studies are in progress.
To make SNPs more useful, a series of software and databases have been developed in recent years. GATK (McKenna et al., 2010) is a classic one. BWA (Li and Durbin, 2009) combined with SAM tools (Li et al., 2009) is one of the more widely used SNP detectors, while Soapsnp (Li et al., 2009) is the fastest detector. All these tools are based on the Linux (UNIX) operating system and mainly analyze resequencing data. At the same time, some web-based platforms also provide service about SNPs, such as FunctSNP (Goodswen et al., 2010), snp-search (Al-Shahib and Underwood, 2013), and SNPsea (Slowikowski et al., 2014).
All these software are of great help to researchers in the study of SNPs. But they are not enough. SoapSNP and most of other SNP detectors only can detect SNPs between the reference sequence and the resequencing data, which must be in the format of FASTAQ, and most of them also need professional knowledge of Linux and professional computer language. These are not easily used for nonprofessional researchers, and also limit the number of users. In addition, a tool to detect the comparative segments SNPs is lacking.
CsSNP (http://biodb.sdau.edu.cn/cssnp/) aims to provide a convenient tool for nonprofessional users to find comparative segments SNPs in their own sequences, and give the users the information and the analysis of SNPs and display these data in a dynamic map. These SNPs may related to the evolution, disease, or other phenotype, so it can make the study easier and provide new insight to the genomic function studies. CsSNP also provides a new method to detect SNPs and may accelerate the related studies.
2. Methods
CsSNP contains genome sequences and coding sequences of 60 plant species (Supplementary Table S1; supplementary material is available online at www.liebertpub.com/cmb), including almost all the sequenced species. These sequences are treated with four steps, including alignment, detection, filter and statistics, and the results present (Fig. 1). All these steps are based on the Blat, Blast and a series of Perl scripts.

The flowchart of CsSNP. The sequences from the users will be treated with four steps including alignment, detection, filter and statistics, and the results present.
2.1. Sequence alignment
CsSNP mainly deals with the ordinary sequence in the FASTA format and the sequence should just be a scaffold, such as gene, CDS sequence, or even an unknown segment. The sequences from the users will be first aligned with the reference sequence by Blat (Doerks et al., 2002), Blast, or both. The alignment will find the high similar sequences that are more likely to be the homologous sequences in the query and database. The Blat alignment will find fewer SNPs with a higher similarity and longer match sequence. The Blast alignment can find more SNPs, but sometimes it is not as effective as Blat.
2.2. Variation detecting
Using a Perl pipeline, the alignment sequence that is shorter than the user parameter or the default will be ignored. The difference between the high quality alignments will be detected and stored according to the parameter of this program. In this tool, the position of the insert position is the left base of this insert on the normal sequence. All differences obey the parameter that is selected to do the further filter and analysis.
2.3. Data filter and analysis
After getting the variation data, the results are filtered by several rules. The first rule is that the continuous SNPs must not be longer than the parameter. The second rule is that the ambiguous base will be ignored, such as the “N” and other words. The third rule is that the insert and lost will be treated as short indels, and SNPs only contain replacements and transversions. The variation will be classified into four types: replacement, transversion, insert, and lost. The number of each variation is counted and presented. At the same time, the frequency of each variation and the continuous variations are also annotated to the detail information.
2.4. Dynamic present
All the various information is presented as a Gbrowse map (Fig. 2), which is composed of three parts. The first part contains blue blocks that indicate the alignment area on the reference sequence. The second part contains red circles that indicate the positions of SNPs. The third part shows some green triangles, which are the symbol of the insert and lost. If there are several reference sequences involved, the sequence will be assembled into one sequence with a 100 bp gap between every two.
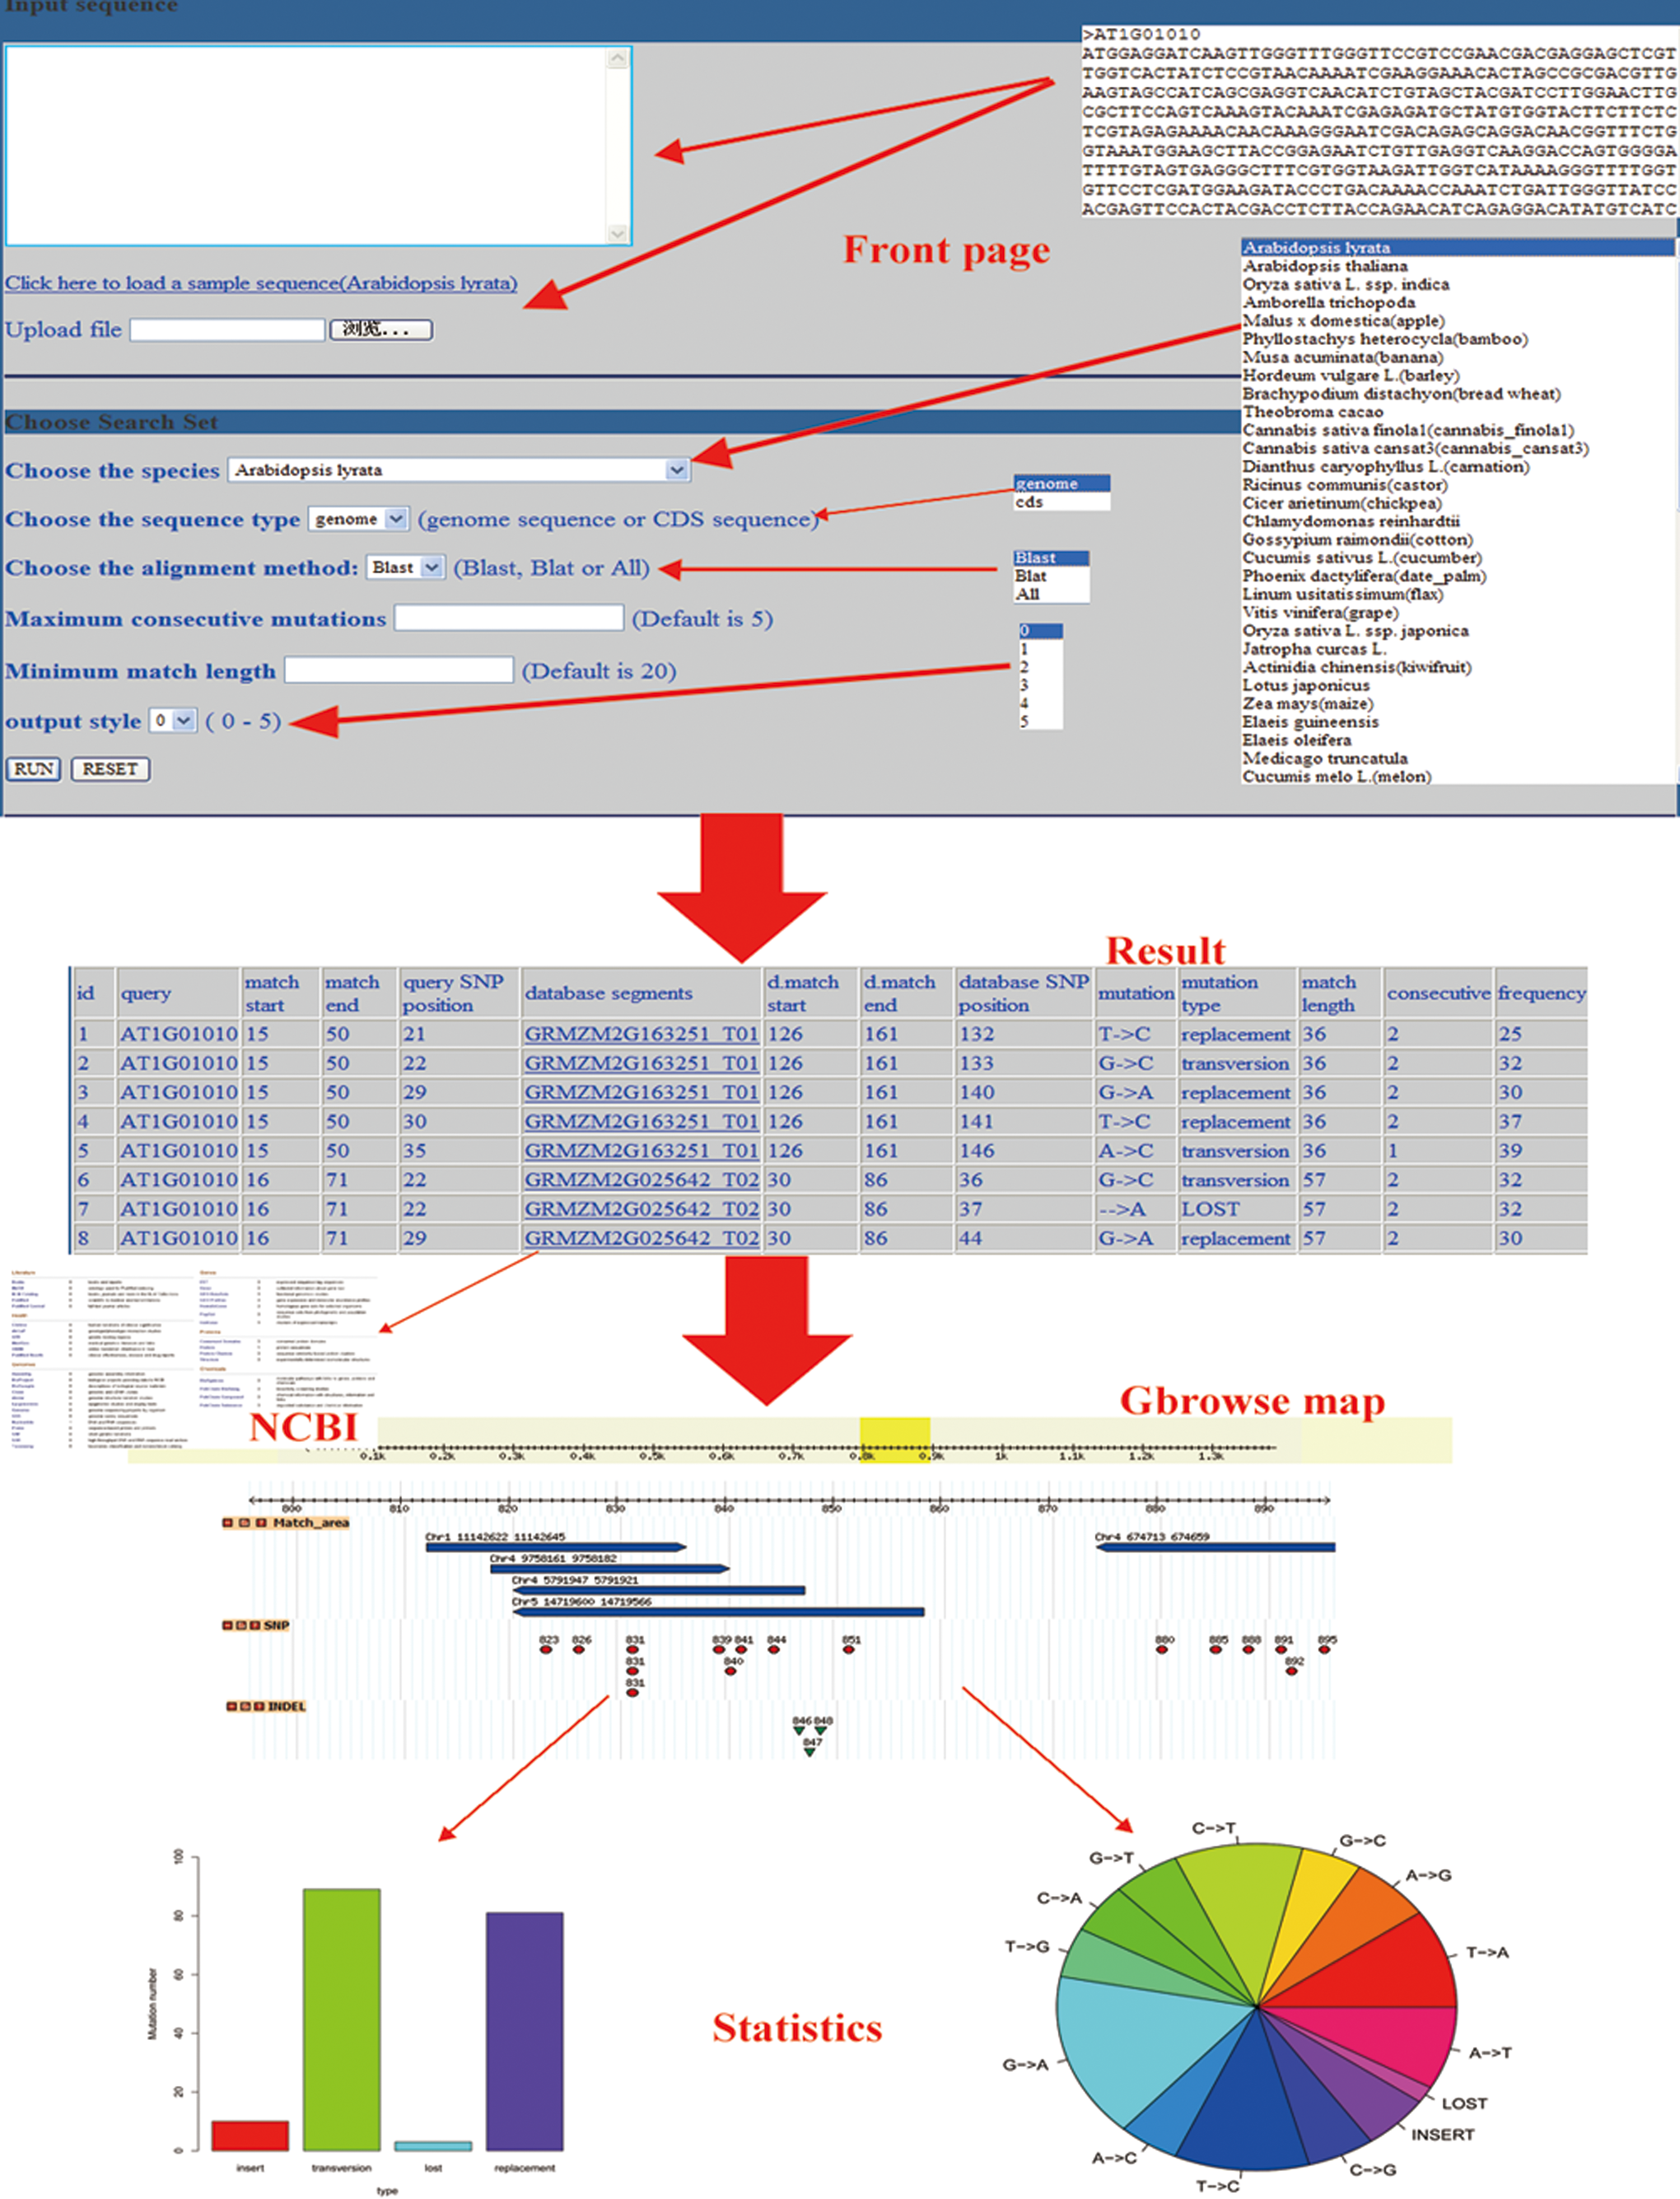
The dynamic present of CsSNP.
There are also two figures in the format of PDF that can be downloaded from the result page which have been drawn by the R based on the statistics. The first figure is a pie chart of 14 types of variation, including the insert and lost. The second one is a bar chart showing the number of replacement, transversion, insert, and lost.
2.5. Output style
The output package contains three files of the sequence analyzed, SNPs information, and the output report. For the file of SNPs information, six output formats will be provided to show different types detail information of the SNPs (Fig. 3); they provide different types of data to the users. Of all these six output styles, 5 has the most detailed description, and 3 may be more fit for programmed handle. This report file contains the analysis of the input sequences and the statistics of SNPs. The report will remain for 20 minutes for the user to download. There are two usage introductions in Chinese and English, both of which can be downloaded from the web. This platform also provides four Perl scripts for the users to pretreat and analyze the sequence.
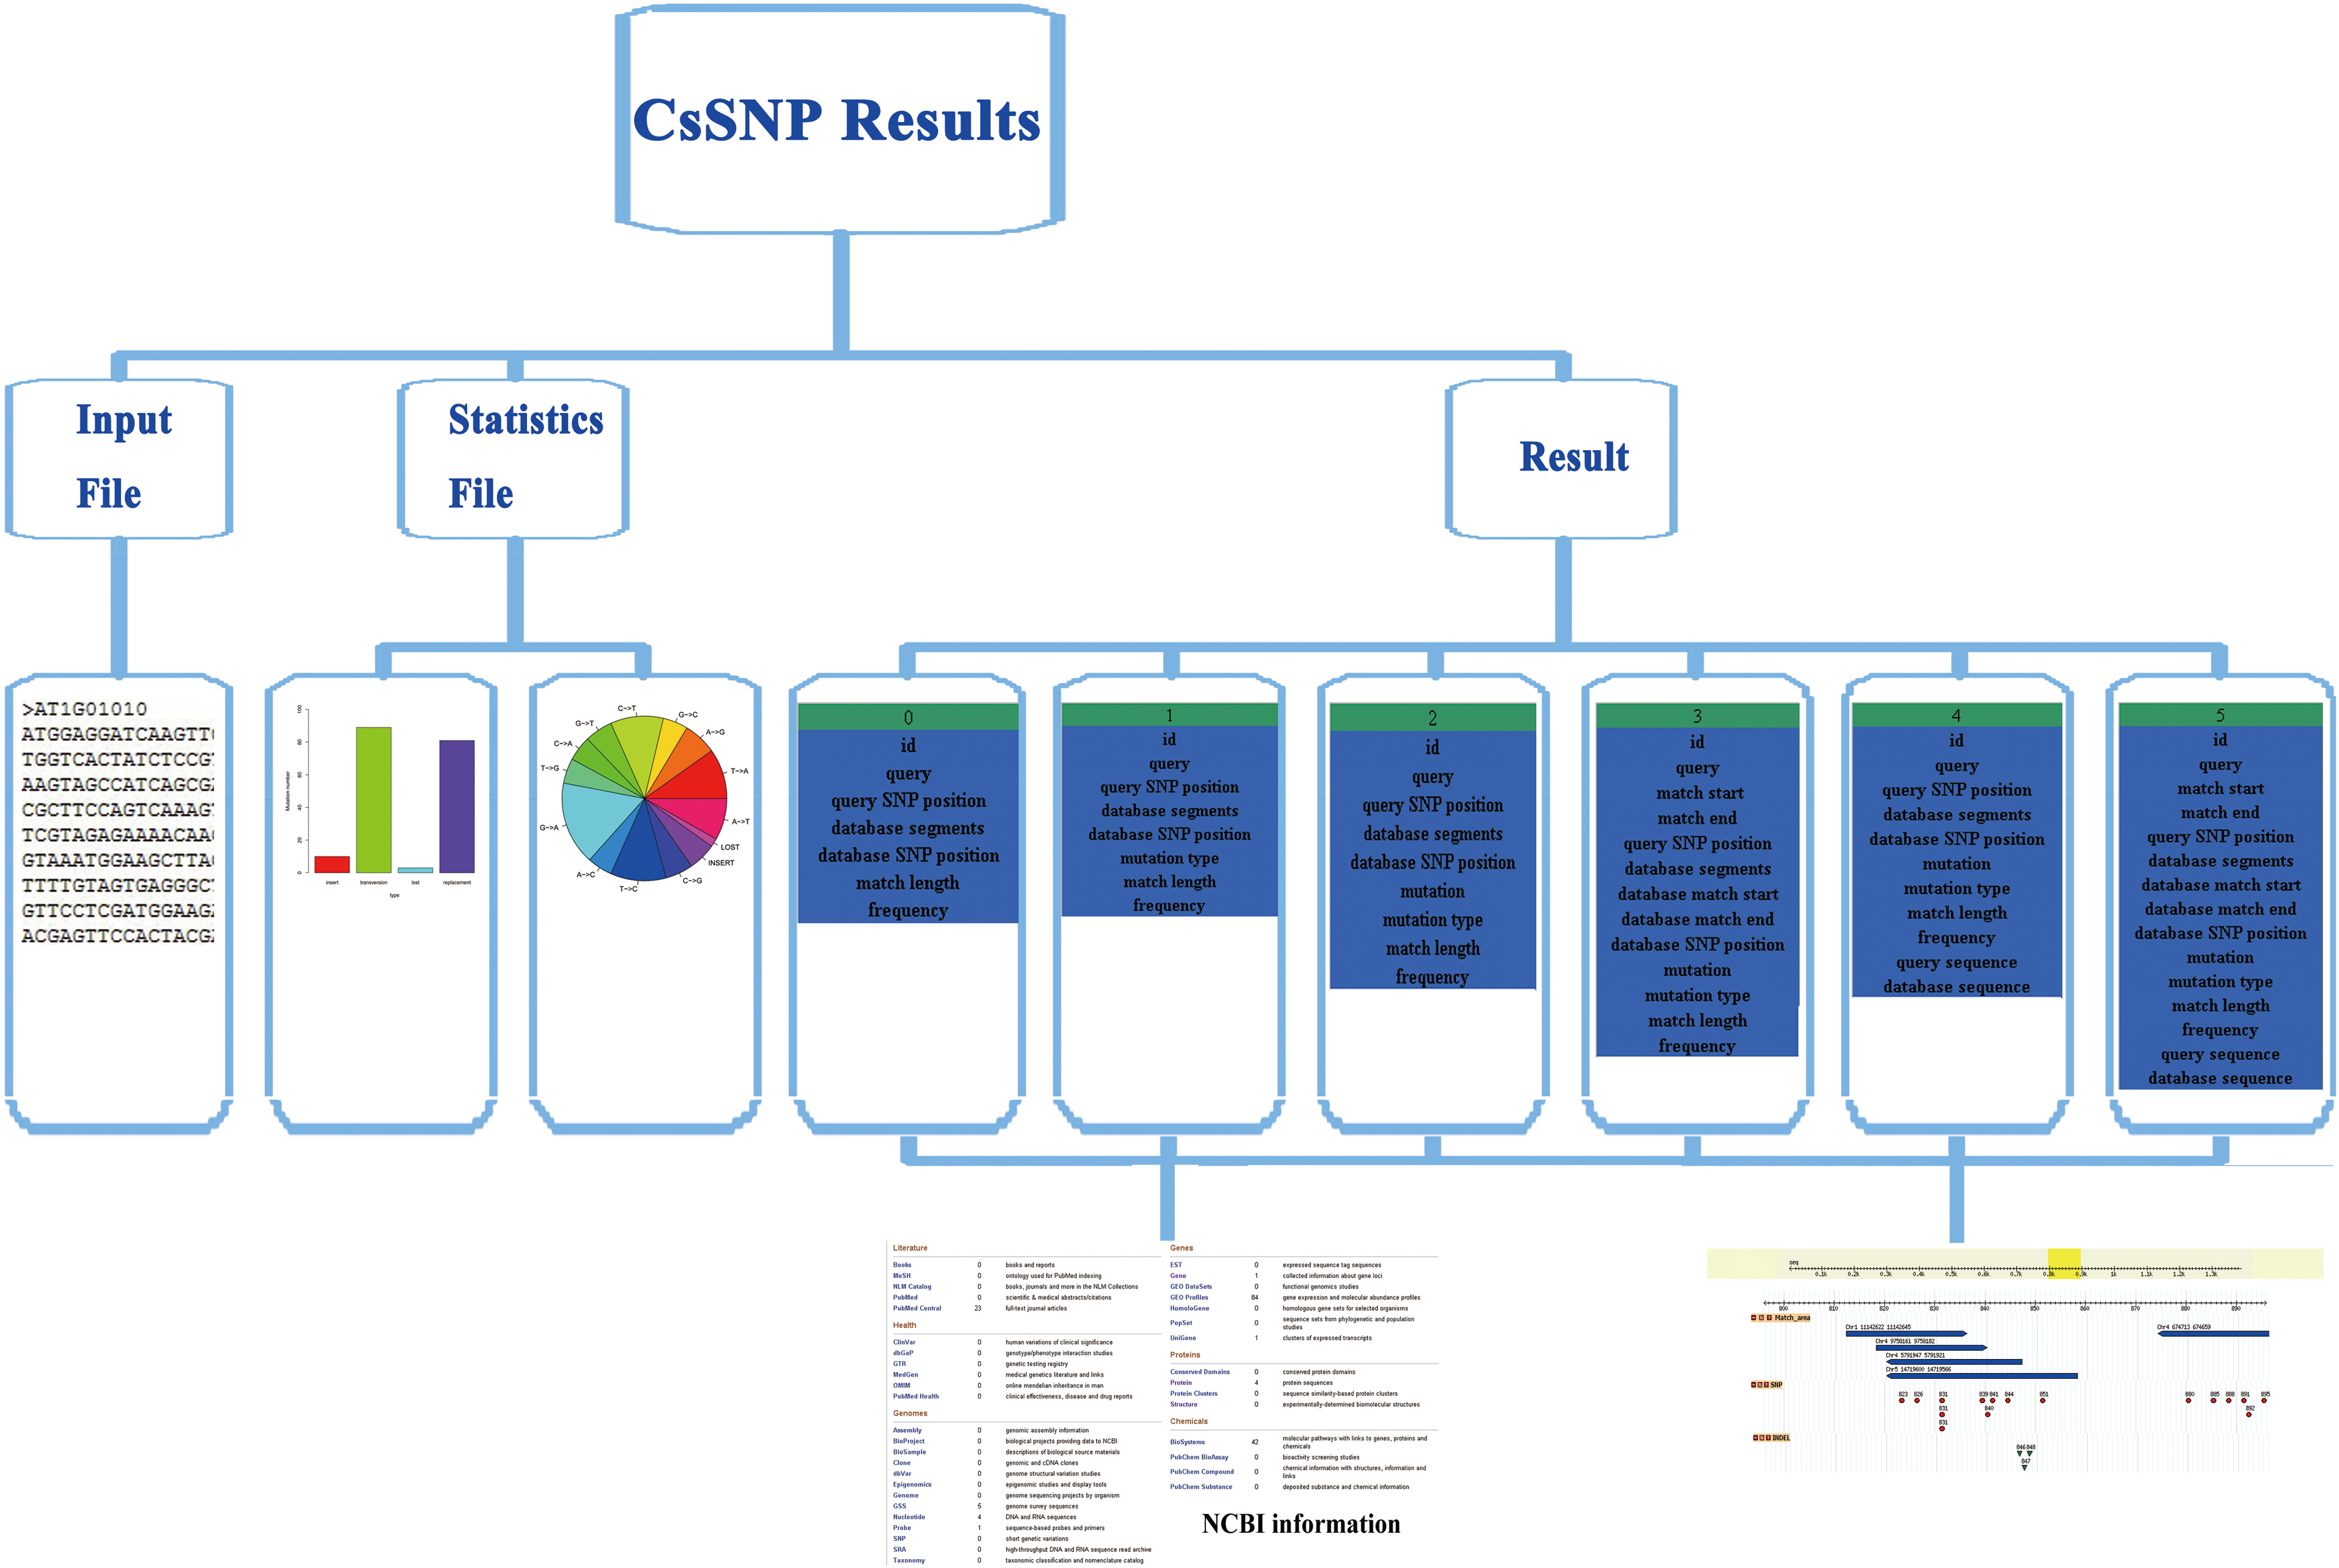
The output formats in different types of detailed information of CsSNP.
2.6. Verification in silico
The two methods have been used to detect the variations between the CDS sequences of melon and watermelon (Table 1). The results show that Blast gets more alignments and more variations, the alignment number of Blast is nearly 8 times more than the Blat, and the alignment length is about 46 times, but the variation times are less than 3 times. This because that Blast can put up with more mismatches and gaps in the alignment, so the aligned sequence is more and longer. But the higher tolerance means that most variation is out of the selected conditions, and the detected variations are smaller. Therefore, Blast can detect more variations but the alignment quality is not as high as the Blat.
Footnotes
Acknowledgment
This work was supported by National Natural Science Foundation of China (Grant No.31201231), Foundation of Big Data of Shandong Agricultural University. The authors thank Dr. Jiajie Wu from the College of Agronomic Science, Shandong Agricultural University, for helpful suggestions on the manuscript.
Author Disclosure Statement
The authors declare that there are no conflicting financial interests.
References
Supplementary Material
Please find the following supplemental material available below.
For Open Access articles published under a Creative Commons License, all supplemental material carries the same license as the article it is associated with.
For non-Open Access articles published, all supplemental material carries a non-exclusive license, and permission requests for re-use of supplemental material or any part of supplemental material shall be sent directly to the copyright owner as specified in the copyright notice associated with the article.