
Abstract
Abstract
The ligand-binding of membrane receptors on cell surfaces initiates the dynamic process of cross-membrane signal transduction. It is an indispensable part of the signaling network for cells to communicate with external environments. Recent experiments revealed that molecular components in signal transduction are not randomly mixed, but spatially organized into distinctive patterns. These patterns, such as receptor clustering and ligand oligomerization, lead to very different gene expression profiles. However, little is understood about the molecular mechanisms and functional impacts of this spatial–temporal regulation in cross-membrane signal transduction. In order to tackle this problem, we developed a hybrid computational method that decomposes a model of signaling network into two simulation modules. The physical process of binding between receptors and ligands on cell surfaces are simulated by a diffusion-reaction algorithm, while the downstream biochemical reactions are modeled by stochastic simulation of Gillespie algorithm. These two processes are coupled together by a synchronization framework. Using this method, we tested the dynamics of a simple signaling network in which the ligand binding of cell surface receptors triggers the phosphorylation of protein kinases, and in turn regulates the expression of target genes. We found that spatial aggregation of membrane receptors at cellular interfaces is able to either amplify or inhibit downstream signaling outputs, depending on the details of clustering mechanism. Moreover, by providing higher binding avidity, the co-localization of ligands into multi-valence complex modulates signaling in very different ways that are closely related to the binding affinity between ligand and receptor. We also found that the temporal oscillation of the signaling pathway that is derived from genetic feedback loops can be modified by the spatial clustering of membrane receptors. In summary, our method demonstrates the functional importance of spatial organization in cross-membrane signal transduction. The method can be applied to any specific signaling pathway in cells.
1. Introduction
C
Signal transduction is not a stochastic process (Housden and Perrimon, 2014). Recent in vivo experiments show that its molecular components are spatial-temporally organized into distinctive patterns (Cebecauer et al., 2010; Hartman and Groves, 2011; Radhakrishnan et al., 2010a). These patterns were observed in each step of signal transduction. Extracellular ligands can be oligomerized into multivalent complexes. For instance, it is the ubiquitous characteristics of immune recognition that antibodies bind to antigens on the surfaces of bacterial with their multiple binding sites (Boyce and Holdsworth, 1989; Dower et al., 1981; Engelhardt et al., 1991). Furthermore, membrane receptors tend to associate into different sizes of clusters on cell surfaces. For an example, T cell activation is directly mediated by the immunological synapse formed at the interface between T cells and antigen-presenting cells (Dustin 2009; Grakoui et al., 1999; Huppa and Davis 2003; Monks et al., 1998).
There are several functional roles of spatial organization that were proposed to regulate signal transduction (Wu, 2013). High-order organization of signaling molecules may provide transient spatial compartmentalization, within which the biochemical processes are greatly facilitated by proximity. This spatial regulation is of fundamental importance in signaling transduction. Additionally, cooperativity exists when multimeric spatial organization requires the formation of initial seed complex (Li et al., 2012). This intrinsic cooperation is significant to the functions of signal transduction. It leads to the fact that cells could exhibit an all-or-none transition only when there is a persistent and high dose of stimulation, which is called a threshold response (Qian, 2012). Furthermore, the signals from receptor activation must be amplified before they reach cell nucleus. The formation of high-order molecular platform can avoid multiple rounds of signal amplification by incorporating an over-stoichiometric number of signaling molecules into the complexes. Finally, stochasticity is an unneglectable factor in many cellular activities. The biological noises due to conformational fluctuations of macromolecules or randomness in molecular diffusions can be reduced through the spatial formation of high-order molecular patterns.
Unfortunately, little is understood about how proteins are spatially organized during the cross-membrane signal transduction, and what the functional impacts are on their downstream signaling pathways (Radhakrishnan et al., 2010b). First of all, the formation of high-order molecular platforms is difficult to observe during the dynamic processes of signal transduction in living cells (Kholodenko, 2006). Although the rapid development of new imaging techniques has facilitated detailed analysis of the molecular composition in the region peripheral to cell surfaces and the dynamics of the components involved, the spatial and temporal resolutions of these techniques are still insufficient to trace the binding details (Campi et al., 2005; Dean et al., 2003; Dustin, 2009; Grakoui et al., 1999; Hong et al., 2010; 2011; Huppa and Davis, 2003; Kanchanawong et al., 2010; Monks et al., 1998; Saito and Yokosuka, 2006; Salaita et al., 2010; Yokosuka and Saito 2010; Yokosuka et al., 2005). Moreover, the outcomes of signal transduction can be affected by many different factors, such as transcriptional regulation, epigenetic modification, and crosstalk with other signaling pathways, some of which are even unknown. It is difficult to distinguish the effect of spatial organization alone from others.
Relative to the current experimental limitations, computational modeling and theoretical analysis possess unique advantages that can permit one to test conditions that may currently be difficult to attain or even unapproachable in the laboratory. For instance, mathematical models have been used to describe the dynamics of various cell signaling networks by sets of ordinary differential equations (ODE) (Chen et al., 2014; Lee et al., 2003). However, it is difficult to integrate spatial information and randomness into these models, which represent cells as a well-mixed, homogenous, and deterministic system. On the other hand, a variety of spatial modeling approaches either extended the network models of reaction processes into experimentally determined cell geometries (Ander et al., 2004; Andrews and Bray, 2004; Francke et al., 2003; Frazier and Alber, 2012; Hattne et al., 2005; Ridgway et al., 2008; Rodriguez et al., 2006; Slepchenko et al., 2002; 2003; Stiles and Bartol, 2001), or based on particle-based simulation techniques, such as MCell (Stiles and Bartol, 2001) and Smoldyn (Andrews and Bray, 2004), providing a more realistic treatment of cellular environments with a stochastic background. These methods are currently applied to study the subcellular activities at specific locations of cells. They are computationally intractable to study the entire processes of cell signaling pathways, which involve numerous molecular components.
It is challenging to develop computational methods that are able to contain subcellular details in the context of large signaling networks. As a result, multiscale models become a powerful tool to deal with these multi-level complexities (Costa et al., 2009). Functions of spatial organization in cell signaling have been computationally studied in EGF (Mayawala et al., 2005) and calcium (Ullah et al., 2014; Zeller et al., 2009) signaling pathways. However, the general principles of spatial organization, for instance, the dimensionality of signaling molecules in their cellular environments, the oligomerization of extracellular ligands, the clustering of membrane receptors on cell surface, and how these spatial organizations further affect intracellular signaling events are not understood.
In this article, we introduce a hybrid simulation method to account for the spatial regulation in cross-membrane signal transduction. The method was applied to a simple testing system in which the ligand binding of cell surface receptors triggers the phosphorylation of protein kinases, and in turn regulates the expression of target genes. The spatial interactions between receptors and their ligands were simulated by a rigid-body (RB) model, while the downstream signaling pathway was modeled by the stochastic simulation of chemical reactions. Two levels of simulations were integrated together by a newly designed computational framework. Using this method, we found that the interactions between receptors and ligands in different spatial environments can lead to very different profiles of genetic expression, given the same binding parameters. For instance, the co-localization of ligands into multi-valence complex modulates signaling by providing higher binding avidity. Moreover, spatial aggregation of cell surface receptors is able to regulate signaling either positively or negatively, depending on the clustering mechanisms. Finally, the genetic feedback loop was added into the network, so that the expression of receptors on cell surfaces can be modified by its own. We show that the kinetic oscillation of the signaling network is closely regulated by spatial patterns of receptors. In summary, our method demonstrates the functional importance of spatial organization in cross-membrane signal transduction. The method can be applied to any specific signaling pathway in cells.
2. Methods
2.1. Description of the model system and the general framework of the simulation method
The hybrid simulation was tested on a simple model system that incorporates the most basic features in cell signaling pathways. The schematic representation of this simplified pathway is shown in Figure 1. Specifically, a cell surface receptor (R) binds to its target ligand (L) and form a complex (C). The complex formation in the extracellular region activates the receptor as a kinase, which in turn catalyzes the phosphorylation of a transcriptional factor from an un-phosphorylated form (T) to a phosphorylated form (TP). On the other hand, TP can be dephosphorylated into T by a certain phosphatase that is not explicitly modeled in the system. The phosphorylated transcriptional factor further triggers the expression of target protein molecules (G). Finally, a genetic feedback loop was also added into the pathway in which the target protein G negatively regulates the expression of receptors on cell surfaces. Quantitatively, the change of concentration for each type of molecular components in the system can be described by following ordinary differential equations (ODE).
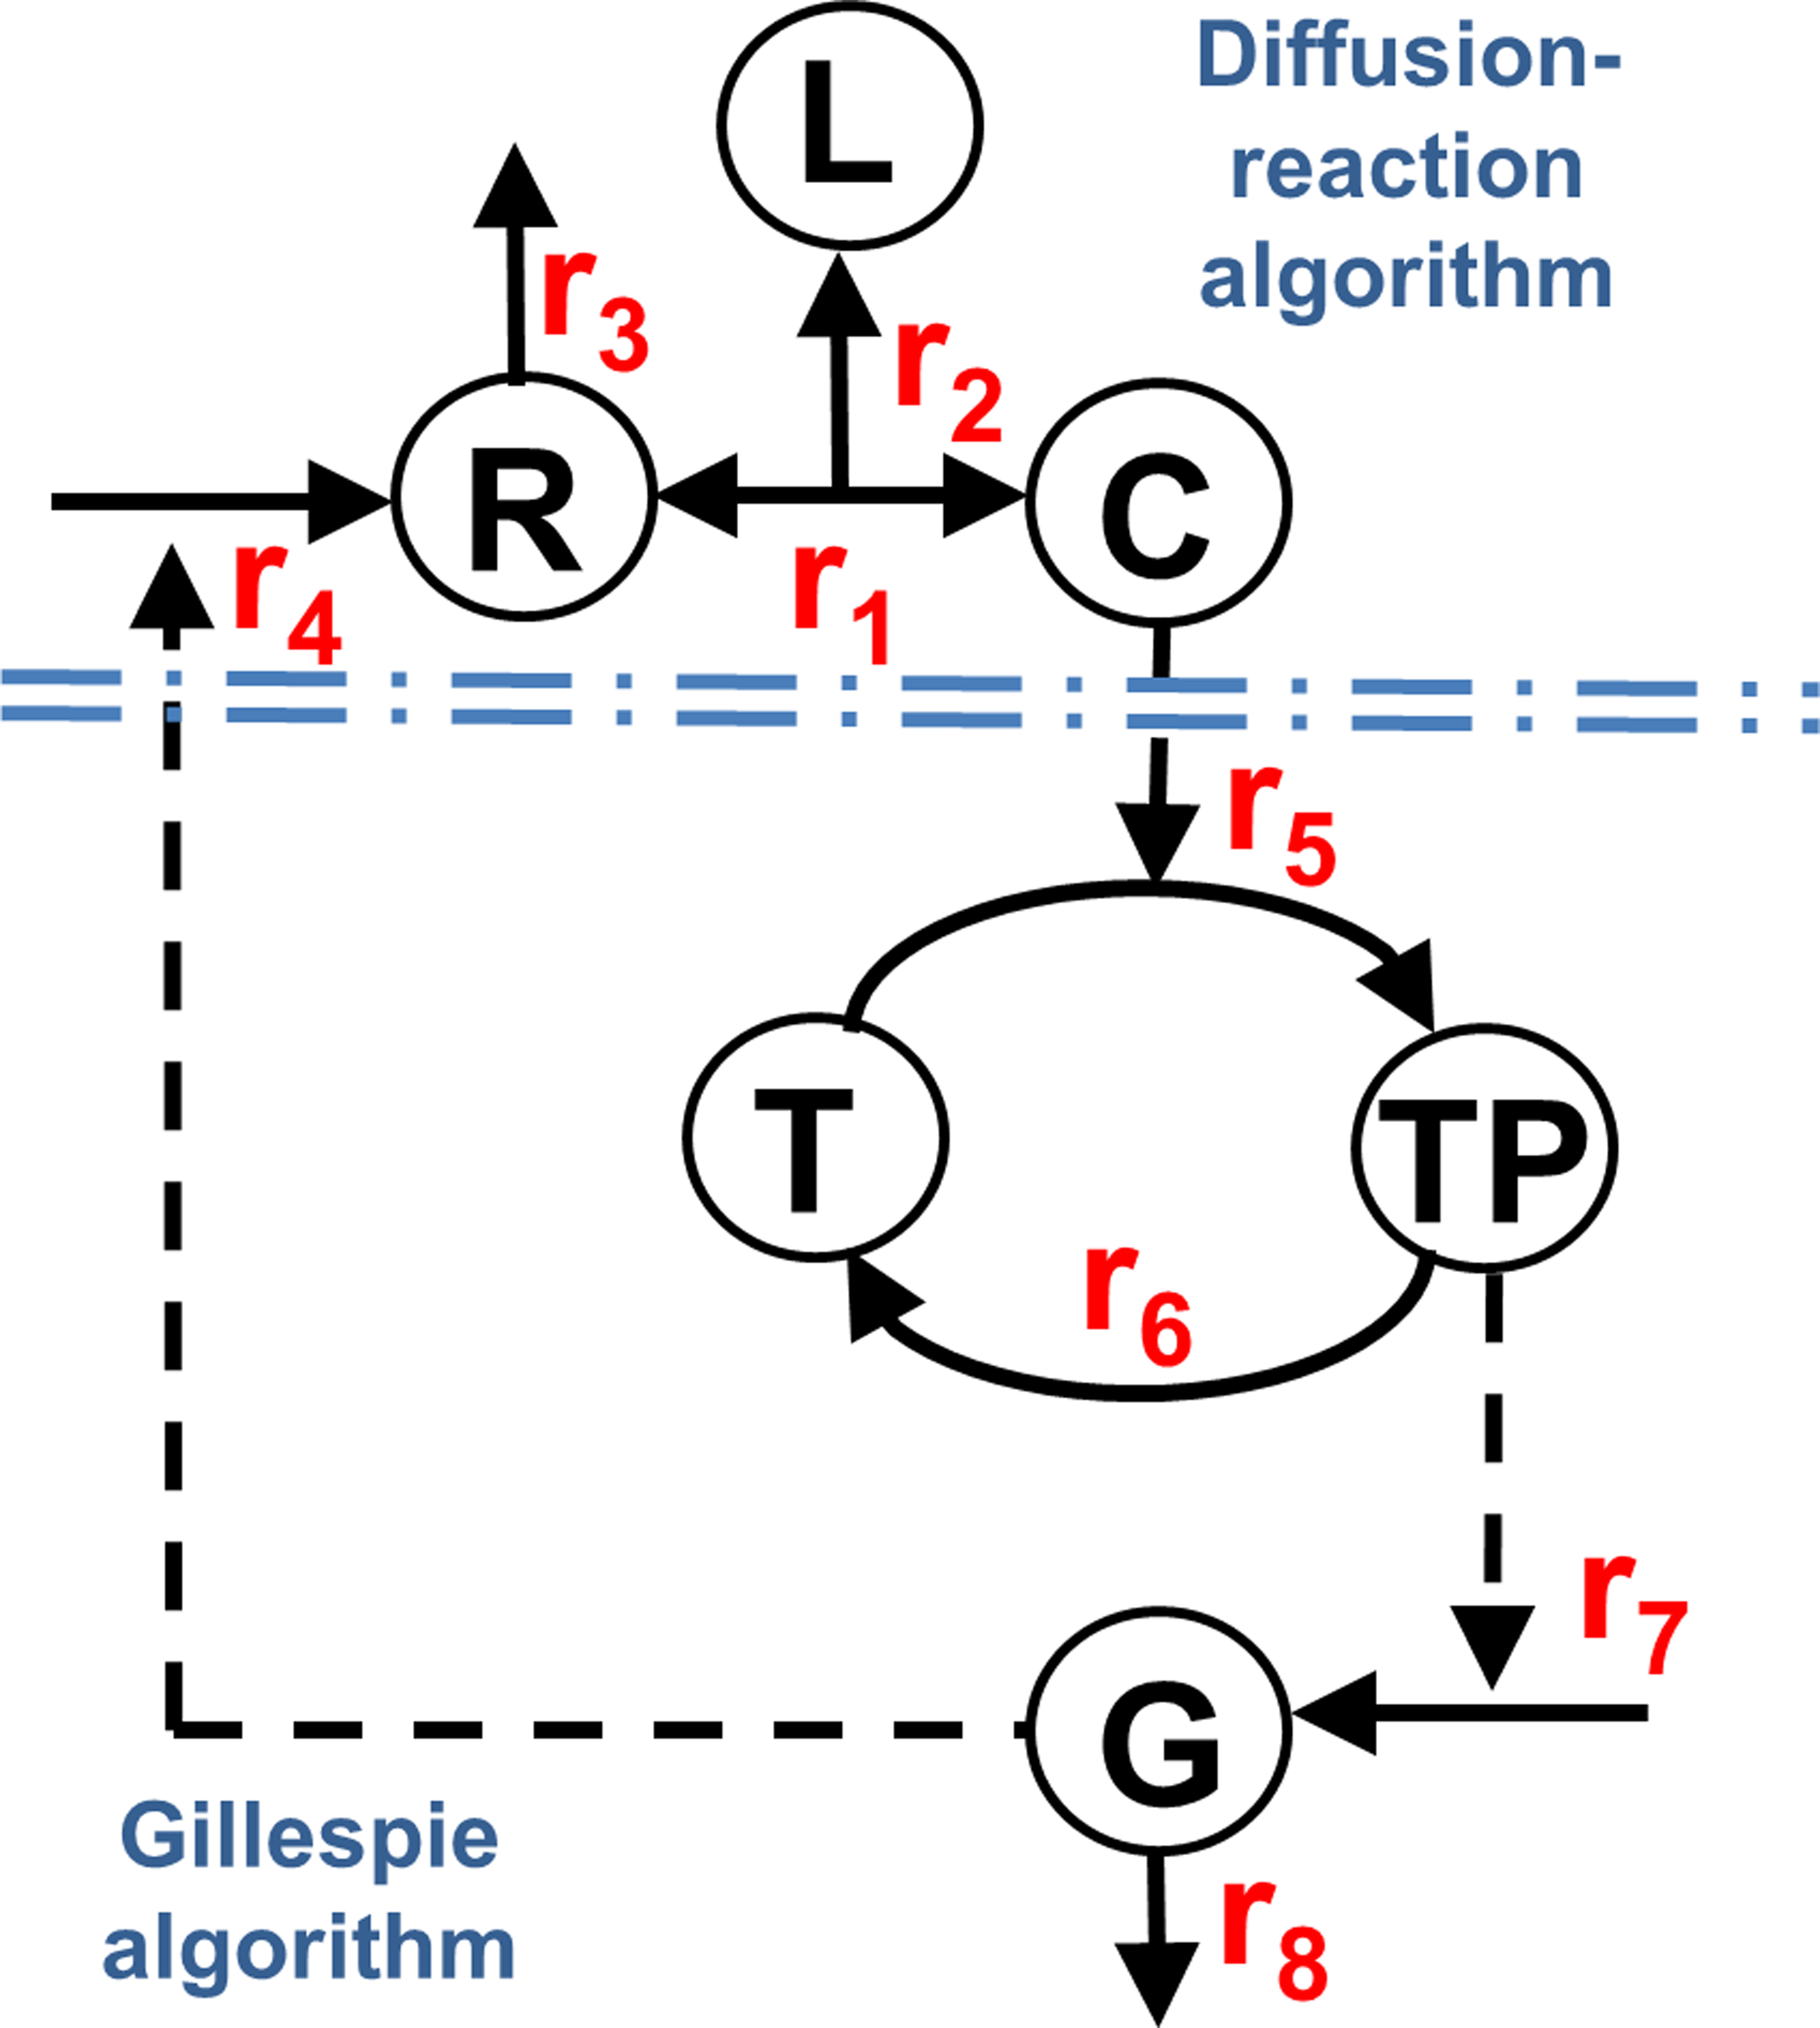
The schematic representation of a simplified signaling pathway that was tested by the hybrid simulation method. In the pathway, a cell surface receptor (R) binds to its target ligand (L) and forms a complex (C). The complex formation in the extracellular region activates the receptor as a kinase, which in turn catalyzes the phosphorylation of a transcriptional factor from un-phosphorylated form (T) to phosphorylated form (TP). TP can be dephosphorylated into T by a certain phosphatase that is not explicitly modeled in the system. The phosphorylated transcriptional factor further triggers the expression of target protein molecules (G). Finally, a genetic feedback loop was also added into the pathway in which the target protein G negatively regulates the expression of receptors on cell surfaces. Binding between receptors and ligands is simulated by a diffusion-reaction algorithm, while the downstream biochemical reactions are modeled by stochastic simulation of Gillespie algorithm.
The parameter ri in above equations corresponds to the rate of the ith biochemical reaction in the pathway. These rates are specified as follows. Reactions 1 and 2 represent the association and dissociation between a receptor and its ligand. The spatial process of these reactions was simulated by a previously developed RB-based diffusion-reaction method. The detailed algorithm of this method will be described in the next section. In comparison, the cytoplasmic reactions from 3 to 8 were modeled with the stochastic simulation algorithm of Gillespie by assuming that the cytosol is a well-mixed environment. In detail, reaction 3 and 8 correspond to the degradation of the receptor R and target protein G, which are modeled as r3(t) = dR and r7 (t) = dG. The phosphorylation rate of the transcriptional factor r6 depends on the concentration of the activated receptor:
where pc is the maximal rate of catalysis, and Kc is a constant saturation coefficient as described by Michaelis-Menten kinetics. In contrast, the de-phosphorylation reaction 5 is modeled as r5 (t) = kd [TP(t)], in which kd is the rate of de-phosphorylation. In reaction 8, we assume that the expression rate of target proteins depends on the concentration of activated transcriptional factors and reaches a maximum value sG. We further neglect the delay between the binding of transcriptional factor and the expression of the target gene. Consequently, reaction 8 can be written as:
Finally, reaction 4 describes the negative regulation of receptor expression by the target protein. It has the following form:
In equation (9), the parameter sR is the intrinsic rate of synthesis for receptors, while KR is the saturation coefficient of the negative regulation. The brief introduction of the Gillespie algorithm and the detailed framework that integrates spatial with nonspatial simulations will be specified in the third part of the Methods section. It is worth emphasizing that the update of molecular populations from one simulation will be loaded into the other simulation. For instance, the newly generated complexes from the diffusion-reaction simulation will be updated in the Gillespie simulation. On the contrary, the updated new concentration of target proteins from Gillespie simulation will be used to control the synthesis of new receptors in diffusion-reaction simulation (Fig. 2).
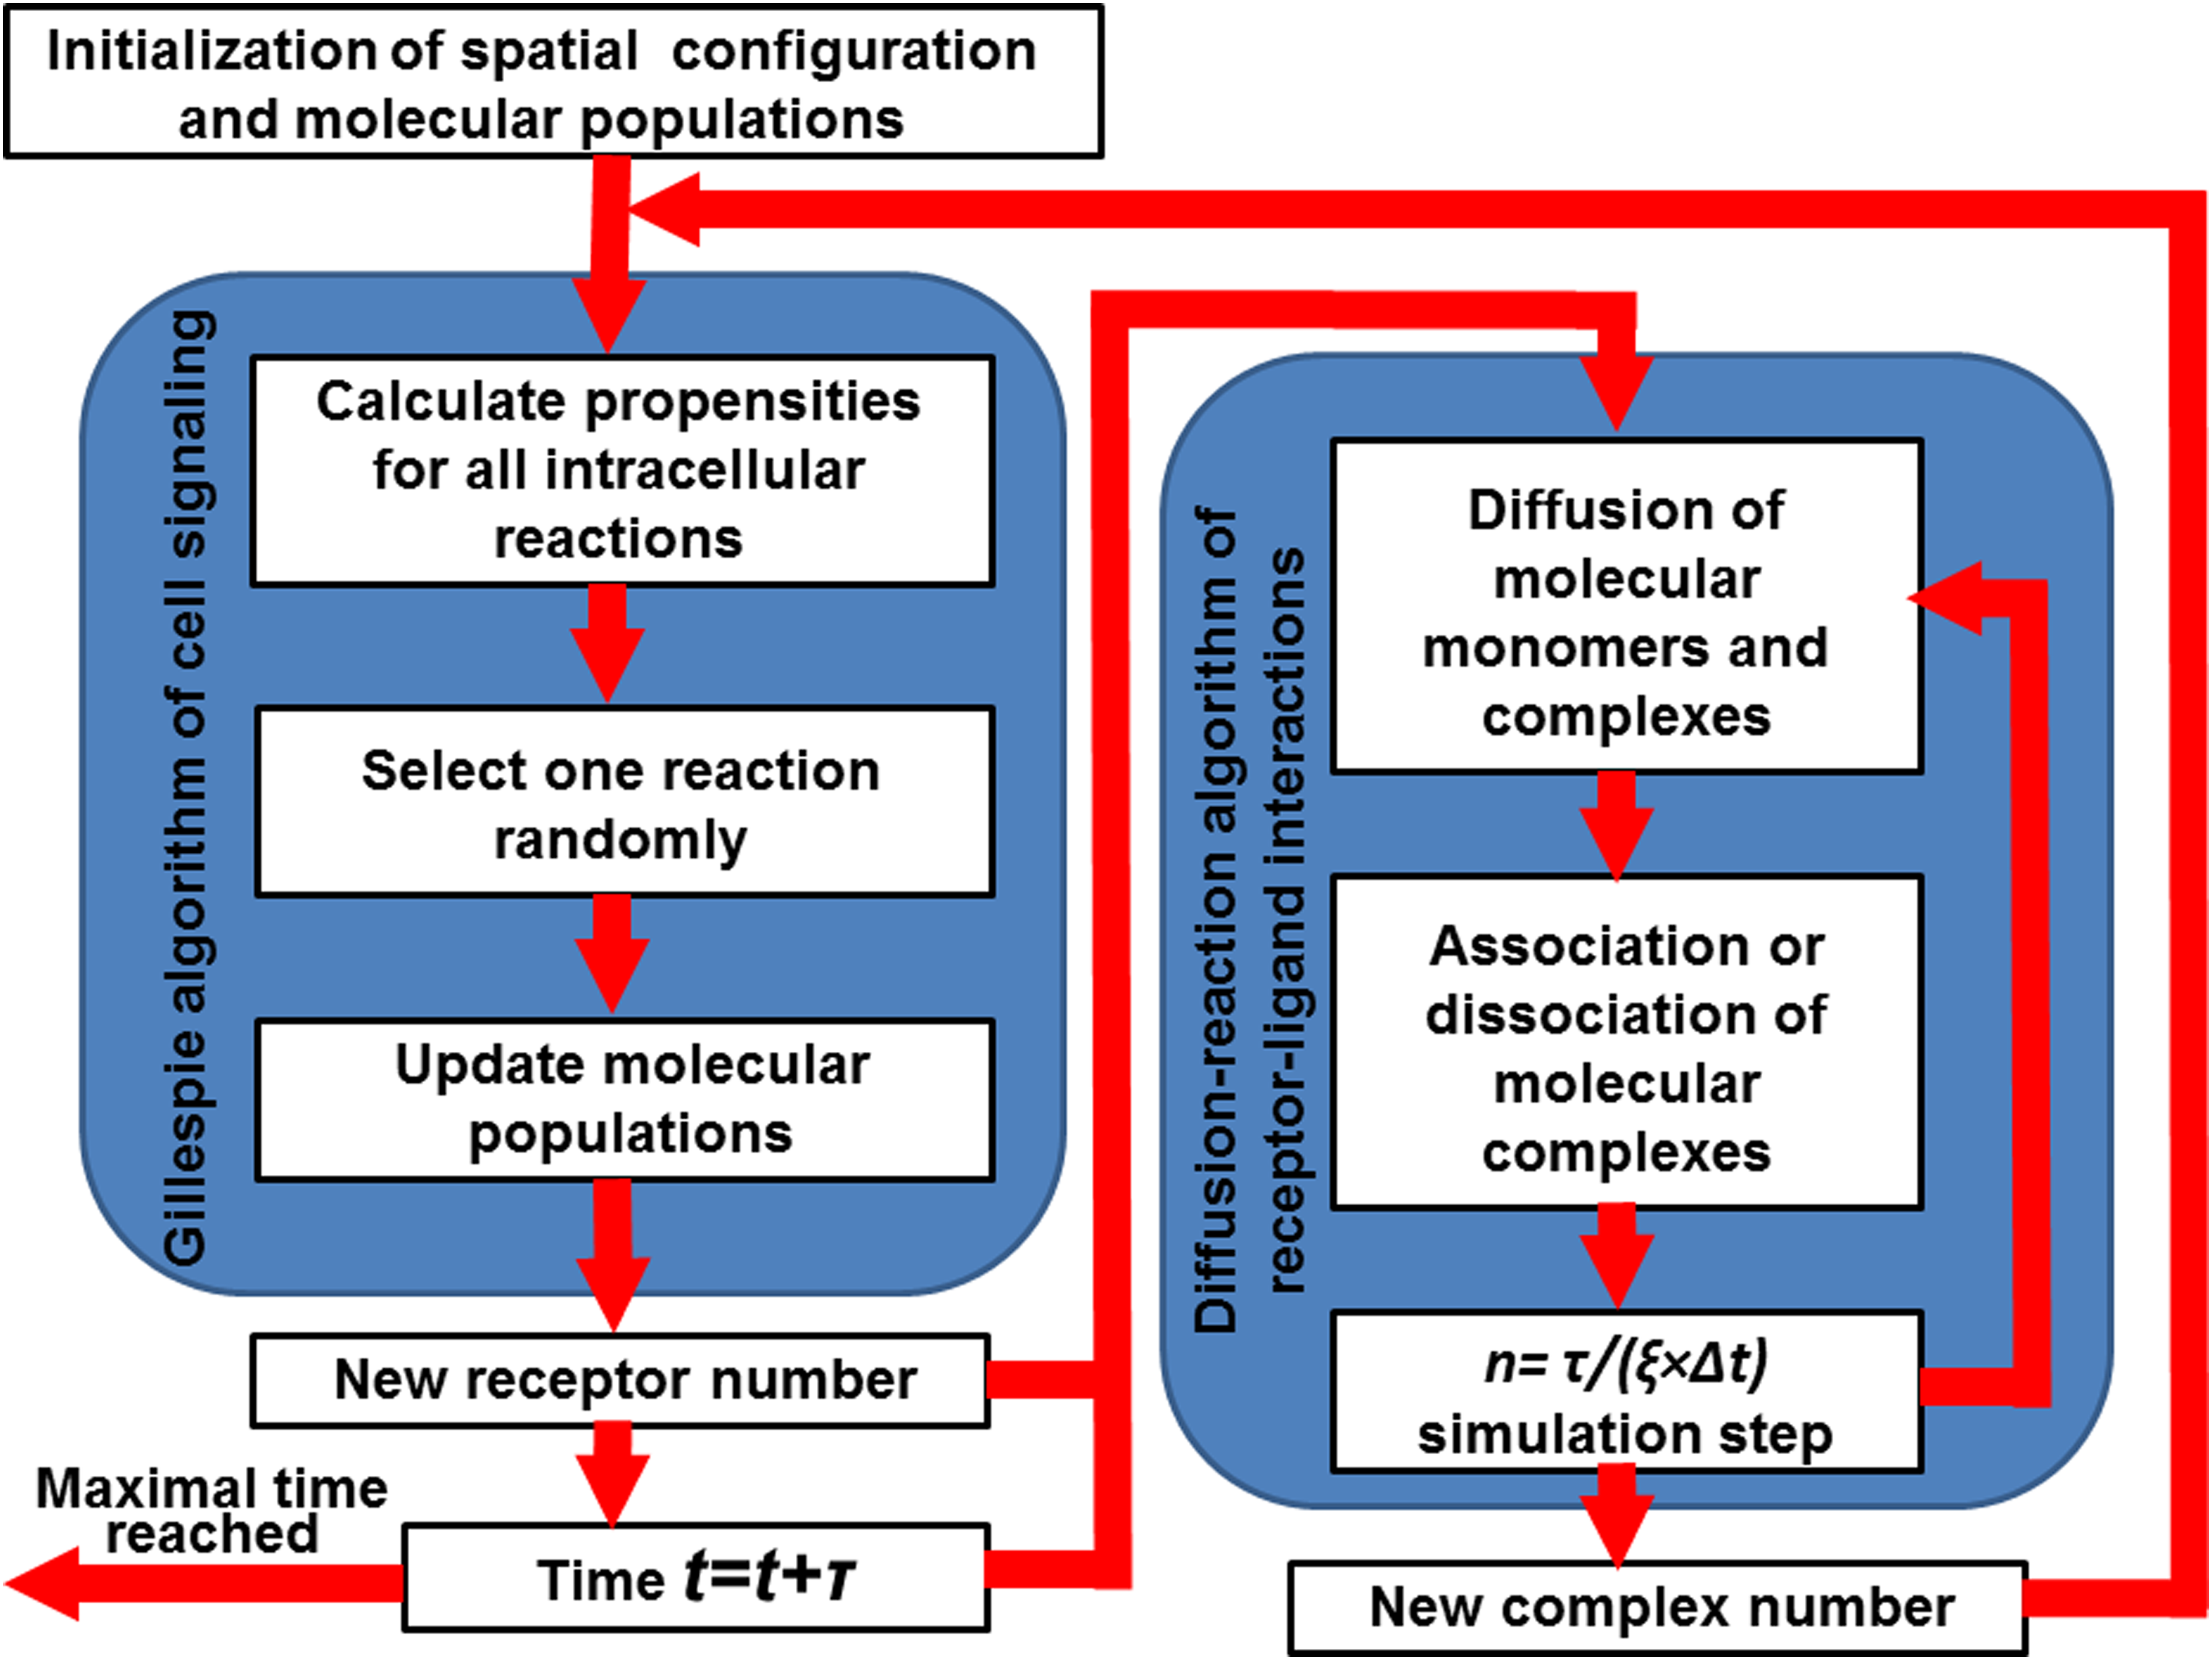
The overall flowchart of the hybrid computational method that constitutes a diffusion-reaction and a Gillespie simulation module. The simulation starts from an initial setup of a spatial configuration for receptors and ligands, as well as the populations for all other molecular species. After initiation, one step of Gillespie simulation is carried out by choosing one of the intracellular reactions and updating the corresponding molecular populations. After the Gillespie simulation, the system time is updated and multiple steps of the RB-based diffusion reaction simulation are carried out to generate a new spatial configuration. The above process is iterated in both Cartesian and constitutional spaces until the maximal time is reached.
2.2. Spatial simulation of receptor–ligand interactions by a diffusion-reaction algorithm
We have previously developed a simplified model to simulate the kinetic and thermodynamic properties of molecular interactions in different cellular environments. In this model, each molecule is simplified as a rigid body with given size. To delineate the binding interface between different molecules, one or multiple functional sites are placed on the surface of each rigid body. Binding occurs when the corresponding functional sites of two rigid bodies are closer than a predefined distance cutoff, and when the two functional sites are oriented properly. This RB-based model was applied to study the binding between cell surface receptors and their ligands. Specifically, simulations are started from an initial configuration, in which a number of receptors are randomly distributed on a two-dimensional cell surface, while ligands are randomly placed either in the three-dimensional extracellular space or on two opposite sides of cell surfaces.
Following the initial configuration, the system evolves according to a diffusion-reaction algorithm (Xie et al., 2014). Each time step in this algorithm consists of two scenarios. In the first scenario, molecules are chosen to undergo random diffusions. The acceptance rate of diffusion movements for each molecule is determined by its diffusion coefficients. If a ligand is in the extracellular region, it can freely move with three translational and three rotational degrees of freedom. Otherwise, for a receptor, a ligand or a ligand-bound receptor complex that is confined on cell surfaces, rotations are restricted along the axis that is normal to the membrane, while translational movements are only allowed in the cell surface. The 2D periodic boundary condition is applied for cell surface molecules. For ligands in the 3D extracellular region, periodic boundary condition is used along X and Y directions. In Z direction, ligands are not allowed to move below the cell membrane on the bottom. Additionally, any ligand moving beyond the top of the simulation box will be bounced back.
The second scenario simulates the reaction kinetics of the system. Association is triggered if both distance and orientation criteria between any receptor and ligand are satisfied. The probability to trigger the association is determined by the association rate. In contrast, dissociation between a ligand–receptor pair occurs with a probability that is calculated by association rate and binding affinity. After a ligand binds to a receptor, the ligand–receptor pair moves together on cell surface. After both scenarios are sequentially performed in the corresponding time step, the new configuration is updated. Finally, as the above process is iterated, the kinetics of the system evolves in both Cartesian and compositional spaces. The above algorithm has been further extended to incorporate specific spatial patterns. In order to study receptor clustering at the cellular interface, multiple binding sites are generated for each receptor and ligand. On top of each molecule is the binding site that leads to trans-interactions between a receptor and a ligand, while the cis-binding sites are on the side of each receptor or ligand. Moreover, in order to test the effect of multivalent avidity on receptor binding, two ligand molecules are oligomerized into a homodimer. As a result, a ligand dimer diffuses as an entity in the extracellular region. Two subunits in a dimer are allowed to undergo small translational and rotational fluctuations around their centered positions and orientations to capture the conformational flexibility. If one ligand subunit associates with a receptor, the whole dimer will diffuse together with the receptor, so that the other unbound ligand in the dimer can be accessible by other receptors. Detailed setup of these simulations will be described in the results.
Finally, the processes of receptor synthesis and degradation are considered. If a new receptor is synthesized, it will be generated and randomly placed on the cell surface without clashing with other current receptors. In contrast, degradation occurs when one of the current receptor monomers are randomly chosen and removed from the cell surface. The probabilities of receptor synthesis and degradation are given by the equations of reaction 3 and 4. The implementation of these events will be specified in the next section.
2.3. Stochastic simulation of intracellular signaling and its coupling with the spatial model
In order to attain computational efficiency and avoid the complication of modeling cell cytosol, we use the nonspatial stochastic simulation algorithm developed by Gillespie to model the processes of biochemical reactions from r3 to r8 (Gillespie, 2007). The algorithm starts from the initiation of time and populations of each molecular species in the system. Within each simulation step, the rates for all reactions are then calculated by the equations provided in the first part of the method. One of these reactions is randomly selected from all based on the calculated rates. Finally, populations for all species are updated. The simulation moves forward to the next step by adding the system time with τ.
The stochastic simulation of Gillespie algorithm has been coupled with the diffusion-reaction model to combine the receptor–ligand interactions on cell surfaces with the intracellular signaling processes. The overall flowchart of the coupled simulation is shown in Figure 2. The initiation includes setup of the spatial configuration for receptors and ligands, as well as the populations for all other molecular species. After initiation, one step of Gillespie simulation is carried out by choosing one of the intracellular reactions and updating the corresponding molecular populations. Following the Gillespie simulation, the system time is updated with τ. After the determination of new simulation time, n steps of the RB-based diffusion reaction simulation are carried out to generate a new spatial configuration and check the new events of association and dissociation between receptors and ligands. A specific parameter ξ is used to synchronize the time scale between intracellular signaling and spatial processes on cell surfaces so that each time the number of RB-based simulation steps can be calculated as n = τ/(ξ×Δt).
Several issues in the coupled simulation need to be highlighted about the interface between the diffusion-reaction and the Gillespie algorithms. First, if reaction 4 is selected in the Gillespie simulation, one new receptor will be generated in the system. This operation will also be implemented in the following diffusion-reaction simulation by randomly placing a receptor on cell surface at a spatially available location, as mentioned in the previous section. Similarly, if reaction 3 is selected in the Gillespie simulation, one current receptor will be degraded. This operation will also be implemented in the following diffusion-reaction simulation by randomly removing a receptor monomer from cell surface. After the diffusion-reaction simulation, the number of newly formed complexes is updated. The new complex number enters the next step of the Gillespie simulation to guide the phosphorylation of transcriptional factor. Finally, it is worth mentioning that parameters were chosen to accelerate our simulations in relatively short time-scale. The values of these parameters are still within the biologically meaningful range, and the choice of these parameters does not affect the general dynamic patterns of the signaling system. It is more important to understand that systems with the exact same parameters can lead to very diverse signaling patterns only because of the difference in their spatial environments, as shown in the results. After testing the reliability on this simplified system, our method can be applied to specific signaling pathway in the future. More details will be specified in the discussions.
3. Results
3.1. Simulating the receptor–ligand interactions in different dimensionalities
Free proteins possess three translational and three rotational degrees of freedom when they diffuse in 3D cytoplasm. In contrast, a membrane-anchored receptor only has two translational degrees of freedom and experiences the constraints on its rotational degrees of freedom (Dustin et al., 2001; Hu et al., 2013). When receptors interact with their ligands that move either in the 3D extracellular region or on the surface of neighboring cells, the confinement of membranes makes the binding only occur at the inter face between two cells or between a 3D solvent and a 2D surface. Therefore, changes of system dimensionality alter the diffusions of proteins and further affect their binding (Wu et al., 2011; 2013).
We first investigated how molecular binding is influenced in these different environments, and what are their impacts on downstream signaling profiles. Specifically, three sets of simulations were carried out. In the first scenario, called 3D2D (Fig. 3a), 100 receptors were placed on a 200 nm ×200 nm cell surface, while 100 ligands were distributed in a 3D extracellular space above the cell surface with 100 nm in height. In the second scenario, called 2D2D (Fig. 3b), 100 receptors were placed on the same surface, but the 100 ligands were distributed on a surface from the opposite side with the same size. In the third scenario, called 3D3D (Fig. 3c), the same number of 100 receptors and ligand were randomly mixed in a 200 nm ×200 nm ×1000 nm cubic box. All other parameters kept unchanged in all three scenarios. The binding affinity between receptors and ligands is −10kT.

Three scenarios were designed to test the receptor–ligand interactions in different dimensions. In the first scenario
A relatively large value for the kinetic rate of association, 1 ns−1, was used to accelerate simulations. The initial population of un-phosphorylated transcriptional factors is 100, while the initial number of receptor complexes, phosphorylated transcriptional factors, and target proteins are 0. The detailed values of all simulation parameters can be found in the Supplementary Tables (supplementary material is available online at www.liebertpub.com/crb). They were adopted within the range of previous experimental or computational studies. Additionally, in order to focus on the importance of spatial information in receptor–ligand interactions, we fixed the density of receptors on cell surfaces by turning off the receptor synthesis and degradation (r3 and r4). The simulation results of these three scenarios are plotted in Figure 3d and Figure 3e. First, Figure 3d shows how the number of receptor complexes changes along with simulation time in three scenarios. In the figure, we found that complex formation in the 3D2D scenario was slightly faster than the 3D3D scenario. In contrast, the receptors and ligands in the 2D2D environment formed complexes much faster than in the other two environments. Moreover, after the kinetics of receptor–ligand interactions reached equilibrium, there were more complexes in the 2D2D system than the other two, although the binding affinities between receptors and ligands were the same in all three scenarios. This is consistent with what we proposed earlier, the entropy loss due to the membrane confinement of cell surface proteins makes their interactions more stable and easier to achieve.
As a result, when both receptors and ligands were confined at cell interfaces, more target proteins were generated through the downstream signal transduction, as illustrated by the red curve in Figure 3e. On the other hand, the small difference of receptor binding kinetics between 3D2D and 3D3D systems was not reflected in the profiles of target proteins due to the stochasticity in the process of signal transduction. Taken together, our study suggests that dynamics of a signaling pathway cannot be manifested by only taking accounts of the interactions between its individual molecular components. The cellular environment of these molecular components plays an important role to affect their interactions, and thus regulate the downstream signaling profiles. More specific studies about the importance of spatial information in cell signaling will be introduced in the following sections.
3.2. Evaluating the functional impacts of receptor clustering on cell signaling
Recent developments of new imaging techniques show that clustering is a generic process for membrane receptors to carry out their functions in cell adhesion and communication. For instance, studies of cadherin homeostasis in the adherens junction indicated that kinetics of entrance of cadherin into junctions is catenin independent, but is regulated by the specific binding interfaces at cadherin's extracellular domains (Harrison et al., 2011; Hong et al., 2010). Clustering of neural cell adhesion molecules (NCAM) was found to promote the assembly and remodeling of post-synaptic signaling complex (Soroka et al., 2010; Westphal et al., 2010). However, current experimental approaches are still infeasible to trace the dynamic detail of each receptor during their clustering. In addition, it is even more difficult to quantify the effect of receptor clustering on downstream signaling. Fortunately, our model system is able to simulate the process of receptor clustering with or without ligand binding, and the signaling consequence of receptor clustering can be directly observed.
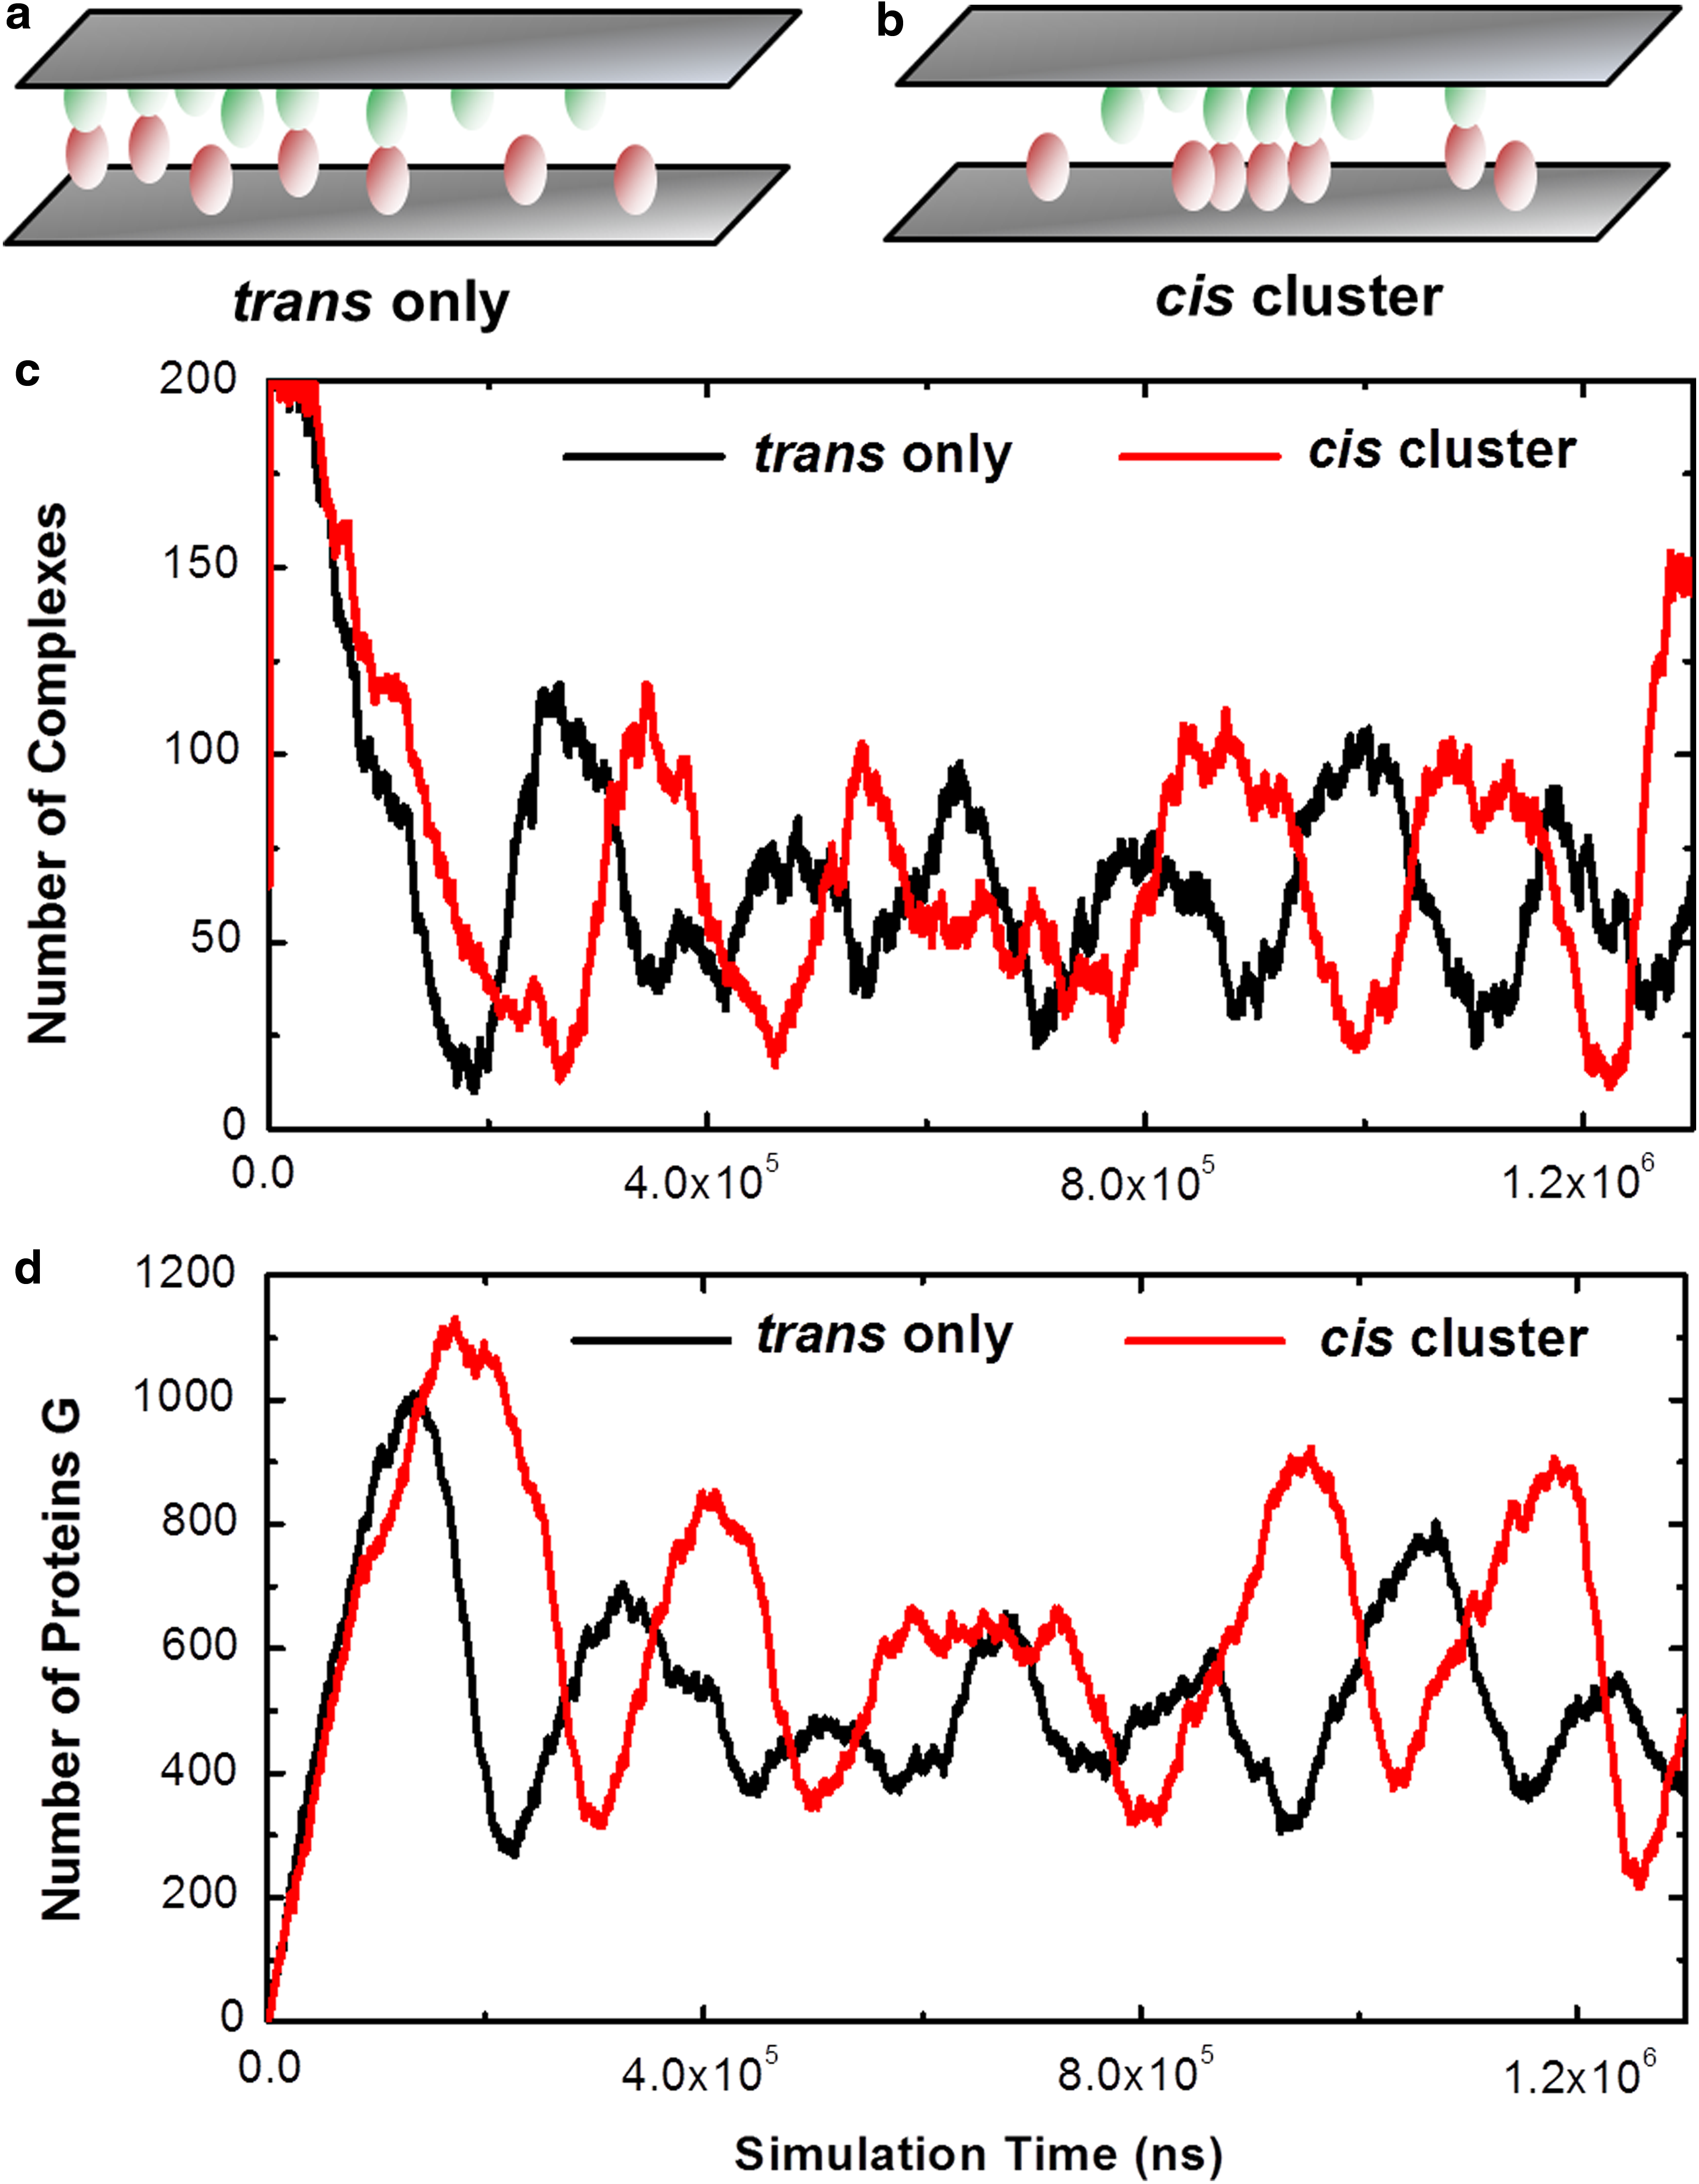
Specifically, three types of interactions in the system are defined between receptors and ligands: 1) a trans-dimer is used to describe an interaction between a receptor and its ligand from the opposite side of cell surface (Fig. 4a); 2) a cis(TT)-dimer (Fig. 4b) describes a lateral interaction between two trans-dimers; and 3) a cis(MM)-dimer (Fig. 4c) describes a lateral interaction between two receptor or ligand monomers. Correspondingly, three simulation scenarios were designed. In the first scenario, only trans-interactions were allowed between receptors and ligands. There were 100 receptors randomly diffusing on a 200 nm ×200 nm cell surface, while 100 ligands were distributed on a surface from the opposite side with the same size. In the second scenario, cis(TT)-interaction was turned on in addition to the trans-interaction. In the third scenario, cis(MM)-interaction, but not cis(TT)-interaction, was turned on. The values of all other parameters are fixed in all three scenarios, which can be found in the Supplementary tables. Finally, the density of receptors on cell surfaces was kept as a constant to exclusively investigate the function of receptor clustering in cell signaling.
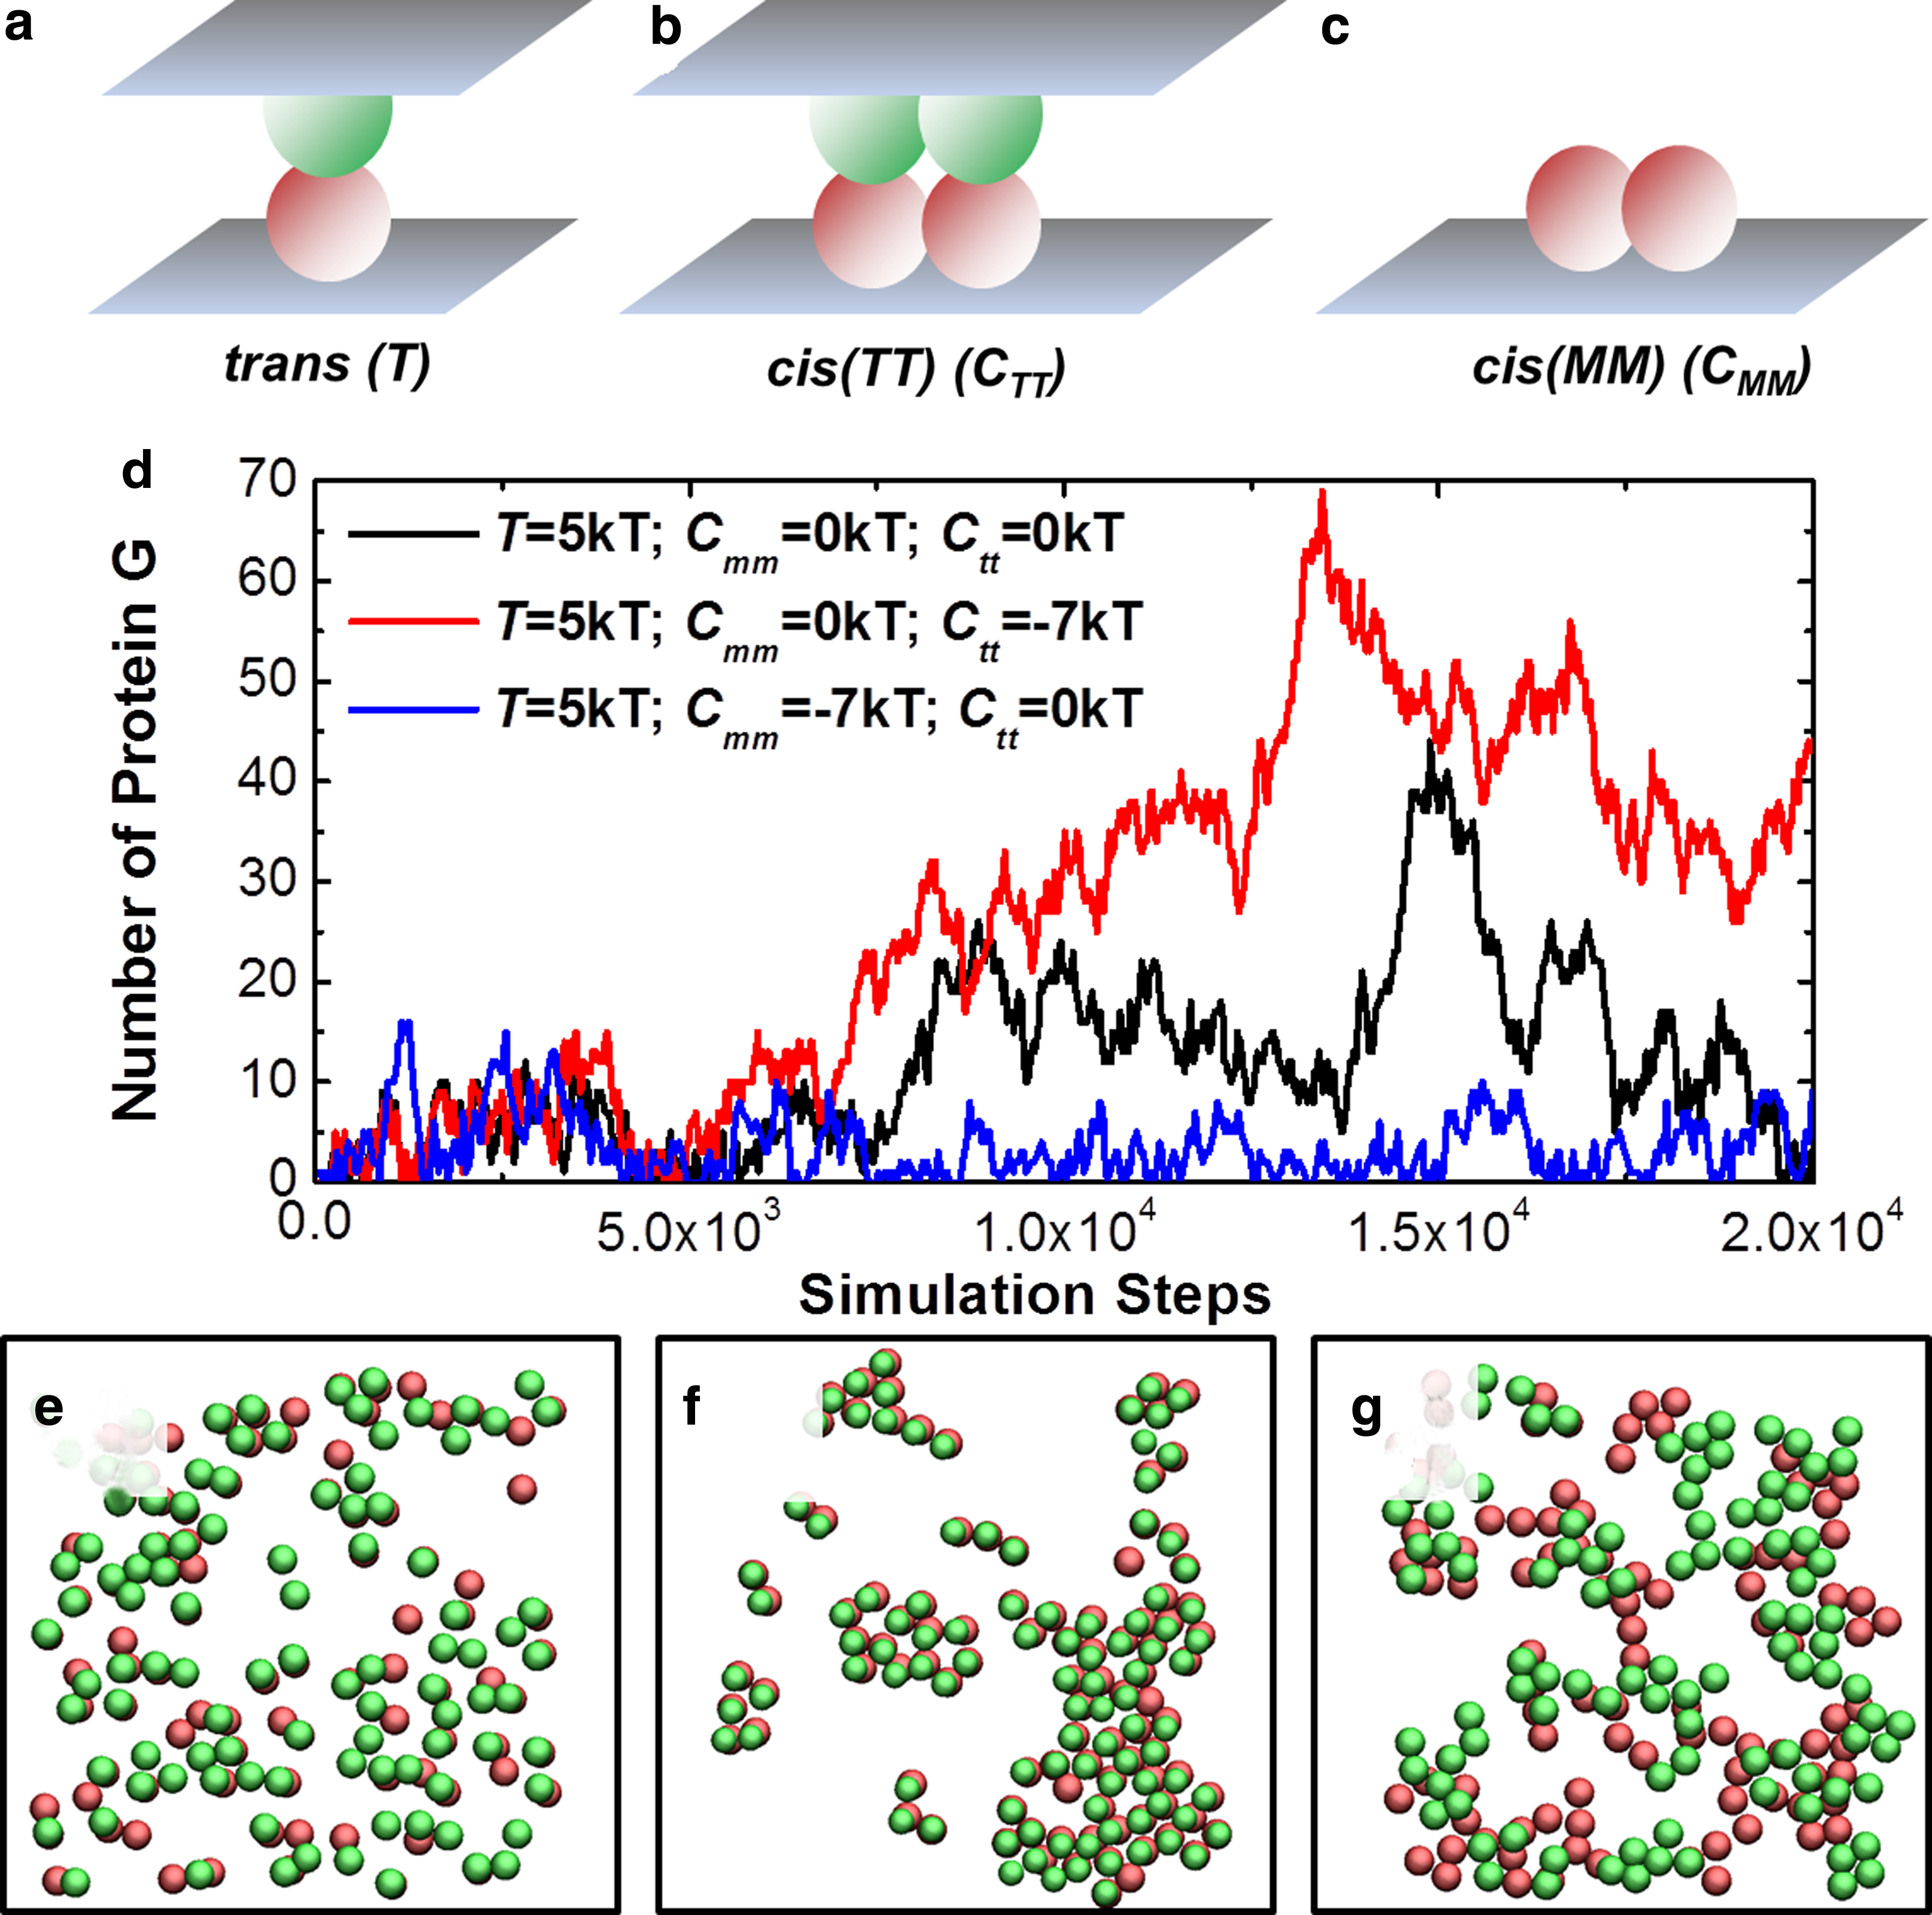
In order to evaluate the functional impacts of receptor clustering on cell signaling, three types of interactions are defined between receptors and ligands: a trans-dimer is used to describe an interaction between a receptor and its ligand from the opposite sides of cell surfaces
The simulation results of these three scenarios are plotted in Figure 4d. The figure shows how the number of target protein G changes along with simulation time in three scenarios. We found that after an initial phase in which target protein numbers in three scenarios were all very close, more target proteins were formed when the lateral interactions between trans-dimers were turned on. On the other hand, the number of target proteins was reduced when we only turned on the cis-interactions between receptor monomers. These results suggest that signaling outputs are closely related to the spatial organization of receptors on cell surface. In order to further investigate the mechanism of how receptors regulate signaling through spatial organization, snapshots are taken from the simulation trajectories of three scenarios (from Fig. 4e to Fig. 4g). In these figures, two layers of membrane surfaces are placed on top of each other. The red and green rigid bodies represent receptors and ligands on the lower and upper sides of the cellular interface. A trans-dimer forms between a receptor and a ligand if a red rigid body is overlapped with a green one in the figures. When no cis-interactions were allowed in the first scenario (Fig. 4e), a number of trans-dimers are randomly distributed at the cellular interface. Relatively, if lateral interactions were presented between trans-dimers (the second scenario), they aggregated into different sizes of clusters (Fig. 4f).
We propose that, due to the lateral aggregation, trans-dimers were spatially confined in the clusters. Consequently, dissociated trans-dimers were much easier to re-associate through this spatial avidity, leading to a larger number of receptor complexed formed on cell surfaces and thus a stronger output of cell signaling. In contrast, if lateral interactions were only presented between receptor and ligand monomers (the third scenario), clustering of receptors and ligands was obtained separately on each surfaces (Fig. 4g). Since the receptor and ligand clusters were formed at different locations of cellular interface, they competed with the probability of trans-dimerization. This led to a smaller number of receptor complexed formed on cell surfaces. The output of cell signaling was thus weakened. In summary, we demonstrated that cell signaling can be either amplified or inhibited through different organizations of receptor-ligand clustering, without changing the properties of their trans-interactions. Our simulation results therefore throw light on the importance of receptor clustering in regulating downstream signaling during cell adhesion of communications.
3.3. Evaluating the impacts of extracellular ligand oligomerization on cell signaling
In many cases of cell signal transduction, the extracellular ligands are spatially organized into multivalent complexes (Lees et al., 1994; Mammen et al., 1995). The most well-known example is the presence of multiple receptor binding sites in all classes of antibodies (Boyce and Holdsworth 1989; Dower et al., 1981; Engelhardt et al., 1991). Intuitively, the interplay between different sites in a ligand oligomer affects its overall binding to receptors. However, the specific mechanisms of this spatial regulation in a ligand and its impacts to downstream signaling have not been quantitatively understood. In order to probe the functional role of this multi-valence in regulating cross-membrane signal transduction, two specific simulation scenarios were designed. In the first scenario, receptors (red) are placed on cell surface, while ligands (green) are placed in the 3D extracellular region as monomers (Fig. 5a). In the second scenario, ligands are dimerized in the extracellular region (Fig. 5b). In the spatial simulations of the second scenario, a ligand dimer was simulated as an entity in the extracellular region. The conformational fluctuations within an oligomer were also incorporated in our model.
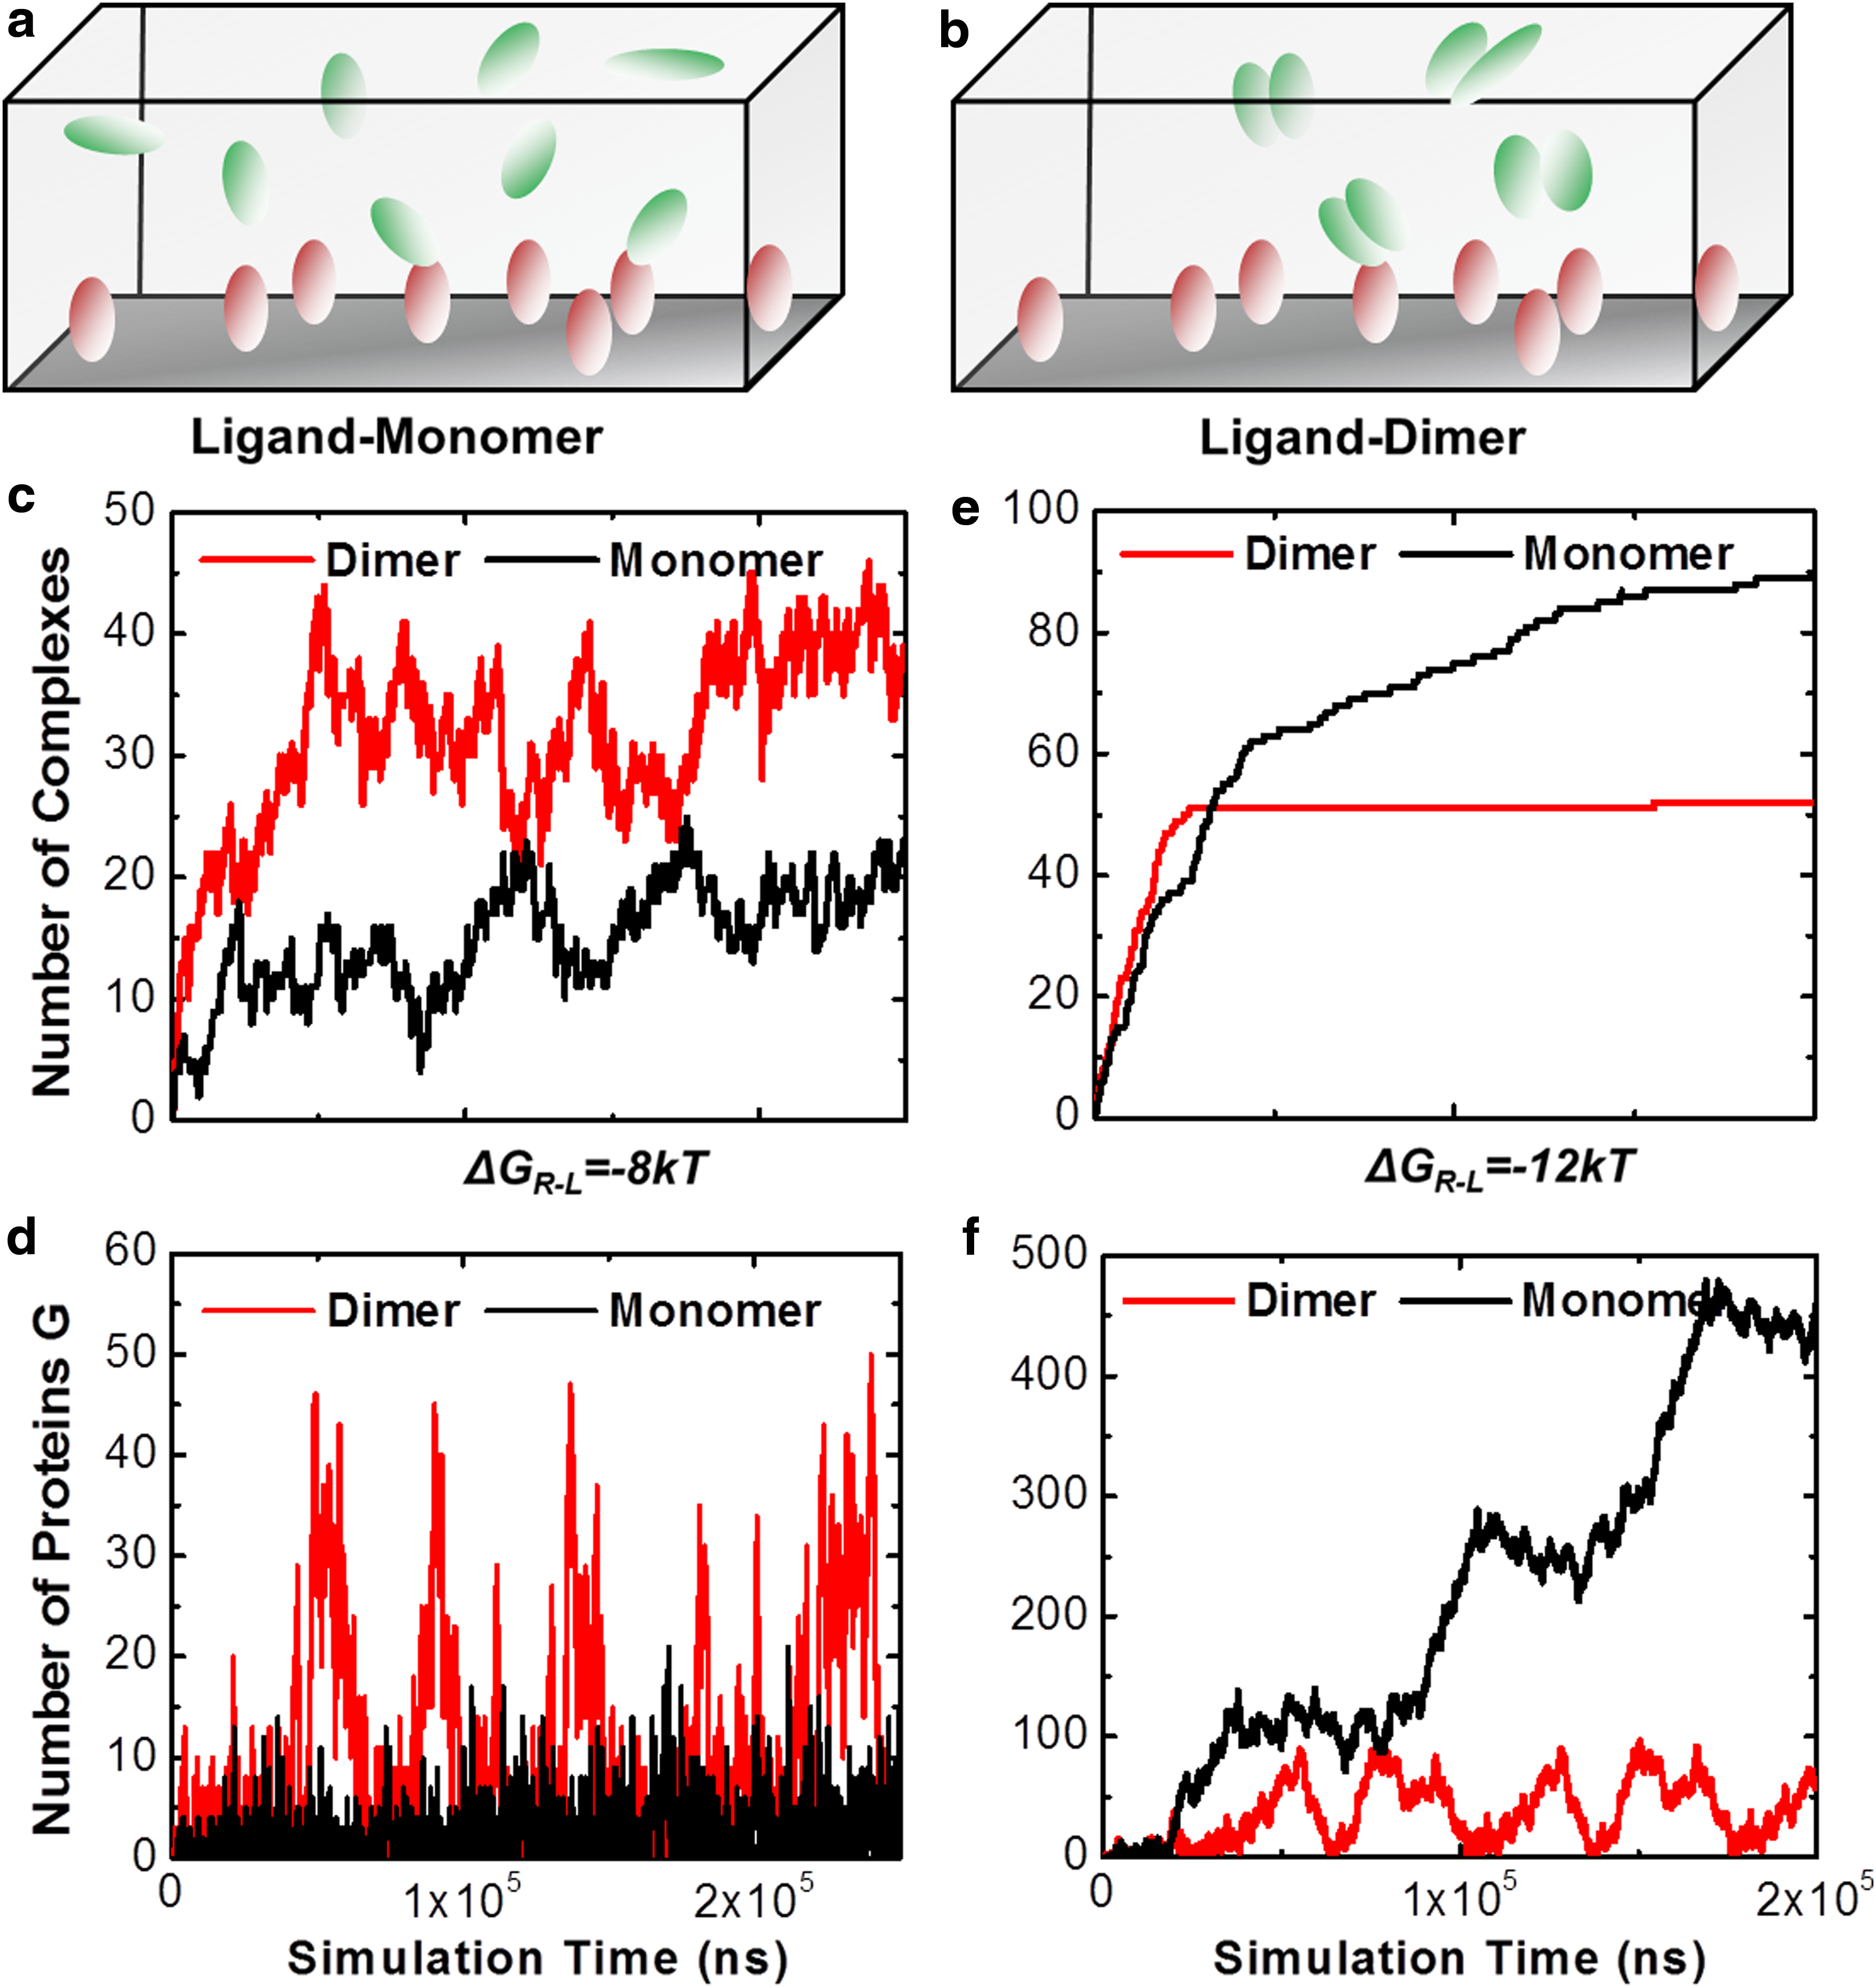
Two scenarios were designed to evaluate the impacts of extracellular ligand oligomerization on cell signaling. In the first scenario, receptors (red) are placed on cell surface, while ligands (green) are placed in the 3D extracellular region as monomers
Specifically, within each simulation time step, an additional operation was added to generate a small random perturbation along three translational and three rotational degrees of freedom for each ligand in a dimer. Additionally, after one ligand in a dimer binds to a receptor, the whole complex diffuses together with the receptor, so that the rest of the vacant binding sites in the complex can be accessible by other receptors. In both scenarios, 100 receptors were placed on a 300 nm ×300 nm cell surface. While 100 ligands monomers were distributed in a 3D extracellular space above the cell surface with 100 nm in height in the first scenario, 50 dimers were distributed in the same extracellular region of the second scenario. All other parameters kept unchanged in both scenarios, including the binding rate and affinity between receptors and ligands.
The initial population of un-phosphorylated transcriptional factors is 100, while the initial number of receptor complexes, phosphorylated transcriptional factors, and target proteins are 0. The detailed values of all simulation parameters can be found in the Supplementary tables. These parameters were arbitrarily determined from the ranges of previous experimental or theoretical studies to facilitate that our simulation can be carried out within the computationally feasible time scale. The density of receptors on cell surfaces was still kept as a constant to eliminate other effects in cell signaling.
The simulation results of these two scenarios are plotted from Figure 5c to Figure 5f. Two different values of binding affinity between receptors and ligands were tested for both scenarios. The affinity of −8kT was used to represent the relatively weak binding, and the affinity of −12kT was used to represent the stronger binding. The figures indicate very different signaling patterns between two scenarios, and these patterns further closely depend on the strength of binding affinity. Figure 5c to Figure 5d shows the results of weak binding. First of all, the number of complexes increases along with the simulation time. Moreover, we find that the system in which ligands are assembled into dimers formed more complexes with receptors than the system in which ligands are in monomers (Fig. 5c). Consequently, stronger signaling outputs were generated from the dimer scenario (Fig. 5d). One the contrary, when the binding affinity becomes stronger, more complexes formed and these complexes were more stable. Therefore, less fluctuation is observed in the curves of Figure 5e. More importantly, we find that, different from the weak binding, the dimer scenario formed less complex than the monomer system (Fig. 5e), resulting in a weaker signaling profile (Fig. 5f).
Based on these simulation results, we propose the following mechanism. Binding between one ligand in a dimer with its receptor brings the other ligand to the proximity of cell surfaces. When this ligand dissociates from the complex, the encounter probability of ligands in this dimer with other receptors is enhanced. This explains why ligands of dimers formed more complexes with receptors when their affinities are not strong. Under strong binding, however, after a ligand binds to a receptor, if this ligand is in a dimer, the entire dimer will diffuse with the receptor for a long period of time. This prevents the binding of the second ligand in the dimer with other receptors on cell surfaces. Therefore, we demonstrate that the spatial organizations of ligands can regulate their binding to receptors without changing the binding properties between individual ligand and receptor. Our simulations also imply that cell signaling can be artificially manipulated through designing of new ligand oligomers. These results provide new insights to the practical strategies of next-generation drug discovery.
3.4. Integrating the function of negative feedback loop into systems with spatial information
Oscillations, characterized by the periodic change of the system in time, arise in cell signaling networks as a result of various modes of regulation (Tiana et al., 2007). For example, the oscillations during cell-cycle are triggered by the hysteresis and bistability in Cdc2 activation (Pomerening et al., 2003; Sha et al., 2003). In another case, oscillations of cytosolic Ca2+ in a variety of cells where they can arise through extracellular stimulation or spontaneously were discovered after the development of Ca2+ fluorescent probes (Goldbeter, 2002). Genetic feedback loops are thought as a common driving force of oscillating biological systems (Pigolotti et al., 2007). The effects of negative feedback loops in cell signaling have not been considered so far in our model, because reaction r3 and r4 were turned off in the previous parts of study to avoid additional degrees of complication.
The function of the feedback loop and how it is affected by spatial organization of cell signaling will be investigated in this part by relieving the constraints of receptor synthesis and degradation. Specifically, simulations were carried out in a system that initially contained 50 receptors on a 300 nm ×300 nm surface and 200 ligands randomly distributed on an opposite surface with the same size (Fig. 6a). The initial population of un-phosphorylated transcriptional factors is 200, while the initial number of receptor complexes, phosphorylated transcriptional factors, and target proteins are 0. The detailed values of all simulation parameters can be found in the Supplementary tables. The system was evolved by the hybrid simulation introduced in Methods. In particular, synthesis of new receptors is modulated by number of protein G in the system following equation (9). If reaction r4 is selected in the Gillespie module, a new receptor will be placed on the cell surface in the following diffusion-reaction module. Similarly, if reaction r3 is selected, an existing receptor monomer will be eliminated from the cell surface.
Two simulation scenarios were designed to test the function of negative feedback loop in cell signaling. In the first scenario
Simulation results from the above system are plotted as black curves in Figure 6c and Figure 6d. The figures show that the oscillation pattern was stabilized after an initial phase of relaxation. Both numbers of receptor complexes and target proteins change with simulation time periodically, indicating that oscillations of the signaling pathway were generated by the coupling between the positive regulation of the transcriptional factor and the negative feedback of the target protein to the receptor. Additionally, there is a phase difference between the oscillations of receptor complexes and target proteins. The change of target proteins was delayed compared with the change of receptor complexes. This is due to the temporal effect of biochemical reactions in signal transduction.
Our results are consistent with previous mathematical description and experimental observations in various biological systems. We computationally illustrate that oscillations in cell signaling are resulted from the multiple controls of transcriptional regulation and genetic feedback loops. In order to further explore the impacts of spatial organization on signaling oscillation, we integrated receptor clustering into the modeling system. Specifically, all initial conditions and simulation parameters remained unchanged except that in the new scenario, lateral interactions were given to receptors after they formed trans-diners with their ligands (Fig. 6b). Simulation results of the new system are plotted as red curves in Figure 6c and Figure 6d. Similar oscillations of receptor complexes and target proteins were obtained from the new scenario. However, it differs from the original system in several ways. First, we found that the time of each period in the new oscillations is longer than the oscillations without cis interactions. Without receptor clustering, the fluctuations of target proteins show seven peaks before the end of simulations (the black curve in Fig. 6d). After cis-interactions are incorporated, the fluctuations of target proteins only show five peaks within the same amount of simulation time (the red curve in Fig. 6d). Second, the number of target proteins in each peak is higher when receptors can form clusters, although the number of receptor complexes does not show too much difference between two systems.
Possible mechanisms of these phenomena are proposed as follows. The clustering of receptors stabilizes their trans-interactions with ligands and slows down the degradation process of receptor monomers. One the other hand, the temporally accumulated receptor complexes induce stronger output of target proteins by the positive regulation of transcriptional factor. In turn, the stronger signal of target proteins slows down the synthesis of new receptors through the negative feedback loop. Consequently, the lower turnover rates of receptors due to their lateral clustering lead to the oscillation of the system with longer time periods and stronger signal of target proteins. These numerical experiments suggest that the spatial organization of molecular components can modulate the temporal pattern of signaling dynamics. Our computational observations can be experimentally validated by introducing mutations that block the cis-interactions of specific receptors and in the meanwhile measuring the change of downstream signaling profiles.
4. Concluding Discussions
Cells respond to external stimuli by a combination of different signaling pathways. These pathways are initiated by the activation of specific cell surface receptors through the process of cross-membrane signal transduction. Recent observations indicated that signal transduction is not a stochastic process. Distinct spatial-temporal regulation of the same repertoire of signaling molecules can lead to very different gene-expression profiles. Computational models with high spatial resolution were used to simulate certain steps in signal transduction, such as receptor clustering and formation of high-order signaling platforms. However, the functional impacts of these spatial processes on the downstream signaling pathways cannot be deduced from these methods. In contrast, network-based modeling approaches aim to decipher the entire dynamics of a signaling pathway. However, the spatial details revealed from these methods are limited.
Faced with this dilemma, we developed a hybrid simulation method that decomposes a signaling pathway into two modeling scenarios. The physical process of interactions between receptors and their ligand at cell surfaces are simulated by RB-based model, while the downstream biochemical reactions are modeled by stochastic simulation of ordinary differentiation equations. An algorithm was designed on top of two simulation models to synchronize the process of extracellular receptor-ligand interactions and cytoplasmic signaling processes. Genetic feedback loop was further integrated into the simulation framework to spatial-temporally control the expression level of membrane receptors on cell surfaces. Given the same values of concentration and binding parameter for all components in a simple testing signaling pathway, we show that distinct spatial patterns such as ligand oligomerization and receptor segregation or aggregation result in diverse signaling outcomes. For instance, the temporal oscillation of the signaling pathway was modified by the spatial clustering of membrane receptors. Therefore, our observations demonstrated that the precise control of signaling molecules in space is a critical determinant for specific cellular responses.
The current model still contains limitations that can be overcome through future improvements. First, several aspects of signaling pathway might be over-simplified in our model. In order to avoid a high degree of speculation about the mechanisms of different signaling pathways underlying different organisms and cell lines, a rather generic model system was built by implementing a set of generally accepted signaling modules. The model therefore can be interpreted as a framework that reflects the basic behaviors of cell signaling process, and can be later extended by incorporating additional signaling modules or by simply changing the values of the model parameters. Second, the biophysical process of ligand–receptor interactions and the biochemical process of downstream signal transduction are not in the same time scale. It is well accepted that cell signaling dynamics is in a longer time scale than ligand–receptor interactions.
In our model, these two processes are simulated by two different methods (diffusion-reaction and Gillespie simulations). These two algorithms are integrated together by a synchronizing parameter. This parameter determines how many steps of diffusion-reaction simulations are performed within each step of Gillespie simulation. The value of this parameter, however, was fixed throughout the simulations. It leads to the algorithmic inefficiency at the end of simulations when the computationally consuming diffusion-reaction model has already reached equilibrium. Therefore, in the future, an adaptive value of synchronizing parameter will be used.
Finally, this study only considers the effects of spatial organization on cell surfaces or at extracellular regions. There are many other subcellular processes in which spatial organization of molecular components are thought to regulate signaling patterns, for instance, the formation of high-order signaling platform by cytoplasmic scaffold proteins (Chung et al., 2007) or the assembly of large-scale transcriptional complexes in cell nucleus (Mosimann et al., 2009). While these processes are able to be simulated individually by our rigid-body based diffusion reaction model, the next technical problem that remains challenging is to couple these spatial models together in the framework of a signaling network. Upon further improvements, our model can potentially be applied to study functions of spatial organization in specific signaling pathways. Spatial organization has been found to play versatile roles in many different cellular signaling pathways. For instance, in the Wnt signaling pathway, the observation that Wnt stimuli induce aggregation of LRP6 receptors gives the perspective that clustering of receptors upon Wnt activation amplifies the signal transduction, which is known as the “signalosome” model (Bilic et al., 2007). Moreover, it has been found that the pathway is also closely regulated by cadherin-based cell adhesion (Chen et al., 2014; van Leeuwen et al., 2007). It was proposed that clustering of cadherin not only impacts the rate at which β-catenin is involved in the destruction loop, but also increases the phosphorylation rate of β-catenin and promotes its signaling in nucleus. The incorporation of Wnt or adhesive receptor clustering into the signaling network by computational modeling will help us elucidate these hypotheses.
In the NF-κB signaling pathway, the formation of high-order signaling complex through death domain (DD) induced aggregation was observed (Napetschnig and Wu 2013). Experimental evidence also shows that, upon stimulation of Toll-like receptors (TLR), the intracellular signaling proteins TRAF6 relocate from the cytosol to form clustered patches (Motshwene et al., 2009). The functional impacts of these spatial organizations on the NF-κB signaling pathway can be evaluated by our computational modeling. Finally, it is worth mentioning that, in order to understand the dynamics of the above-mentioned systems, it is necessary to collect information about kinetic coefficients and concentrations of the components in these pathways. While some have been measured experimentally, a large portion of these data remain unknown. On the other hand, recent efforts have been made in using available structural information to computationally model the protein–protein interactions. It is becoming a useful tool that enables quantitatively predicting the binding parameters of interacting proteins. A multiscale framework that integrates these structure-based prediction methods into current hybrid simulations will be expected to fill the missing link.
Footnotes
Acknowledgment
This work was supported by a start-up grant from the Albert Einstein College of Medicine. Computational support was provided by Albert Einstein College of Medicine High Performance Computing Center.
Author Disclosure Statement
No conflicting financial interests exist.
References
Supplementary Material
Please find the following supplemental material available below.
For Open Access articles published under a Creative Commons License, all supplemental material carries the same license as the article it is associated with.
For non-Open Access articles published, all supplemental material carries a non-exclusive license, and permission requests for re-use of supplemental material or any part of supplemental material shall be sent directly to the copyright owner as specified in the copyright notice associated with the article.