
Abstract
Abstract
The 16S ribosomal RNA (16S rRNA) gene has been widely used for the taxonomic classification of bacteria. A molecular signature is a set of nucleotide patterns, which constitute a regular expression that is specific to each particular taxon. Our main goal was to identify discriminating nucleotide patterns in 16S rRNA gene and then to generate signatures for taxonomic classification. To demonstrate our approach, we used the phylum Firmicutes as a model using representative taxa Bacilli (class), Bacillales (order), Bacillaceae (family), and Bacillus (genus), according to their dominance at each hierarchical taxonomic level. We applied combined composite vector and multiple sequence alignment approaches to generate gene-specific signatures. Further, we mapped all the patterns into the different hypervariable regions of 16S rRNA gene and confirmed the most appropriate distinguishing region as V3–V4 for targeted taxa. We also examined the evolution in discriminating patterns of signatures across taxonomic levels. We assessed the comparative classification accuracy of signatures with other methods (i.e., RDP Classifier, KNN, and SINA). Results revealed that the signatures for taxa Bacilli, Bacillales, Bacillaceae, and Bacillus could correctly classify isolate sequences with sensitivity of 0.99, 0.97, 0.94, and 0.89, respectively, and specificity close to 0.99. We developed signature-based software DNA Barcode Identification (DNA BarID) for taxonomic classification that is available at website http://www.neeri.res.in/DNA_BarID.htm. This pattern-based study provides a deeper understanding of taxon-specific discriminating patterns in 16S rRNA gene with respect to taxonomic classification.
1. Introduction
T
There are currently three major approaches for analyzing 16S rRNA sequence classification. First, composition-based methods such as RDP classifier (i.e., Naïve Bayesian algorithm) and k-nearest-neighbor (KNN), which are consider the k-mers from the query and training sequence dataset and both are quite efficient tools (Cole et al., 2005; Wang et al., 2007). Second, an alignment-based method such as MEGAN, which use BLAST to compare sequences and assign the probable species. Third, an alignment and composition-based method like SINA (SILVA Incremental Aligner), which utilizes a combination of k-mer and partial order alignment (Pruesse et al., 2012).
Liu et al. (2013) described the combined composition and phylogeny-based method MetaCV (Metagenome Composition Vector) to discriminate very short metagenomic sequences (75–100 bp) into specific taxonomic clusters. Based on discriminating patterns or motifs, the phyla Firmicutes and Bacteriodetes have been taxonomically classified by 26 bp and 12 bp motifs, respectively, using the 16S rRNA gene (Armougom and Raoult, 2008), which indicates the role of nucleotide patterns for sequence classification. To capture such patterns, it is important to apply efficient algorithm. Chu et al. (2006) demonstrated that the analysis of composite vector (CV) based on 18S and 16S rRNA sequences is a reliable clustering strategy. Raje et al. (2002) demonstrated that sub-sequences from a variable region could be assigned for Pseudomonas, where the residues at different positions carrying substitution could be relevant in species level diversity.
In our previous study, we used the distinguishing patterns from 16S rRNA gene sequences and classified the five closely related bacterial genera that are predominant in a specific environment niche. This was further extended as discrimination of closely related bacterial 16S rRNA sequences by tetra- and penta-nucleotide patterns and their classification through Self Organizing Maps (SOM) (Raje et al., 2010). Although different approaches have been suggested in earlier studies of sequence classification, there is no report based on Discriminating Nucleotide Patterns (DNP) to generate signatures for taxonomic classification.
The present study aimed to understand DNP in taxa in context with taxonomic classification at different taxonomical levels, mainly from class to genus. We targeted class I: Bacilli, order I: Bacillales, family I: Bacillaceae, and genus I: Bacillus with reference to Bergey's manual (Whitman, 2009) in phylum XIII: Firmicutes. We applied two approaches: Composite Vector (composition based) and Multiple Sequence Alignment (alignment-based) on 16S rRNA sequences of taxa. We then generated signatures by utilizing the DNPs information for each taxon that can be used for taxonomic identification. We have evaluated the classification strength of signatures with other methods of RDP classifiers: KNN and SINA. For taxonomic classification of 16S rRNA sequences based on encrypted QR-code signatures, we have developed a Windows-based DNA BarID software tool.
2. Materials and Methods
Figure 1 is a flow-chart illustrating the methodology of DNP identification and signature generation. All steps are performed using the different Perl and R scripts.
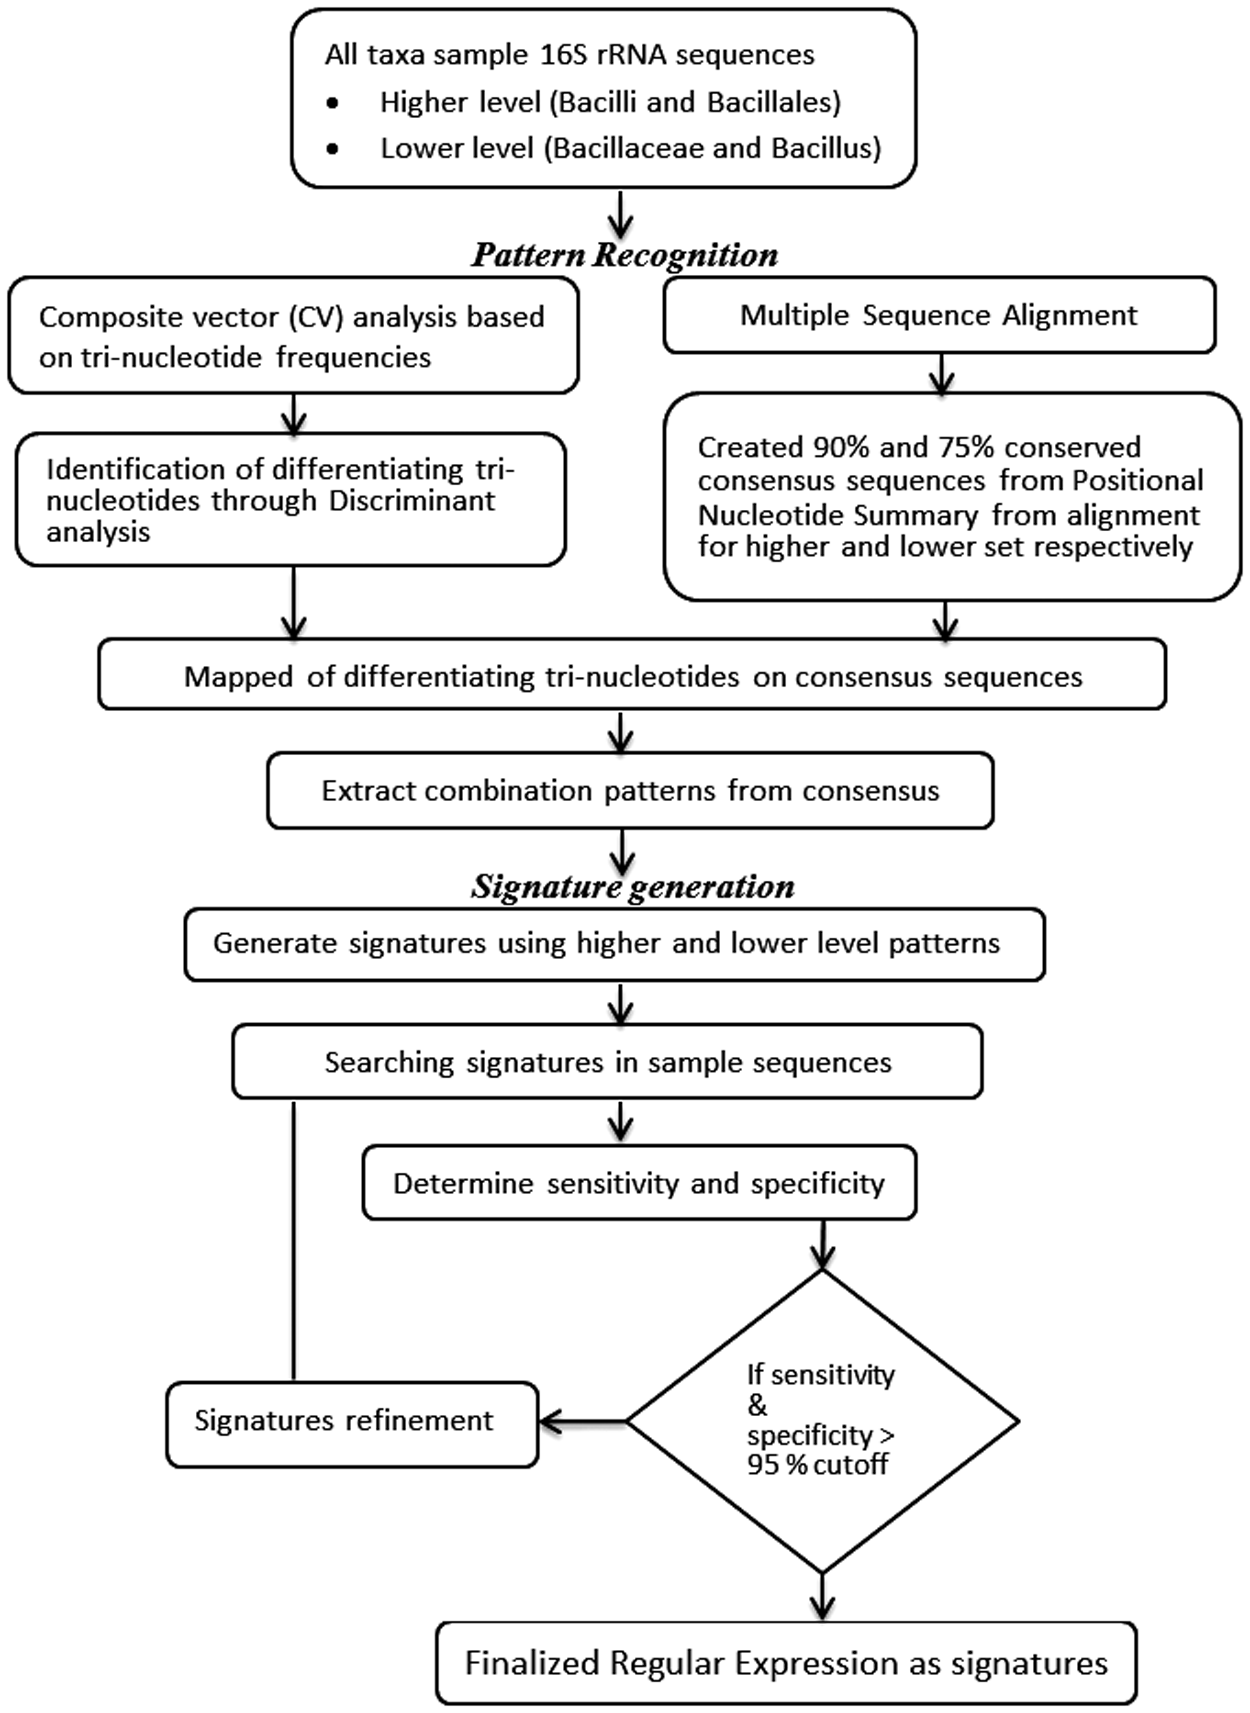
Flowchart describing overall signature generation approach used in study.
2.1. Sample data acquisition for pattern identification
A total of 3149 16S rRNA sequences belonging to phylum Firmicutes were obtained from the Ribosomal Database Project (RDP). We selected only sample species representative for each taxon and the corresponding sequences (nearly full length >1300 bp) were retrieved, as noted in Table 1. The sequences containing long stretches of consecutive Ns were discarded. The sequence RDP accession number name list is listed in Supplementary Table S1 (supplementary material is available online at www.liebertpub.com/cmb).
2.2. Composite Vector analysis
The tri-nucleotide frequencies were determined for each sequence with a 1-bp sliding window. The signal and noise values were calculated for each sample sequence (Chan et al., 2010). For a sequence of length N and a fixed size of string k (1 < k < N), the frequency of each k-string u is determined as follows:
where g(u) is the number of times a particular u appears in the sequence. Generally, the phylogenetic signals in the biological data are often obscured by noise and bias. Denoising is essential for the CV method; several models have been proposed to estimate the noise with each entry being signal-to-noise ratio so that the CV is obtained. Thus, if for a string u, f (u) is the frequency, and q(u) is the estimated noise, then the composition vector for the sequence is the 4
k
–vector, where each entry equals
which is the signal-to-noise ratio of the uthstring. Amongst different models, we adopted Markov model to quantify the noise of k-string. The composite vectors were obtained for each 4 k string and each sampled sequence. In the present context, we used trinucleotides and obtained CV values for each of the 64 trinucleotides.
2.3. Discriminating patterns identification and signatures generation
The method makes use of some test criteria to identify the most relevant features in the discriminant model. Here, model refers to a discriminate function or linear composite of features that predicts the group membership of sequences. Three main criteria were used as follows: 1) Wilk's lambda: This statistic gives the ratio of within-group sum of squares to the total sum of squares, when each feature is considered individually across different groups. 2) Tolerance: The degree of linear relationship between the variable (trinucleotides in this case) and the remaining set of features. Any variable whose tolerance was less than the specified value of 0.001 was not considered in the model. 3) F-statistic: It was computed using one-way Analysis of Variance (ANOVA), treating each variable as though it is the only variable in the model.
The variable with the smallest Wilk's lambda and correspondingly largest F-statistic was selected, subject to the condition that F-statistic was greater than some predefined value, F-to-enter. The feature with the smallest Wilk's lambda was selected at the next stage. The procedure resulted into a subset of variables (trinucleotides) that were most discriminating across the groups.
For Bacilli and Bacillales, the set of sequences were subjected to MSA using the ClustalW program as implemented in BioEdit version 7 (Hall, 1999). The positional nucleotide summary with 95% conserved position of nucleotides was referred and the corresponding consensus pattern was considered for downstream analysis. The differentiating trinucleotides obtained through composite vector and discriminant analysis were mapped in consensus sequence of each group using binary coding system (1 to presence and 0 for absence). The trails of 1s were considered as distinguishing patterns at higher taxonomic levels. At the family and genus levels, sequences were further grouped into the six different bins based on their lengths with 50 bp intervals, and the same earlier steps were performed to get the patterns.
2.4. Sensitivity and specificity of signatures
The classification strength of signatures were determined in terms of sensitivity and specificity. Thus, if there are N sequences in the target taxa, and amongst these let N1 belong to taxonomic level of interest and let N2 be the other sequences. When the signature of particular taxonomic level is searched against the dataset, if n1 (n1≤N1) sequences are matched from the target taxa and n2 (n2≤N2) from the other dataset, then sensitivity and specificity of signature are defined as:
Among different possible signatures for a taxon, the one with sensitivity and specificity above a certain threshold level could be regarded as a candidate signature for the target taxa.
2.5. Hypervariable region analysis
In order to check the pattern distribution of the signatures in V regions in sequence, previously reported forward and reverse primers for V1 to V9 regions were referred and listed in Supplementary Table S2 (Ercolini et al., 2001; Claesson et al., 2010; Guillou et al., 2013; Zumbrun et al., 2013). All the V1f, V2f, V2r, V3f, V3r, V4f, V4r, V5f, V5r, V6f, V6r, V7f, V8r, and V9f in silico sites were detected in Bacillus subtilis (T) DSM10 AJ276351 (RDP: S000003473; length: 1517 bp) sequence. These locations of V regions were further referred for mapping of patterns of signatures.
2.6. Comparative evaluation of signatures with other methods
We retrieved classified isolates sequences from the RDP browser based on the combination of following criteria: Strain: Type, Source: isolates, Size: > = 1200 bp; Quality: Good; Taxonomy: RDP nomenclature. All isolate dataset was searched against all signatures. Further, we applied and KNN method implemented in Mothur version 1.31.2 software (http://www.mothur.org), trained on the SILVA database (Quast et al., 2013), using 0.8 confidence values as cut off with default parameters. The web-based SINA 1.2.11 version was used with default alignment parameters (search and LCA classify) to assign taxonomy.
2.7. Implementation of DNA BarID software
We have developed Windows-based DNA Barcode Identification (abbreviated as DNA BarID) software tool for taxonomic classification based on signatures. All generated signatures were encrypted into QR codes. The front-end and back-end is designed in C# and Perl (BioPerl) script, respectively.
3. RESULTS AND DISCUSSION
3.1. Discriminating nucleotide patterns identification and signatures generation
Following the approach detailed above, discriminating patterns based signatures for Bacilli, Bacillales, Bacillaceae, and Bacillus are listed in Table 2. There were total 10, 9, 15, and 11 different patterns separated by specified distance in signatures of Bacilli, Bacillales, Bacillaceae, and Bacillus, respectively, which were unique to the corresponding taxa and play decisive roles in taxonomic classification. These signatures have two important characteristics—first, they have a unique combination of taxa specific patterns, and second, the distance between two consecutive patterns provide the discrimination strength to particular taxa from others sequences.
IUPAC name coding system was referred to represent ambiguous base pairs substitution in the pattern. The distance between two consecutive patterns in signatures were defined by \w{n, m}, where n is the minimum and m is the maximum number of nucleotides between two patterns. The \w stands for a word character (nucleotides) in signatures.
To understand covered regions of signature on a complete 16S rRNA gene, a circular visualization of signatures is represented through a representative 16S rRNA sequence of the species Bacillus subtilis (T) DSM10 (RDP: S000003473; length: 1517 bp) as shown in Figure 2. Based on mapping of signatures, the Bacilli, Bacillales, Bacilliaceae, and Bacillus signatures span a region starting from position 278–1145 bp, 223–1205 bp, 124–1339 bp, and 484–1290 bp, respectively, with unique patterns C1–C10, O1–O9, F1–F15, and G1–G11.
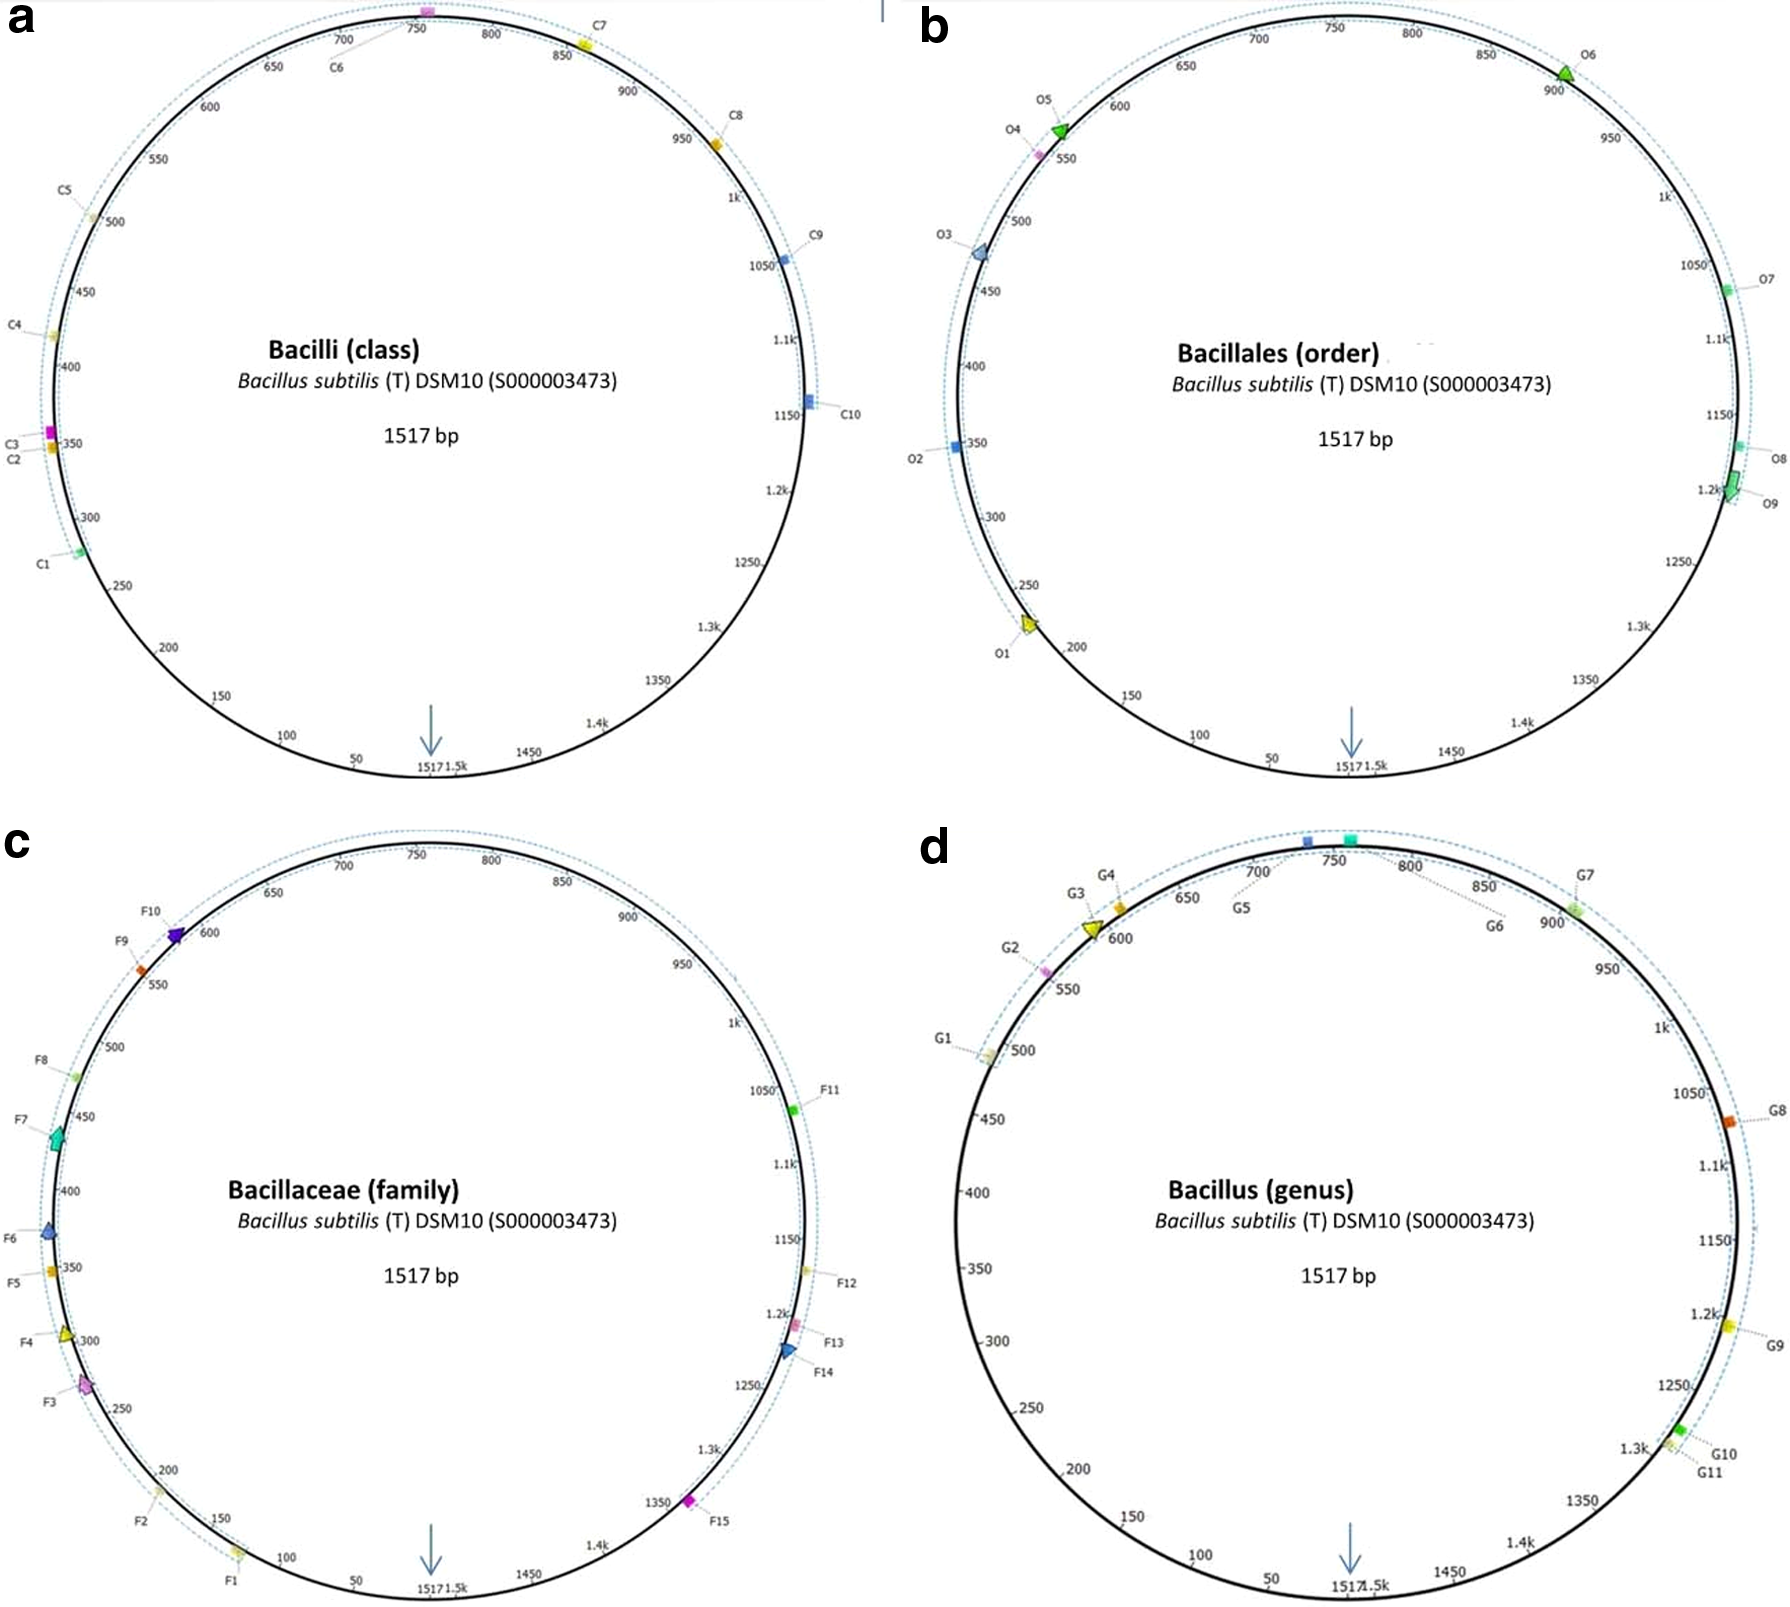
Circular representation of signatures in Bacillus subtilis (T) DSM10 AJ276351 (RDP: S000003473) as representing sequence of all taxa:
3.2. Evolutionary patterns analysis across signatures
The evolutions of patterns in hypervariable regions were studied across taxonomic levels; it has been highlighted with respective color codes in Figure 3. For Bacilli signature, the patterns C2, C5, C7, and C8 play a role within class members and Bacillales, while C1, C,3 C4, C6, C9, and C10 patterns have roles to discriminate from others class in phylum Firmicutes and other phyla (Fig. 3a). At the order level, for Bacillales, patterns O2, O3, O6, and O7 showed few base pair substitutions in the parent signature at class level. For instance, in pattern O2 (7 bp), the fifth nucleotide position has been substituted from B (G/T/C) to K (G/T), implying that either G or T nucleotides is much conserved. Also, the seventh nucleotide position in the same pattern has been substituted from V (A/C/G) to G, which shows that G nucleotide is much conserved for Bacillales, while A or C represent other taxa in Bacilli.

Evolution of patterns in signatures at different taxonomic levels:
A similar scenario was also observed in child patterns O3, O6, and O7. Remaining patterns O1, O4, O5, O8, and O9 were exclusive for order Bacillales (Fig. 3b). Further, for family Bacillaceae, the pattern F12 was same as O8 from Bacillales signature; while F5 pattern evolved from O2 with mutations at first three base pair position. Remaining patterns were unique at family level (Fig. 3c). For genus Bacillus, it was observed that patterns G2 and G3 mutated from parent patterns of Bacillaceae (F9 and F10, respectively), suggesting that these two pattern mutations are specific to Bacillus and discriminating from other genus members of the family Bacillaceae.
Remaining patterns were unique at the genus level (Fig. 3d). Thus, based on pattern evolution in discriminating patterns from signatures, the three important observations are: (i) the identified patterns are crucial and provide additional support at lower taxonomic levels; (ii) child patterns evolved in lower level signatures and show taxa specific base pair substitutions, (iii) the newly emerged patterns at lower level play a decisive role in discrimination with the evolved patterns.
3.3. Hypervariable region analysis covered by signatures
The detailed pattern distributions in each V region are given in Supplementary Table S3. As shown in Figure 4, each pie chart represents the total patterns percentage falling in particular hypervariable region sequence. We found discriminating patterns were mostly abundant in individual V3 regions of three taxa viz. Bacilli (40%), Bacillales (23%), and Bacillaceae (27%), except Bacillus (9%). V2 region equally dominant along with V3 in Bacillaceae with 27% each. V4 region is most abundant in Bacillus with 37%. These observations indicate that there is bias for V region at different taxonomic levels for these taxa, and combined region is crucial for discrimination.
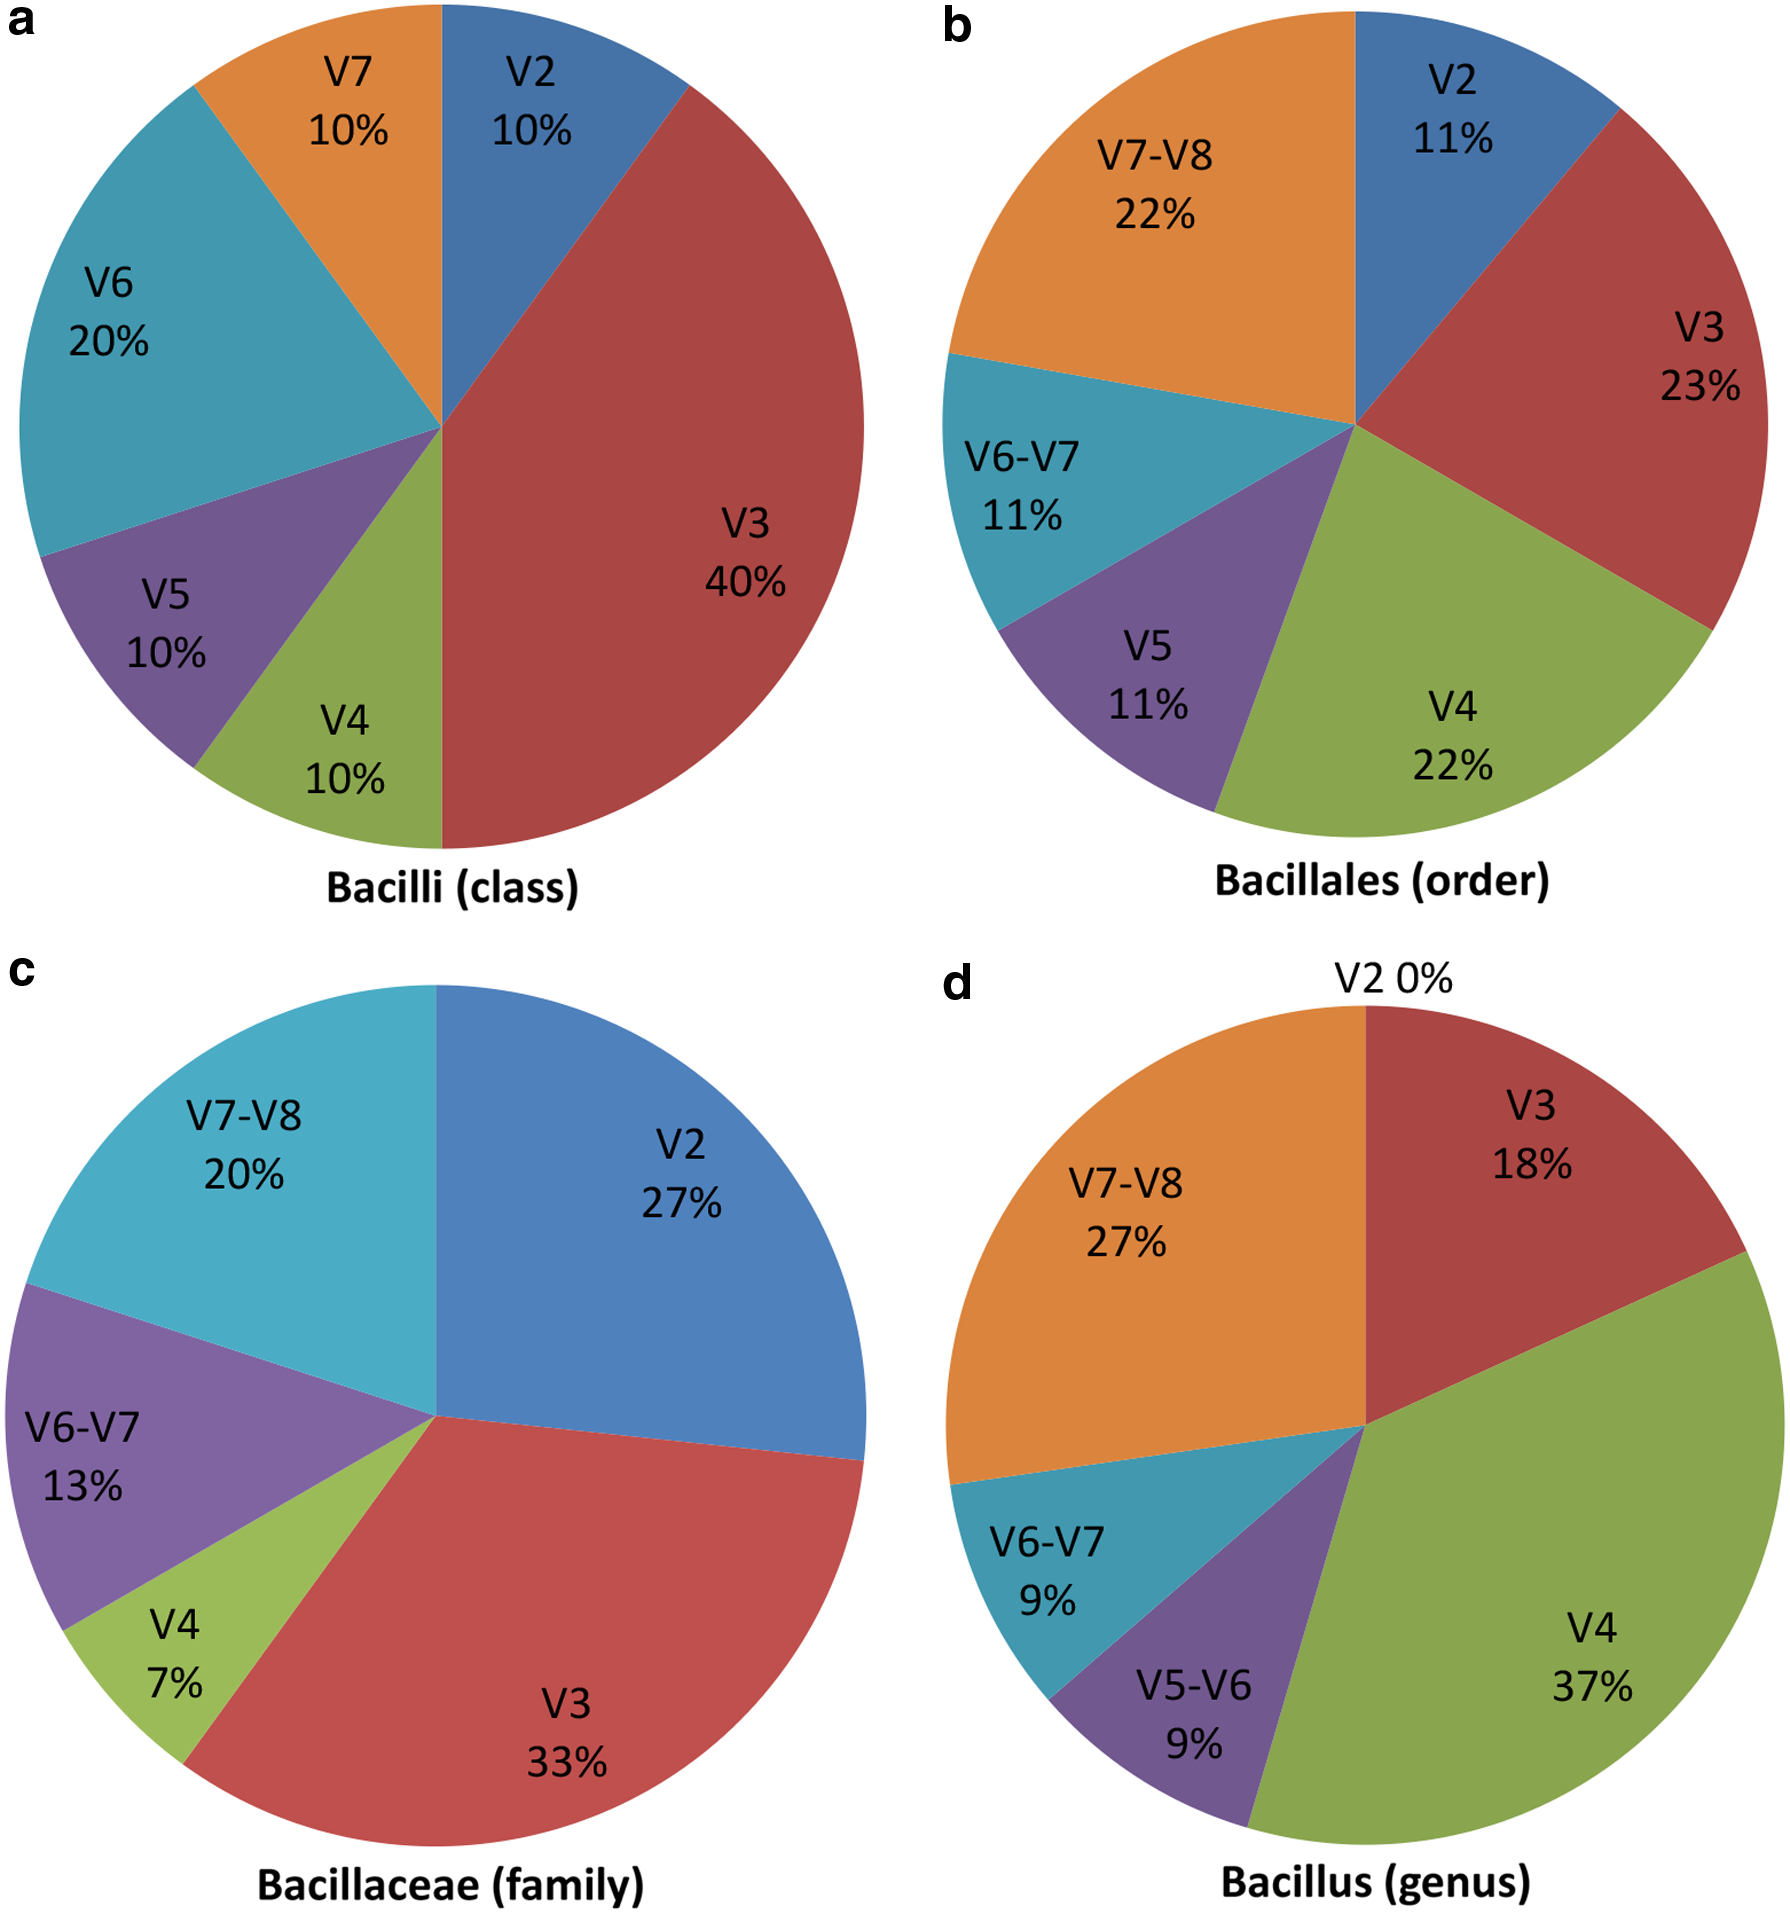
Pie chart showing percentage of total signature patterns falling in V regions at each taxonomic level:
The combined region results revealed that at class level, for Bacilli taxa, out of 10, there were 5 (50%) patterns observed in the combined V3–V4 regions. At order level, for Bacillales, 4 out of 9 (45%) patterns were observed in combined V3–V3 region. For the family Bacillaceae, there were a total of 15 patterns, out of which 8 (54%) were observed in combined V2–V3 regions; followed by 5 (33%) in V3–V4 regions. In the case of the genus Bacillus, 6 out of 11 (55%) discriminating patterns were found in the combined V3–V4 regions. These observations are consistent with Vasileiadis et al., (2012) study, which indicated that the region belonging to the V3–V4 region is a distinguishing region for species classification. Based on pattern-based results, we suggest that instead of the individual V region, the combined V3–V4 region could be an appropriate target for accurate sequence classification.
3.4. Comparative evaluation of signatures with RDP classifier, KNN, and SINA methods
To evaluate the classification strength of signatures with other methods, mainly RDP classifier, KNN and SINA, the evaluation was performed on the selected test 16S rRNA dataset sequences (Table 3). Comparative evaluation results revealed that the signatures for Bacilli, Bacillales, Bacillaceae, and Bacillus could correctly classify isolate taxa sequences with sensitivity of 0.99, 0.97, 0.94, and 0.89, respectively, and specificity close to 0.99. The KNN method showed higher sensitivity and specificity for Bacilli taxa sequences with 0.99 and 1, respectively. However, in case of Bacillales, Bacillaceae, and Bacillus taxa, the method resulted into slightly lower sensitivities as compared to signatures.
FN, False Negative; FP, False Positive; TN, True Negative; TP, True Positive; Sn.: Sensitivity; Sp.: Specificity.
The alignment-based SINA approach provided an improved and nearly similar classification accuracy with RDP classifier for Bacilli and Bacillales taxa. As inferred from Table 3, to increase signature specificity, some additional patterns or single base pair mutations still must be captured to minimize the number of false positives. Also, pattern refinement and repetitions and the mismatch of distance boundary between two consecutive patterns in regular expression could be considered as a possible limitation. The comparison of signatures with the existing methods (i. e., RDP classifier, KNN, and SINA) suggests that the proposed approach was relatively comparable for isolates sequences.
3.5. DNA Barcode identification (DNA BarID) software
For application utility, previously programs such as TaxI (distance-based) for the 16S rRNA fish dataset and DNA QR Code Web Server (BLAST and distance-based) for plant are reported for DNA barcoding purpose (Steinke et al., 2005; Diazgranados and Funk, 2013). Quick Response (QR) barcode system could be efficiently implemented to identify and track samples (Liu et al., 2012). On similar lines, we have developed a graphical user friendly tool DNA BarID, with the primary intension of rapid taxonomic classification of query 16S rRNA sequences by matching with those of taxa QR encrypted signatures in a reference library.
The front-end of DNA BarID is shown in Figure 5. The developed signatures were encrypted into the QR codes (as shown in Fig. 5b). Using the Sequence and Barcode menu function, a user can upload multiple FASTA format 16S rRNA sequences as a query and select single or all signatures from Bacilli, Bacillales, Bacillaceae, and Bacillus options (Fig. 5b). During search, regular expression-based signatures are scanned against input query sequences and then assign the corresponding taxa based on its presence. The sample dataset, user manual (video tutorial) is provided with software. The Windows-based executable version can be downloadable at website http://www.neeri.res.in/DNA_BarID.htm.
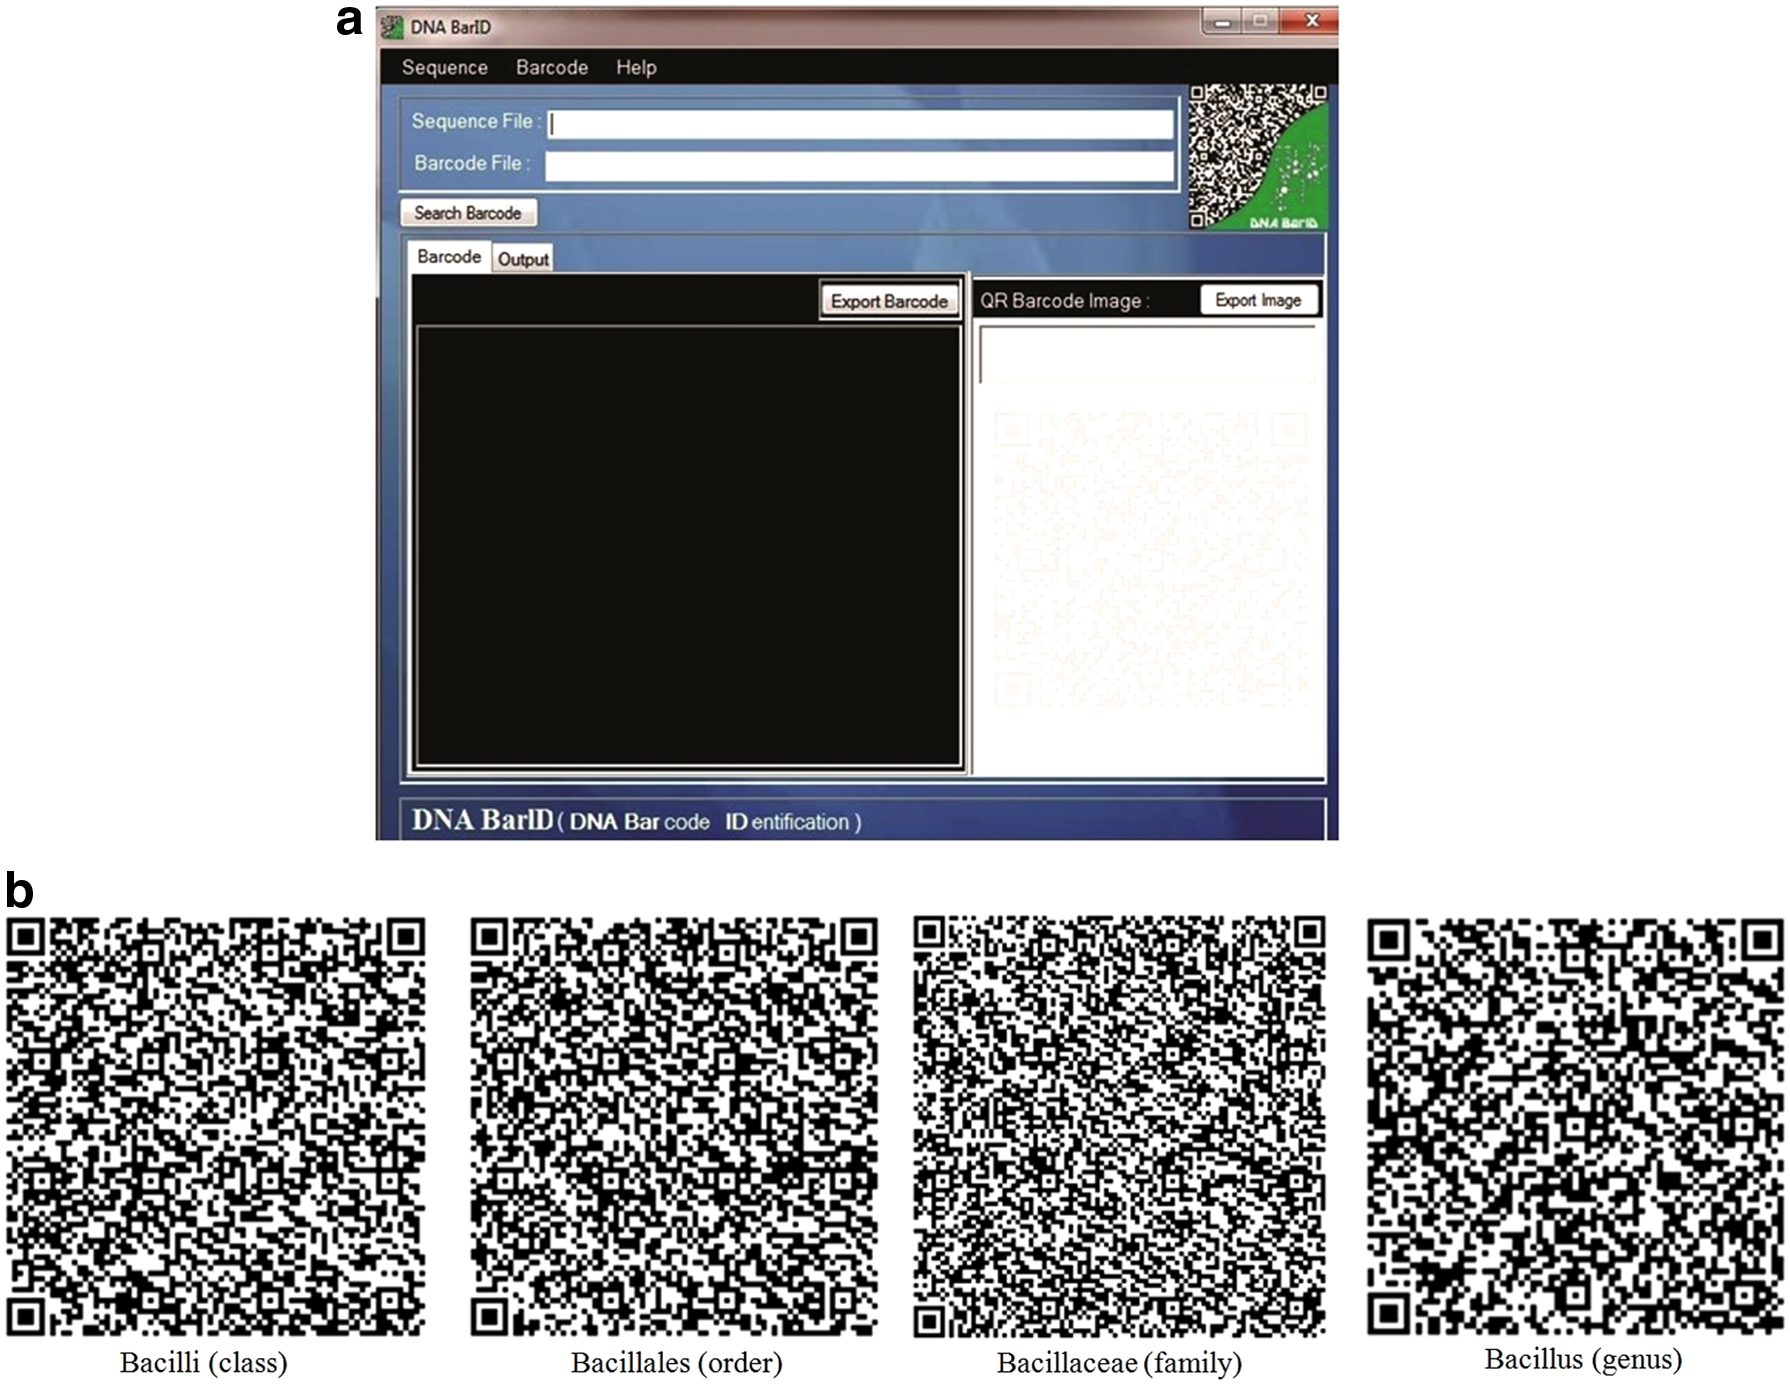
QR-based DNA BarID software:
4. Conclusions
Through this study, we have demonstrated how a combination of patterns within 16S rRNA as a signature could be used for taxonomic classification by selecting hierarchically dominating taxa in phylum Firmicutes. We believe that the signature-based approach, coupled with the existing algorithms, would certainly strengthen taxonomic classification of 16S rRNA sequences. This exercise would be helpful to examine which regions may be more appropriate for detection of bacterial genus as accurately as possible. Further, the outcome of V region analysis will help in selection of a target region for the designing of specific primers for wet experiments. In summary, we observed that the developed regular expression-based signatures for model phylum provides a comparable taxonomic identification. At present, only taxa of interest from one phylum have been encrypted. However, in near future, we intend to add other taxa. The approach could help in generating signatures for organisms; and will find application in their rapid identification.
Footnotes
Acknowledgments
We acknowledge the support of Dr. Dhananjay V. Raje for statistical analysis, Ms. Rupali C. Mane and Ms. Trupti Kahate (MDS Bio-Analytics, Nagpur) for Bioinformatics, as well as developing DNA BarID software. Authors are also thankful to Director CSIR-NEERI for supporting this study under CSIR- ESC108 program. Ravi P. More acknowledges the Swami Ramand Teerth University, Nanded, Maharashtra, India for carrying out his Ph.D. work.
Author Disclosure Statement
No competing financial interests exist.
References
Supplementary Material
Please find the following supplemental material available below.
For Open Access articles published under a Creative Commons License, all supplemental material carries the same license as the article it is associated with.
For non-Open Access articles published, all supplemental material carries a non-exclusive license, and permission requests for re-use of supplemental material or any part of supplemental material shall be sent directly to the copyright owner as specified in the copyright notice associated with the article.