




Abstract
Abstract
Connecting a genotype with a phenotype can provide immediate advantages in the context of modern medicine. Especially useful would be an algorithm for predicting the impact of nonsynonymous single-nucleotide polymorphisms in the gene for PTEN, a protein that is implicated in most human cancers and connected to germline disorders that include autism. We have developed a protein impact predictor, PTENpred, that integrates data from multiple analyses using a support vector machine algorithm. PTENpred can predict phenotypes related to a human PTEN mutation with high accuracy. The output of PTENpred is designed for use by biologists, clinicians, and laymen, and features an interactive display of the three-dimensional structure of PTEN. Using knowledge about the structure of proteins, in general, and the PTEN protein, in particular, enables the prediction of consequences from damage to the human PTEN gene. This algorithm, which can be accessed online, could facilitate the implementation of effective therapeutic regimens for cancer and other diseases.
1. Introduction
P
Nonsynonymous single-nucleotide polymorphisms (SNPs) lead to variation in the amino acid sequence of a protein. A variety of computational and structural machine learning methods have been used to probe the effects of SNPs on protein structure and function (Chan et al., 2007; Miller et al., 2011; Thompson et al., 2012). Current methods include some that use only multiple protein alignments, some that use only structural information, and some that combine these two inputs (Katsonis et al., 2014). Especially notable are predictive approaches related to missense substitutions in mismatch repair genes that can underlie rapid, noninvasive diagnoses in the clinic (Thompson et al., 2012).
Typical structure-based nonsynonymous SNP computational prediction methods calculate the change in the conformational stability of a protein that results from an amino acid change (Topham et al., 1997). These methods explore the three-dimensional environment proximal to an amino acid substitution, insertion, or deletion (Capriotti and Altman, 2011). Changes to residues in the core of a protein often have greater consequences for conformational stability than do changes on the surface (Cordes et al., 1996). Consequently, typical methods are likely to undervalue changes that are important for protein–protein or protein–ligand interactions. Also, only a small fraction of proteins have known three-dimensional structures, as is usually required by these methods.
Support vector machines (SVMs) are machine learning algorithms that are able to take input data points that are associated with a class (Bishop, 2006). Each data point has a collection of information, called a vector, collated from a variety of sources. The vector allows the SVM to associate particular sets of information with classes. After taking in a number of vectors and their associated classes as training data, SVMs predict the class of an unknown vector (Fig. 1).
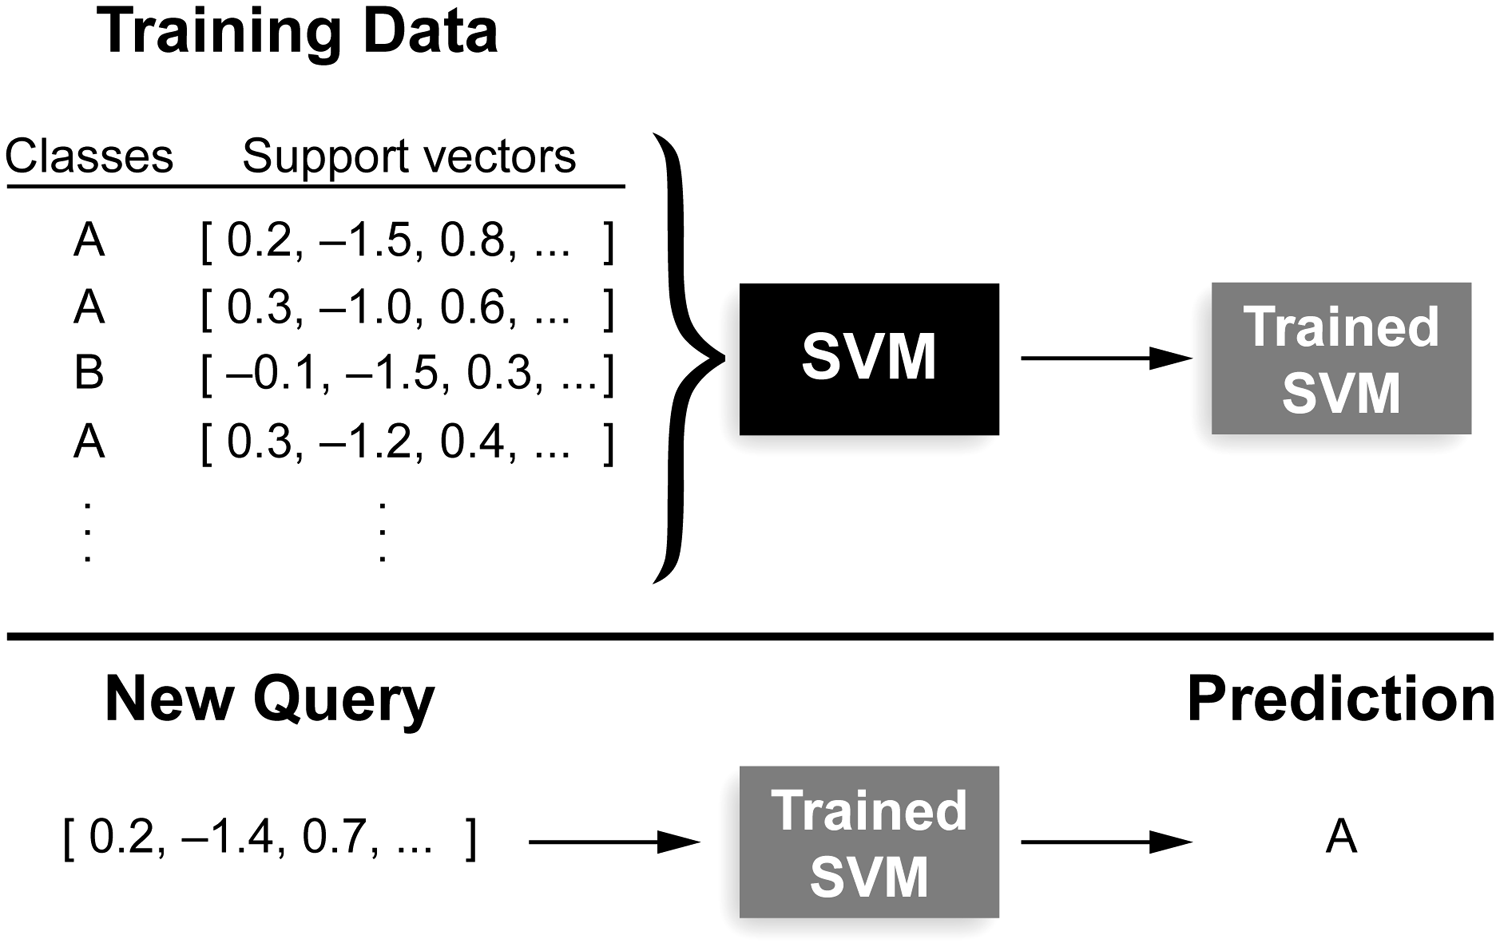
Workflow for an SVM classifier. The SVM is presented with a number of support vectors that are each associated with a specified class here, A or B. The trained SVM is then able to predict the class of a new queried support vector. SVM, support vector machine.
As the central importance of PTEN in cancer and other syndromes becomes more and more apparent (Song et al., 2012; Worby and Dixon, 2014), we reasoned that a predictor focused entirely on PTEN mutations could have value. Here, we present such a predictor: PTENpred.
2. Methods
PTENpred takes input from different analyses and combines them using an SVM algorithm (Bishop, 2006). Each feature is a score that has been calculated from the three-dimensional structure of PTEN (for secondary structure or solvent-accessible surface area scores) or a score that is the result of a predictor designed to predict the results of an amino acid change in PTEN. Secondary structure and solvent-accessible surface area scores were derived from Protein Data Bank (PDB) entry 1d5r (Eisenhaber and Argos, 1993; Frishman and Argos, 1995) or were predicted with SPIDER2 (Heffernan et al., 2015).
2.1. Variation data and classes
The input data on PTEN amino acid variations were derived from many different sources and are listed in the Supplementary Material. The total number of variations (676) were sorted into four classes: null (70), autism related (16), somatic cancer associated (502), and germline hamartoma tumor syndrome (PHTS) associated (88). Null variants were derived from dbSNP (Sherry et al., 2001), the Human Gene Mutation Database (HGMD) (Stenson et al., 2014), and variants found to be active in a yeast PI3K/PTEN system (Rodriguez-Escudero et al., 2011; Rodriguez-Escudero et al., 2014). Autism-related variants and variants related to PHTS were derived from the HGMD and other individual publications. Somatic cancer variants were from the Catalogue of Somatic Mutations in Cancer [COSMIC (Forbes et al., 2015)].
As expected, we found significant overlap between mutations associated with somatic cancer and those associated with germline PHTS. Two variables for somatic mutations were taken into account to distinguish these classes: (1) the number of times that a particular mutation has been found in somatic cancer overall and (2) the average number of total changes to PTEN found in each sample. For example, the PTEN variant Y155C occurs 10 times in tumor samples found in the COSMIC database. Of those 10 times, the average number of total changes to PTEN is 1.3. From these numbers, we can hypothesize that Y155C is a relatively common PTEN variation in somatic cancer and that this variation might indeed inactivate PTEN fully. The Y155C variant is also found in a patient with Cowden Syndrome (Gicquel et al., 2003), indicating that germline variation can result in inactivation of PTEN. Most changes found in both PHTS and the COSMIC database are classed as PHTS variations.
2.2. Data set grouping
The contents of several classes were small compared to the total number of variations. Accordingly, we thought it would be helpful to group classes in five different ways. For easy comparison to already established predictors, we grouped classes into two types: “null and pathogenic” (where null is the null class and pathogenic is a group of autism-related, somatic cancer-related, and PHTS-related classes, hereby designated N/ASP) and “null-autism and pathogenic” (where null-autism contains both autism and null classes and pathogenic contains somatic cancer and PHTS classes, hereby designated NA/SP). We also established groups of three classes: “null, autism, and pathogenic” (where pathogenic is somatic cancer and PHTS classes, hereby designated N/A/SP) and “null, mild affecting, and PHTS” (where mild affecting is somatic cancer and autism classes, hereby designated N/AS/P). The last grouping has each class alone (designated N/A/S/P). A separate SVM classifier was trained on each of the five groupings.
2.3. SVM classifier training
The SVM classifiers were trained using Python version 2.7.9 (Downey et al., 2002) and the scikit-learn project package version 0.15.2 (Pedregosa et al., 2011), which is itself an implementation based on the LIBSVM package (Chang and Lin, 2011). The data set was scaled using the StandardScaler object in scikit-learn. Each classifier used the SVC method in scikit-learn with the radial basis function kernel. Class weights were adjusted to be inversely proportional to their frequencies (i.e., classes with fewer members are weighted more). Multiclass classification for the three- and four-class data sets is implemented using the one-against-one approach (Knerr et al., 1990).
Accuracy was analyzed using nested cross-validation. Onefold from a randomized, stratified sixfold division of the data was set aside for testing. Optimal hyperparameters (C and γ) were then chosen using grid search cross-validation with eight stratified folds on the training set. Optimization of hyperparameters used the F1 score, the harmonic mean of precision and recall (Powers, 2011). This process was repeated six times with each of the folds being set aside for testing once. The reported accuracy is the mean ± standard deviation of correctly predicted variations.
As the calculated accuracy was stable and did not vary widely for each of the sixfolds after iterative nested cross-validation as tested by the analysis of variance (data not shown), finalized classifiers were generated by the same method used on the training set: grid search cross-validation with eight stratified folds on the entire data set.
2.4. Comparison to PROVEAN and Polyphen-2
For comparison, other impact predictors are based either completely on homology [SIFT (Ng and Henikoff, 2001), MAPP (Stone and Sidow, 2005), and PROVEAN (Choi et al., 2012)], or on both homology and structural information [Polyphen-2 (Ramensky et al., 2002; Adzhubei et al., 2010), SuSPect (Yates et al., 2014), and VarMod (Pappalardo and Wass, 2014)]. VarMod also incorporates protein interaction data from Interactome3D (Mosca et al., 2013). To compare the performance of PTENpred to that of PROVEAN, Polyphen-2, and VarMod, the test set of variations for each of the two-class classifiers was run on each service. Receiver operating characteristic (ROC) curves and the area under the ROC curve were generated using scikit-learn (Pedregosa et al., 2011) and the matplotlib Python-based computer plotting package (Hunter, 2007).
2.5. Resources
The web application is implemented using Python version 2.7.6 on a server running Ubuntu 14.04.2 LTS server edition.
3. Results and Discussion
3.1. PTENpred accuracy
We measured the accuracy of PTENpred using nested sixfold cross-validation for each of the class splits, measuring the average percentage of classes predicted correctly on the test fold (Table 1). Nested cross-validation was iterated, and a one-way ANOVA test was performed to ensure that no statistical difference existed between iterated cross-validation scores.
Values ( ± SD) were estimated by stratified sixfold cross-validation. The classifier was trained on fivefold of data and was used to predict the last fold. Each fold was excluded as testing data once, and this value is the mean of these six accuracy scores.
3.2. Visualization of PTENpred predictions
We performed principal component analysis on our data to project data to a lower dimensional space, keeping only the most significant features. We then trained our classifiers to those decomposed data. We found that only the class splits with two classes (N/ASP and NA/SP) produced classifiers that were consistent with classifiers trained on higher dimensional data, with consistency being tested with iterative nested cross-validation. These classifiers were trained on all of the data and were used to generate contour maps. We then plotted a randomized, stratified 20% of the data so as to visualize PTENpred predictions (Fig. 2). To visualize predictions and accuracy further, we calculated and plotted ROC curves (Fig. 3). These curves were generated by averaging ROC data over six stratified cross-validation folds.
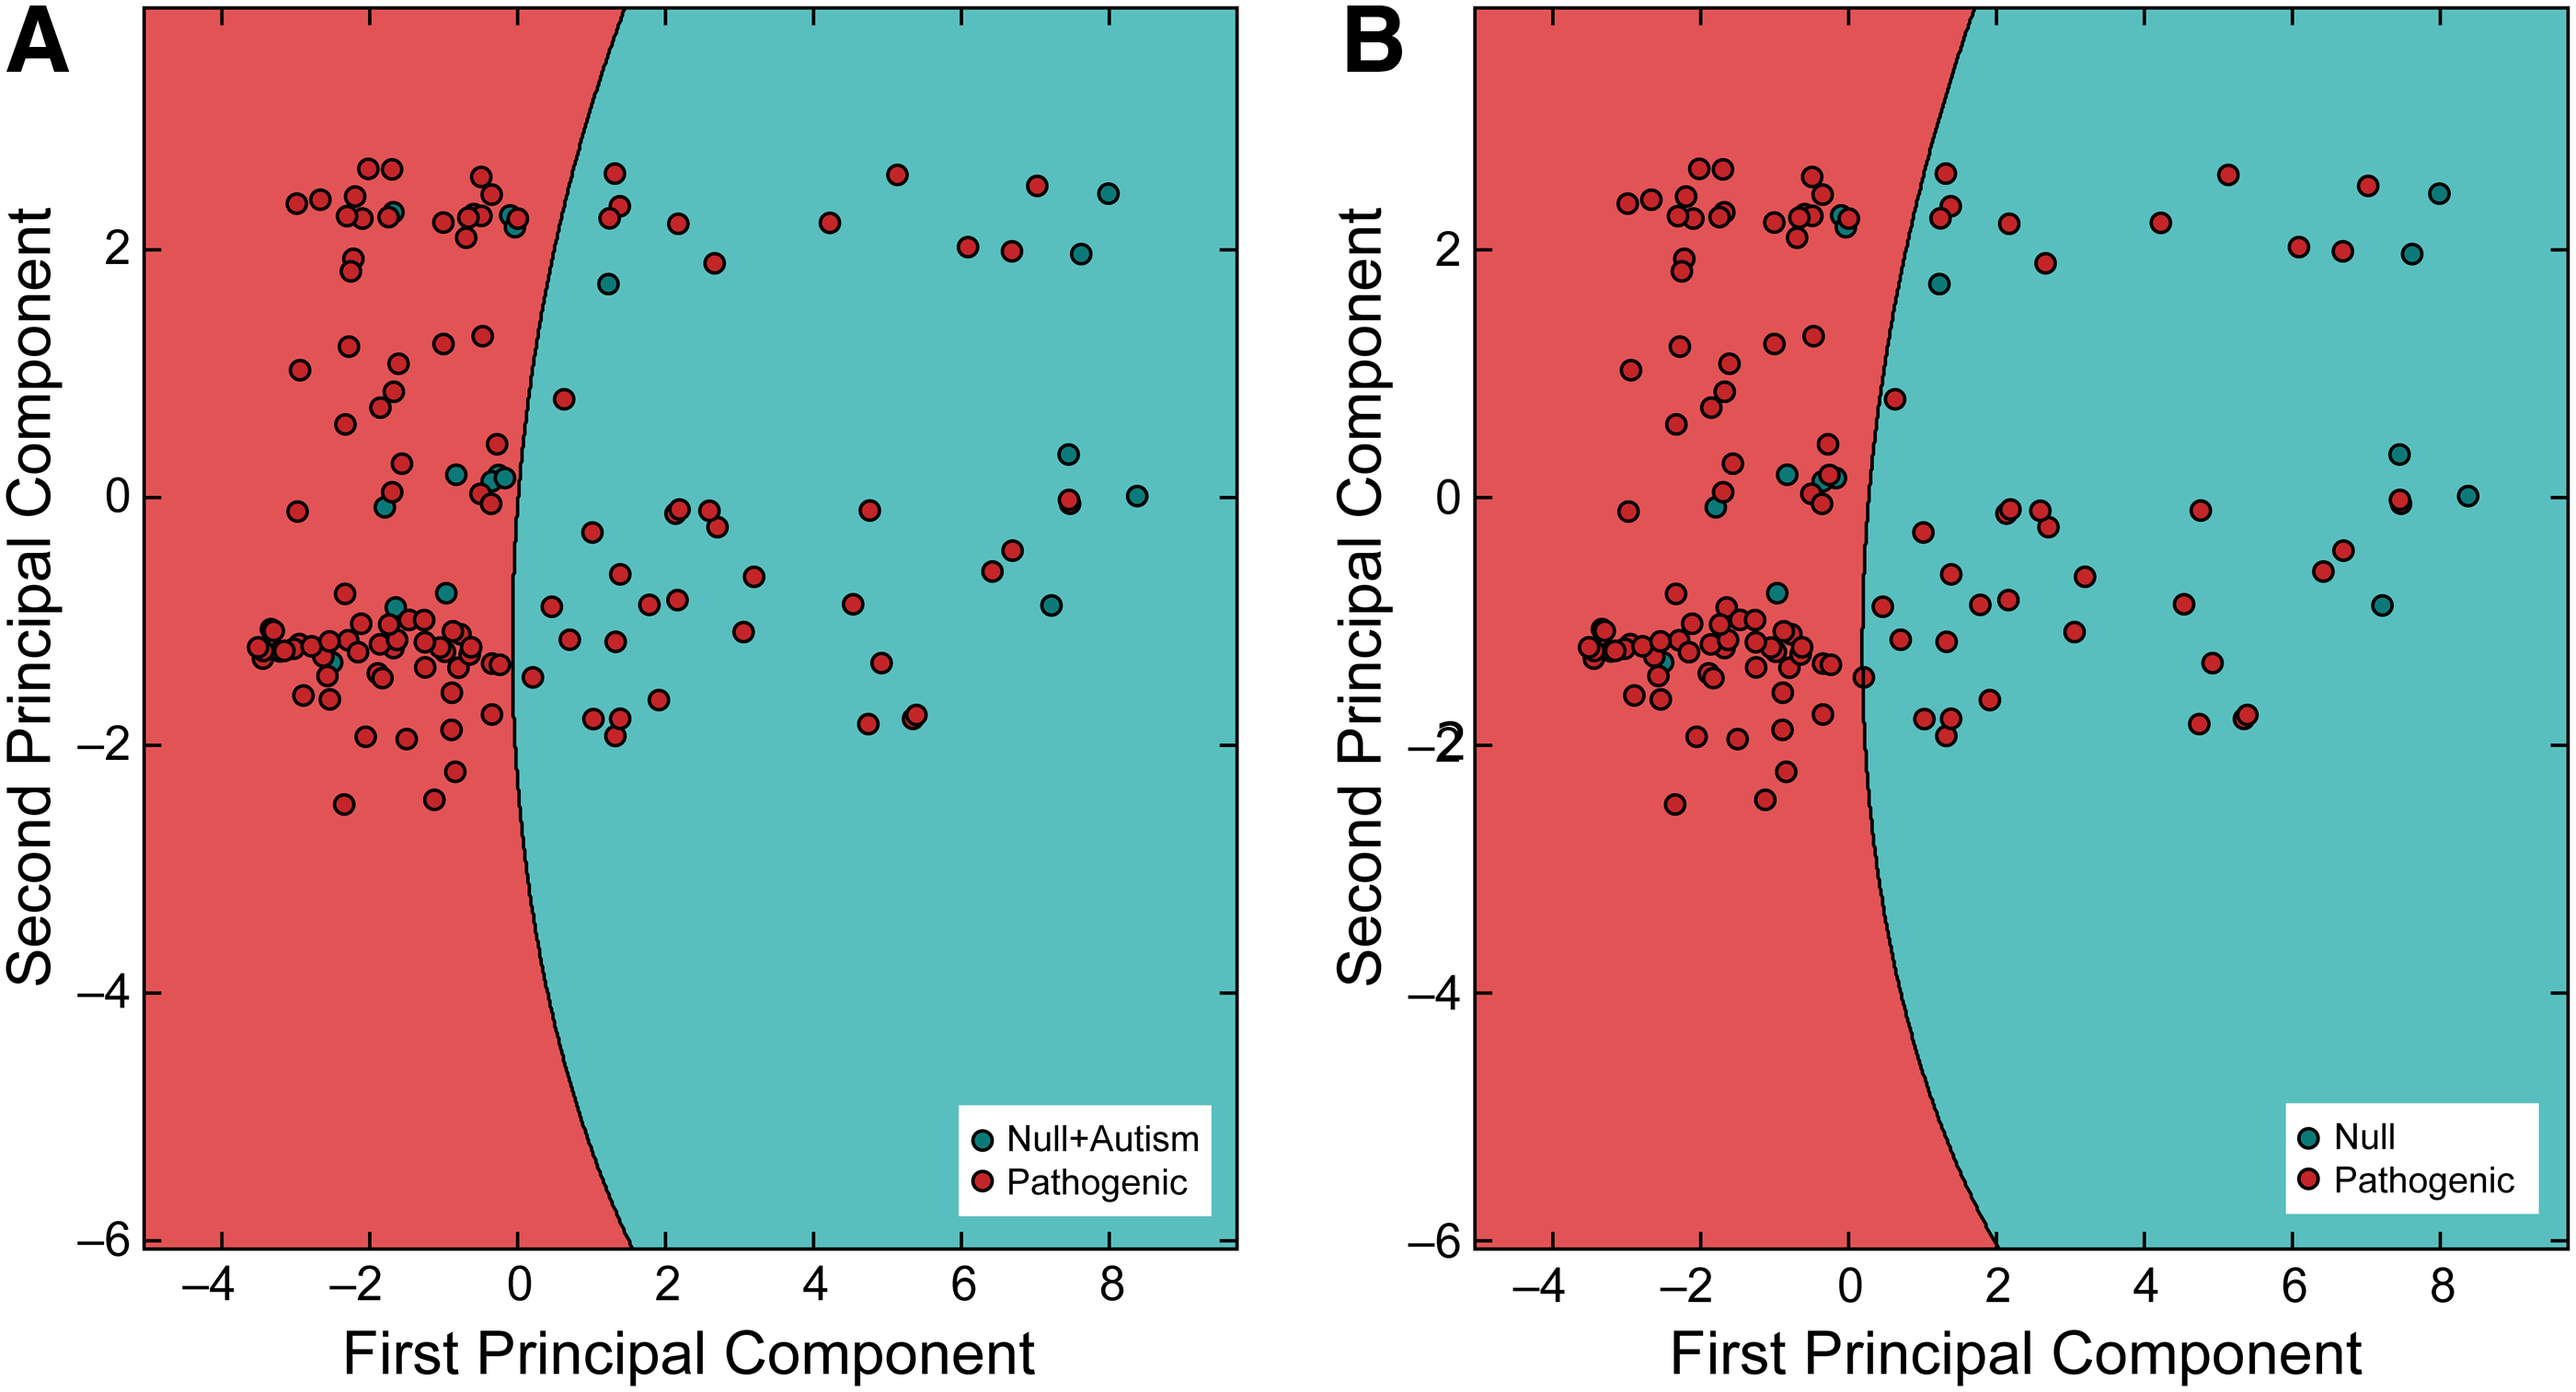
Depiction of predictions of PTENpred projected on two principle components. Using principle component analysis, 22 features from support vectors were projected onto two dimensions. The PTENpred classifier was trained on the entire two-dimensional data set and was used to create the contour areas. A fraction (20%) of the available data was then plotted to visualize correctly and incorrectly predicted residues.
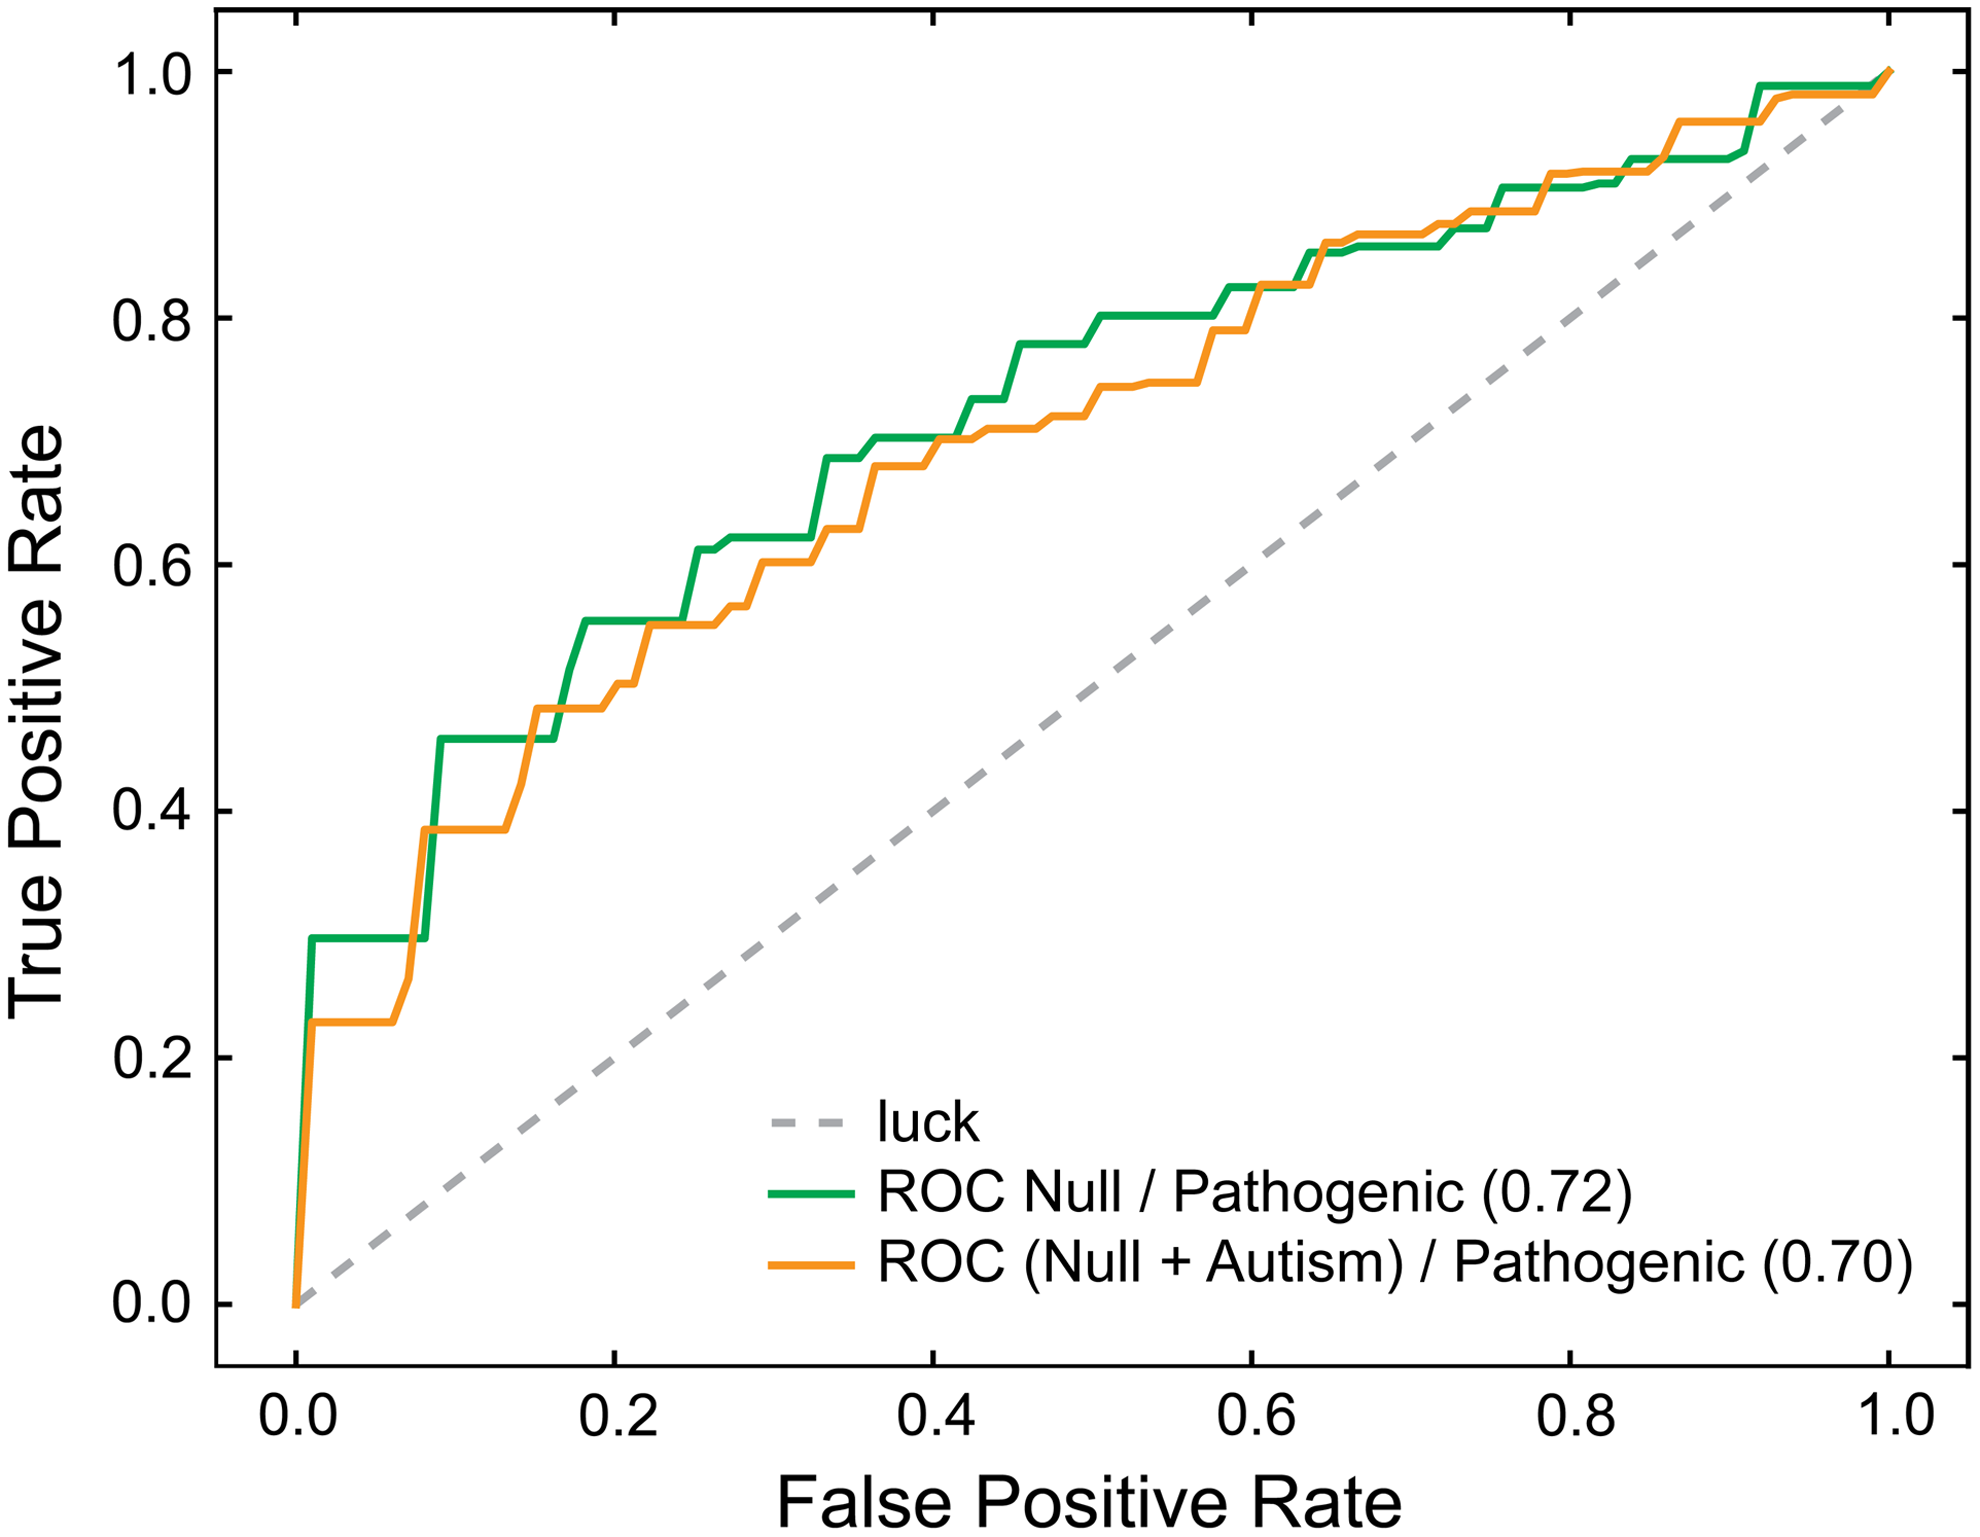
Cross-validated ROC analysis on predictions of PTENpred for binary classifiers. ROC curves were generated with two binary classifiers, N/ASP and NA/SP. Six stratified folds of the data were created, and the classifiers were trained on fivefold. This procedure was performed six times with each fold of data used once as the test set. The resulting ROC curves were averaged to create the depicted mean ROC curves. The area under each ROC curve is indicated within parentheses. ROC, receiver operating characteristic.
3.3. PTENpred performance comparisons
To compare PTENpred performance to currently available protein impact predictors, we calculated ROC curves in the same manner. An ideal point is in the upper left of the resulting plot (Fig. 4). Based on the area under the ROC curve, PTENpred performs better than does Polyphen-2, PROVEAN, or VarMod.
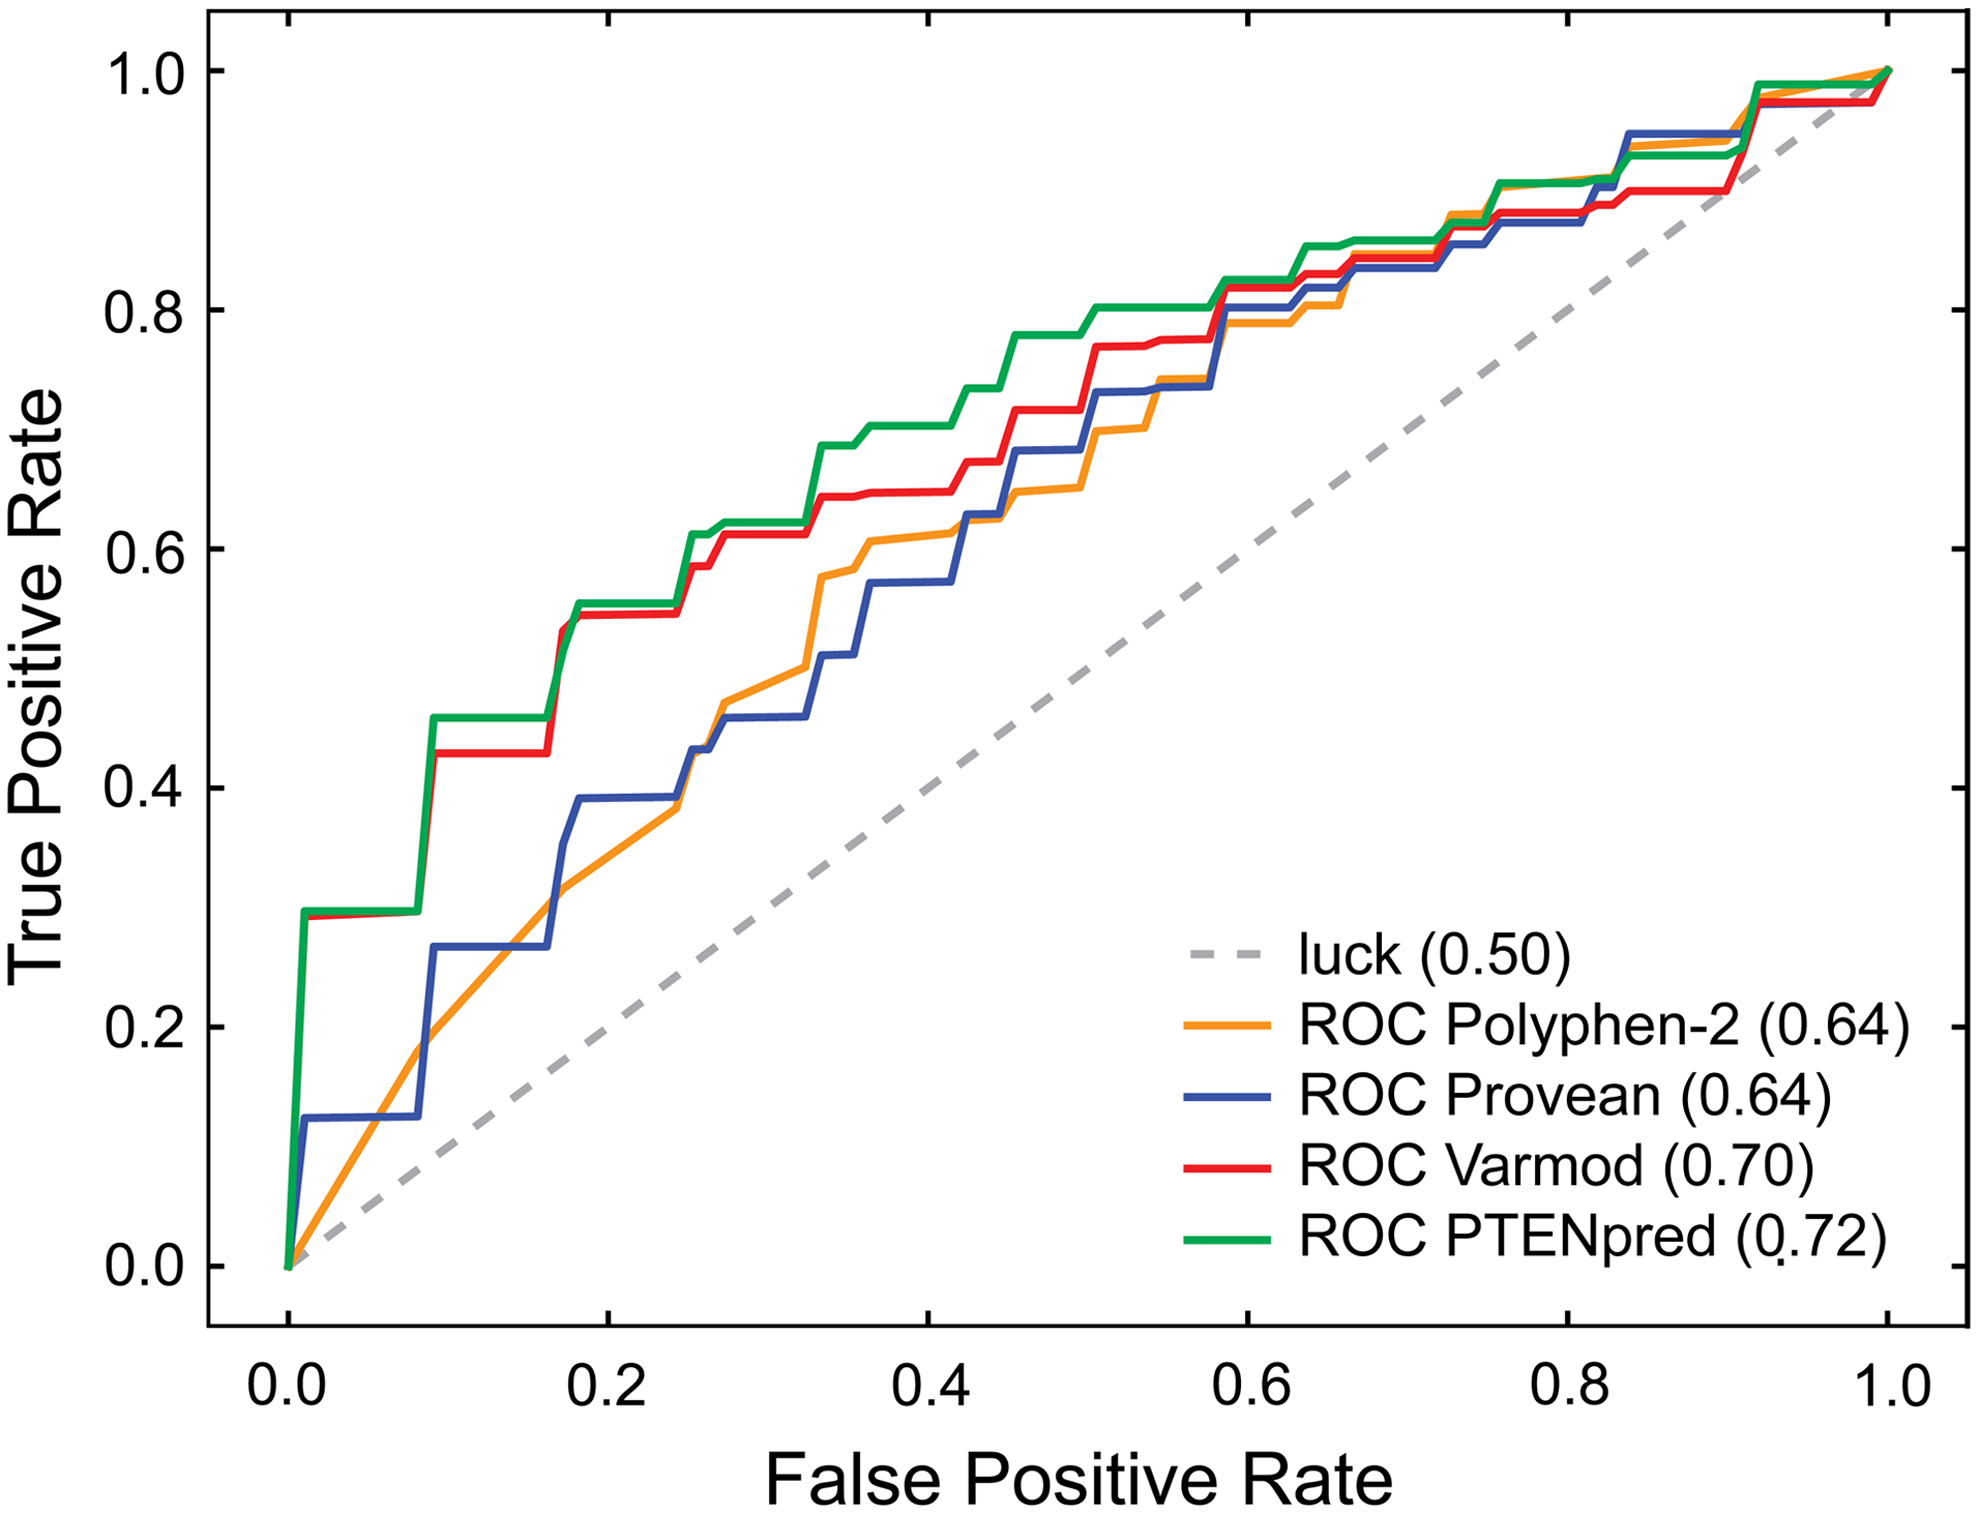
Predictions of PTENpred binary classifier with three other impact predictors. An ROC curve was generated with the binary classifier N/ASP. ROC analysis was also performed for Polyphen-2 (Adzhubei et al., 2010), PROVEAN (Choi et al., 2012), and VarMod (Pappalardo and Wass, 2014). For each method, ROC curves for each fold of data were generated, and these curves were averaged to create the depicted mean ROC plots. The area under each ROC curve is indicated within parentheses.
3.4. Web application
We implemented the PTENpred predictor on a local server in the Department of Biochemistry at the University of Wisconsin–Madison. A user can input a variant of PTEN in the form of, for example, “L70P,” which indicates a change at the 70th codon of PTEN from leucine to proline. A user can also select which of the five classifiers to use to classify the variant (N/ASP, NA/SP, N/A/SP, N/AS/P, or N/A/S/P). The classifier can be accessed online at http://ptenpred.info.tm/index.php. As output, PTENpred gives the predicted class information and also presents a JavaScript-implemented version of Jmol (JSmol) (Hanson et al., 2013) to display the location of the wild-type residue in the query.
4. Conclusions
We introduce the first designer protein impact predictor for nonsynonymous SNPs that is focused on the tumor suppressor PTEN, which is altered in most human cancer patients. PTENpred exceeds in accuracy other protein predictors in accuracy (Fig. 4). Its focus on one protein allows for careful curation of mutations and their correlation with specific disease states and phenotypes. PTENpred can be deployed by clinicians and biologists to elucidate the consequences of any new PTEN variation identified in the laboratory or clinic.
Footnotes
Acknowledgments
We are grateful to Prof. J.C. Mitchell (University of Wisconsin–Madison) for contributive discussions and comments on the manuscript. This work was supported by Grant R01 GM044783 (NIH). S.B.J. was supported by a Dennis Weatherstone Predoctoral Fellowship from Autism Speaks and Molecular Biosciences Training Grant T32 GM007215 (NIH).
Author Disclosure Statement
No competing financial interests exist.
References
Supplementary Material
Please find the following supplemental material available below.
For Open Access articles published under a Creative Commons License, all supplemental material carries the same license as the article it is associated with.
For non-Open Access articles published, all supplemental material carries a non-exclusive license, and permission requests for re-use of supplemental material or any part of supplemental material shall be sent directly to the copyright owner as specified in the copyright notice associated with the article.
