
Abstract
Abstract
Interactions among biological entities contain more information than purely the similarities between the entities. For example, interactions between genes, and gene products, can be more informative than the sequence similarities of the genes involved. However, the study of biological networks and their evolution in particular is still in its infancy. Simplified theoretical models of the development of biological networks from a starting state exist, but the problem of finding a distance between existing biological networks, with an unknown history, has seen less research. Metrics for network distance can also be used to measure the fit between theoretically derived networks and their real-world counterpart. In this article, we present a useful model of biological network distance and demonstrate an implementation using simulated gene regulatory networks. We compared our method with existing methods for network alignment and showed that we are much better able to identify evolutionary changes in biological networks. In particular, we can recover the evolutionary trees that describe the relationship between these networks.
1. Introduction
T
1.1. Biological networks
Gene regulatory networks (GRNs) are primary molecular networks in systems biology (Huang, 2004). New technology, such as RNA-Seq, has led to rapidly increasing resolution and coverage that are allowing new insights into the richness of transcription networks (Marguerat and Bähler, 2010). The scale of the data now available introduces its own challenges to efficient analysis (McKenna et al., 2010). Developing new, efficient approaches to generating networks from expression data are the focus of many studies (Zou and Conzen, 2005; Steggles et al., 2007; Bumgarner and Yeung, 2009; Lopes et al., 2011; Shih and Parthasarathy, 2012; Rolland et al., 2014).
Protein–protein interaction networks (PINs) are another important biological network with a close relationship with GRNs. The interaction between genes in a GRN is generally through the interaction of the proteins they produce, these interactions are undirected, unlike GRNs, simplifying their study. For this reason, PINs are used as a surrogate for the more complex GRNs. PINs are also simpler to discover experimentally, although limited by false negatives (Stellberger et al., 2010) and false positives (Brückner et al., 2009; Cusick et al., 2009).
Mapping biological networks grants a much richer understanding of the functioning of an organism. A greater understanding of these networks may even allow us to differentiate the changes that define a new species. Already the similarity of interactions between related genes has been used to indicate the evolutionary distance between organisms (Berg and Lässig, 2006; Arabidopsis Interactome Mapping Consortium, 2011).
1.2. Biological network distance measures
DNA/RNA sequence similarity is used as a surrogate for species similarity and can be a precise measure of mutational distance within a single gene. When similarity is determined between the sequences of many genes, it becomes a surrogate measure for network distance. The sequence similarity is not an exact measure for gene function, that is, whether the gene network has changed, but does accurately capture changes due to mutation at the genetic level. Protein sequence has also been used, which is not sensitive to silent DNA mutations. However, it is still possible to make small changes to a protein sequence without affecting its structure. To deal with this, measures that compare the tertiary structures directly have been developed (Terrapon et al., 2014) and will continue to improve as our understanding of protein structure improves.
The gap between these low-level measures of similarity and high-level measures of overall species similarity has narrowed, but there are still significant discrepancies, for example, a single base change in DNA sequence may render a gene nonfunctional—a significant mutation for the organism despite the minor change to sequence. A measure of mutation that considers the effect on the organism is essential for measuring the effective distance between species. Mutations that do not affect an organism's ability to function as a member of the species are less important to a measure of species distance than mutations that do affect it.
Several approaches have been developed in the pattern recognition, machine vision, and molecular modeling fields to measure the distance between arbitrary graphs. These can be classified as edit distance based (Bunke, 1997; Cross et al., 1997) or alignment based (Read and Corneil, 1977; Bunke and Shearer, 1998; Clark and Kalita, 2014; Radu and Charleston, 2014). Edit distance approaches find a sequence of edits that convert one graph to another. Alignment-based approaches focus on finding the best mapping of vertices and edges from one graph to the other. In biological terms, this latter approach maps proteins to ones that are functionally similar, that is, those that have similar interaction profiles. Accuracy may be enhanced if other attributes are known, for example, a time series of graphs has the same vertices, but varying edges (Gao et al., 2009). Homologous genes in GRNs have been identified in many species that could be used as an initial alignment between networks.
Edit distance-based measures have a clear affinity for biological networks, where mutations induce “edits” to the underlying graphs. If the genes the vertices represent are known to be homologous, then any edits are simple to determine. However, it is more often the case that genes are dissimilar enough that homology is uncertain, or there are multiple possible homologues.
A problem with these measures is the handling of gene duplications. In the worst case of a whole genome duplication, for example, Blanc and Wolfe (2004), Kellis et al. (2004), Taylor et al. (2003), graph alignment measures show very low similarity, as the number of edges quadruples, before any subsequent neofunctionalization, nonfunctionalization, or subfunctionalization (Conrad and Antonarakis, 2007). Edit distance-based measures need many edits to add each new vertex and their corresponding edges in such cases; a method that identifies duplications of sets of nodes as a single event would clearly be of benefit. Sequence similarity measures accurately identify recently duplicated genes, but do not address the effect on network structure. Duplications are usually smaller than the whole genome, but the distance estimates these measures provide are still not in proportion to the single mutation involved.
1.3. Biological network edit distance
In this work, we introduce a new method to effectively estimate the distance between biological networks in terms of the number of mutations, including duplications, needed to produce them. We call our method “Biological Network Edit Distance” (bNED).
The implementation uses graph alignment heuristics to determine the interactions present in both networks. Series of mutations (edits) to the initial network, or mutation paths, are generated, and then, the networks produced by these paths are compared to the destination network. The best paths are kept and used as seeds in a new iteration of the path extension step. This is repeated until acceptable paths are found. We describe the method in more detail in the Methods section and verify its performance on known, simulated data in the Results section.
2. Methods
Figure 1 demonstrates a series of mutations to change a simple network into another; a single duplication and node insertion adds two new nodes and five new edges. These simple steps model the evolution of the network as functionally relevant mutations occur. However, given only the endpoints, the exact mutations that were involved cannot be determined. For example, the duplication step could be replaced by inserting a node, and in each missing edge, a different node could be duplicated and more edges added or removed, and so on. As the network size grows, the number of possible paths grows exponentially.

Mutation path between networks. A sample ancestor network is changed into a descendant network by inserting two mutations.
In this section, we first define the mutations we use to model the network changes. We then describe an implementation of a method to find the shortest mutation path.
2.1. Network mutation measures
We consider five types of mutation affecting the network: adding or removing a gene, adding or removing an interaction, and gene duplication. The first four mutations are trivially reversible, but duplications of multiple genes are not generally reversible without a series of mutations. Gene removal represents mutations that remove all identified interactions of that gene, or delete a gene entirely. Gene addition represents a mutation that adds novel interactions to a previously “inert” gene, or insertion of a new gene, either de novo or from an external source. Duplication (Fig. 1) could be regarded as a combination of gene and interaction additions, but it is important to include as a single event, as it is both a relatively common phenomenon and more likely than the series of individual mutations (Conrad and Antonarakis, 2007). Combinations of the mutations can be used to emulate simpler models of network growth. Duplication divergence, for example, can be achieved with a combination of duplication and edge deletions.
In contrast to the distance between two related genes in terms of DNA mutations, which is symmetric, the distance between two related networks need not be symmetric. Under the assumption that the alignments between networks are correct, then we can think of this distance as a quasimetric.
2.2. Implementation
Estimating Shortest Mutation Path
2.2.1. Estimating shortest mutation path
Three approaches are possible for finding mutation paths: exhaustive searches, likelihood estimation, and greedy heuristics. The potential search spaces for exhaustive searches and likelihood estimation are exponentially large. Greedy searches are fast, efficient, and easily trapped in the many local minima. Greedy searches that could be guaranteed to approximate the solution are ideal, but suitable algorithms are yet to be identified. In this work, we use a genetic algorithm to approximate an exhaustive search, greatly improving efficiency in exchange for reduced accuracy.
As described in Algorithm 1, at each iteration, a randomly chosen mutation is added to the path. The cost of the new path is compared to the previous in a manner similar to a branch and bound search. Lower cost paths are accepted, while higher cost paths may be accepted with a probability based on the ratio of path costs. This allows for the discovery of a series of individually poor mutations that together produce an acceptable result. Cost is calculated as the sum of mutation costs, normalized by graph size, plus a misalignment cost calculated using the count of unmatched edges divided by the total number of edges, that is, 1-Edge Correctness (Kuchaiev et al., 2010).
There will be multiple paths of mutations that change the origin into the destination, with varying lengths. For example, every duplication can be replicated, for a higher cost, by a series of node and edge additions. Nodes with no identifying attributes and identical topology can also be involved in equivalent paths. As the paths are extended, some will reach the destination graph, while others will reach a point where all possible mutations only worsen the fitness score.
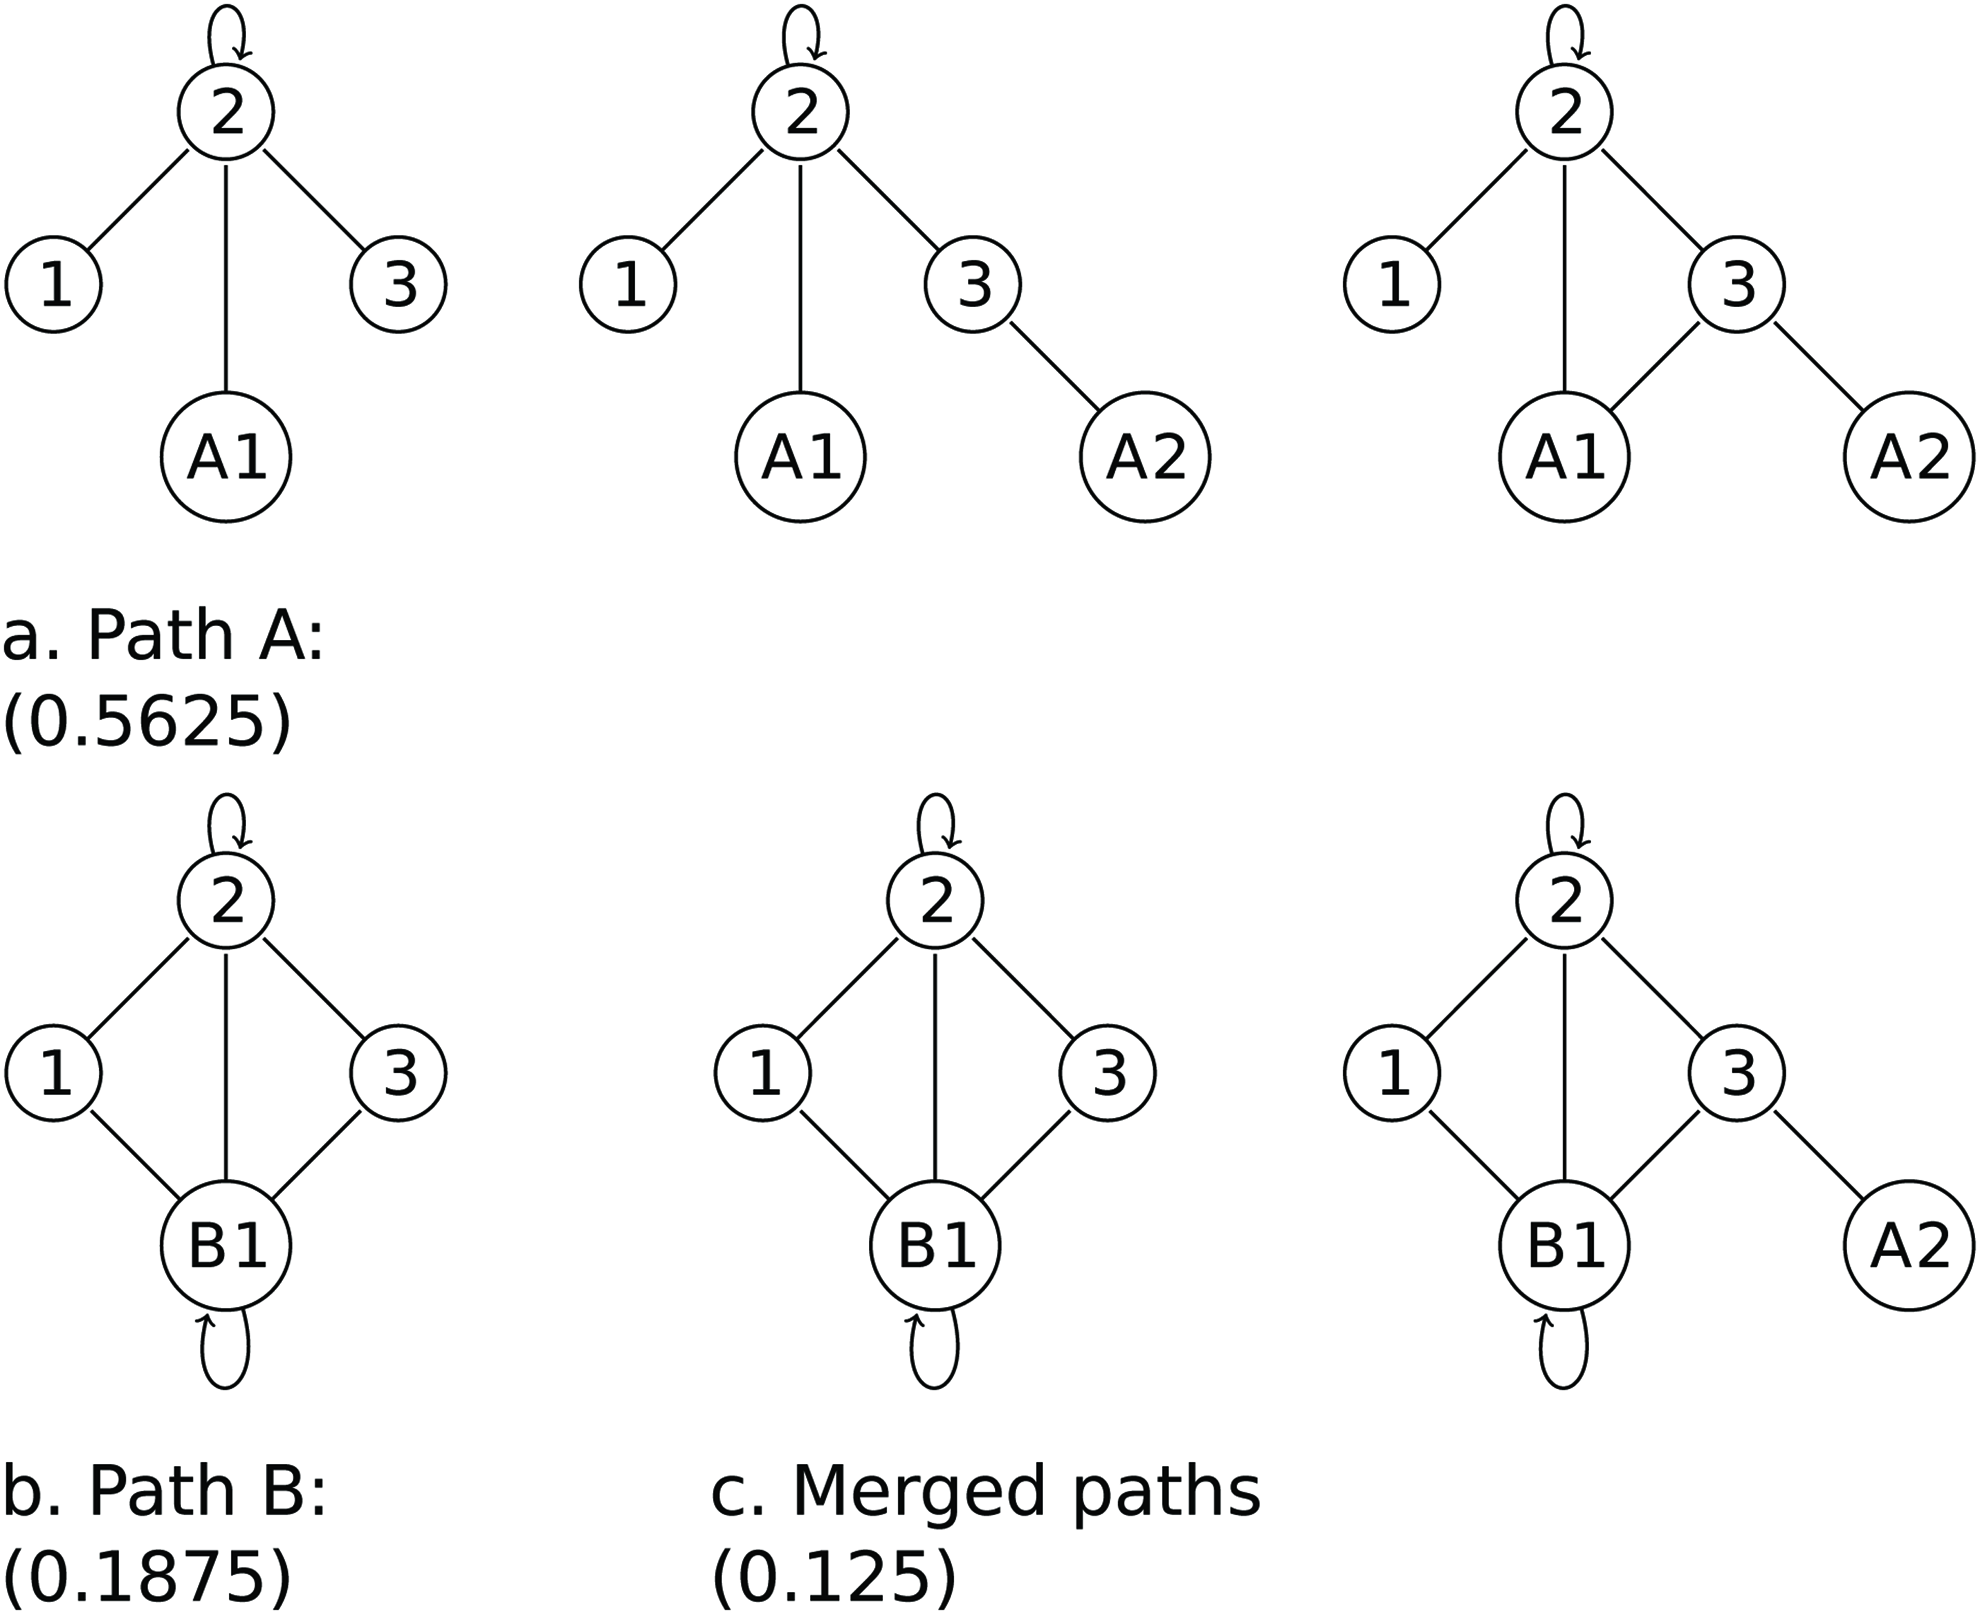
Within each generation, multiple attempts are made in parallel to find paths. Seeds for the next generation are generated by merging a selection from the best paths found. Paths are chosen for merging with a probability based on their individual fitness. An example is shown in Figures 2 and 3.
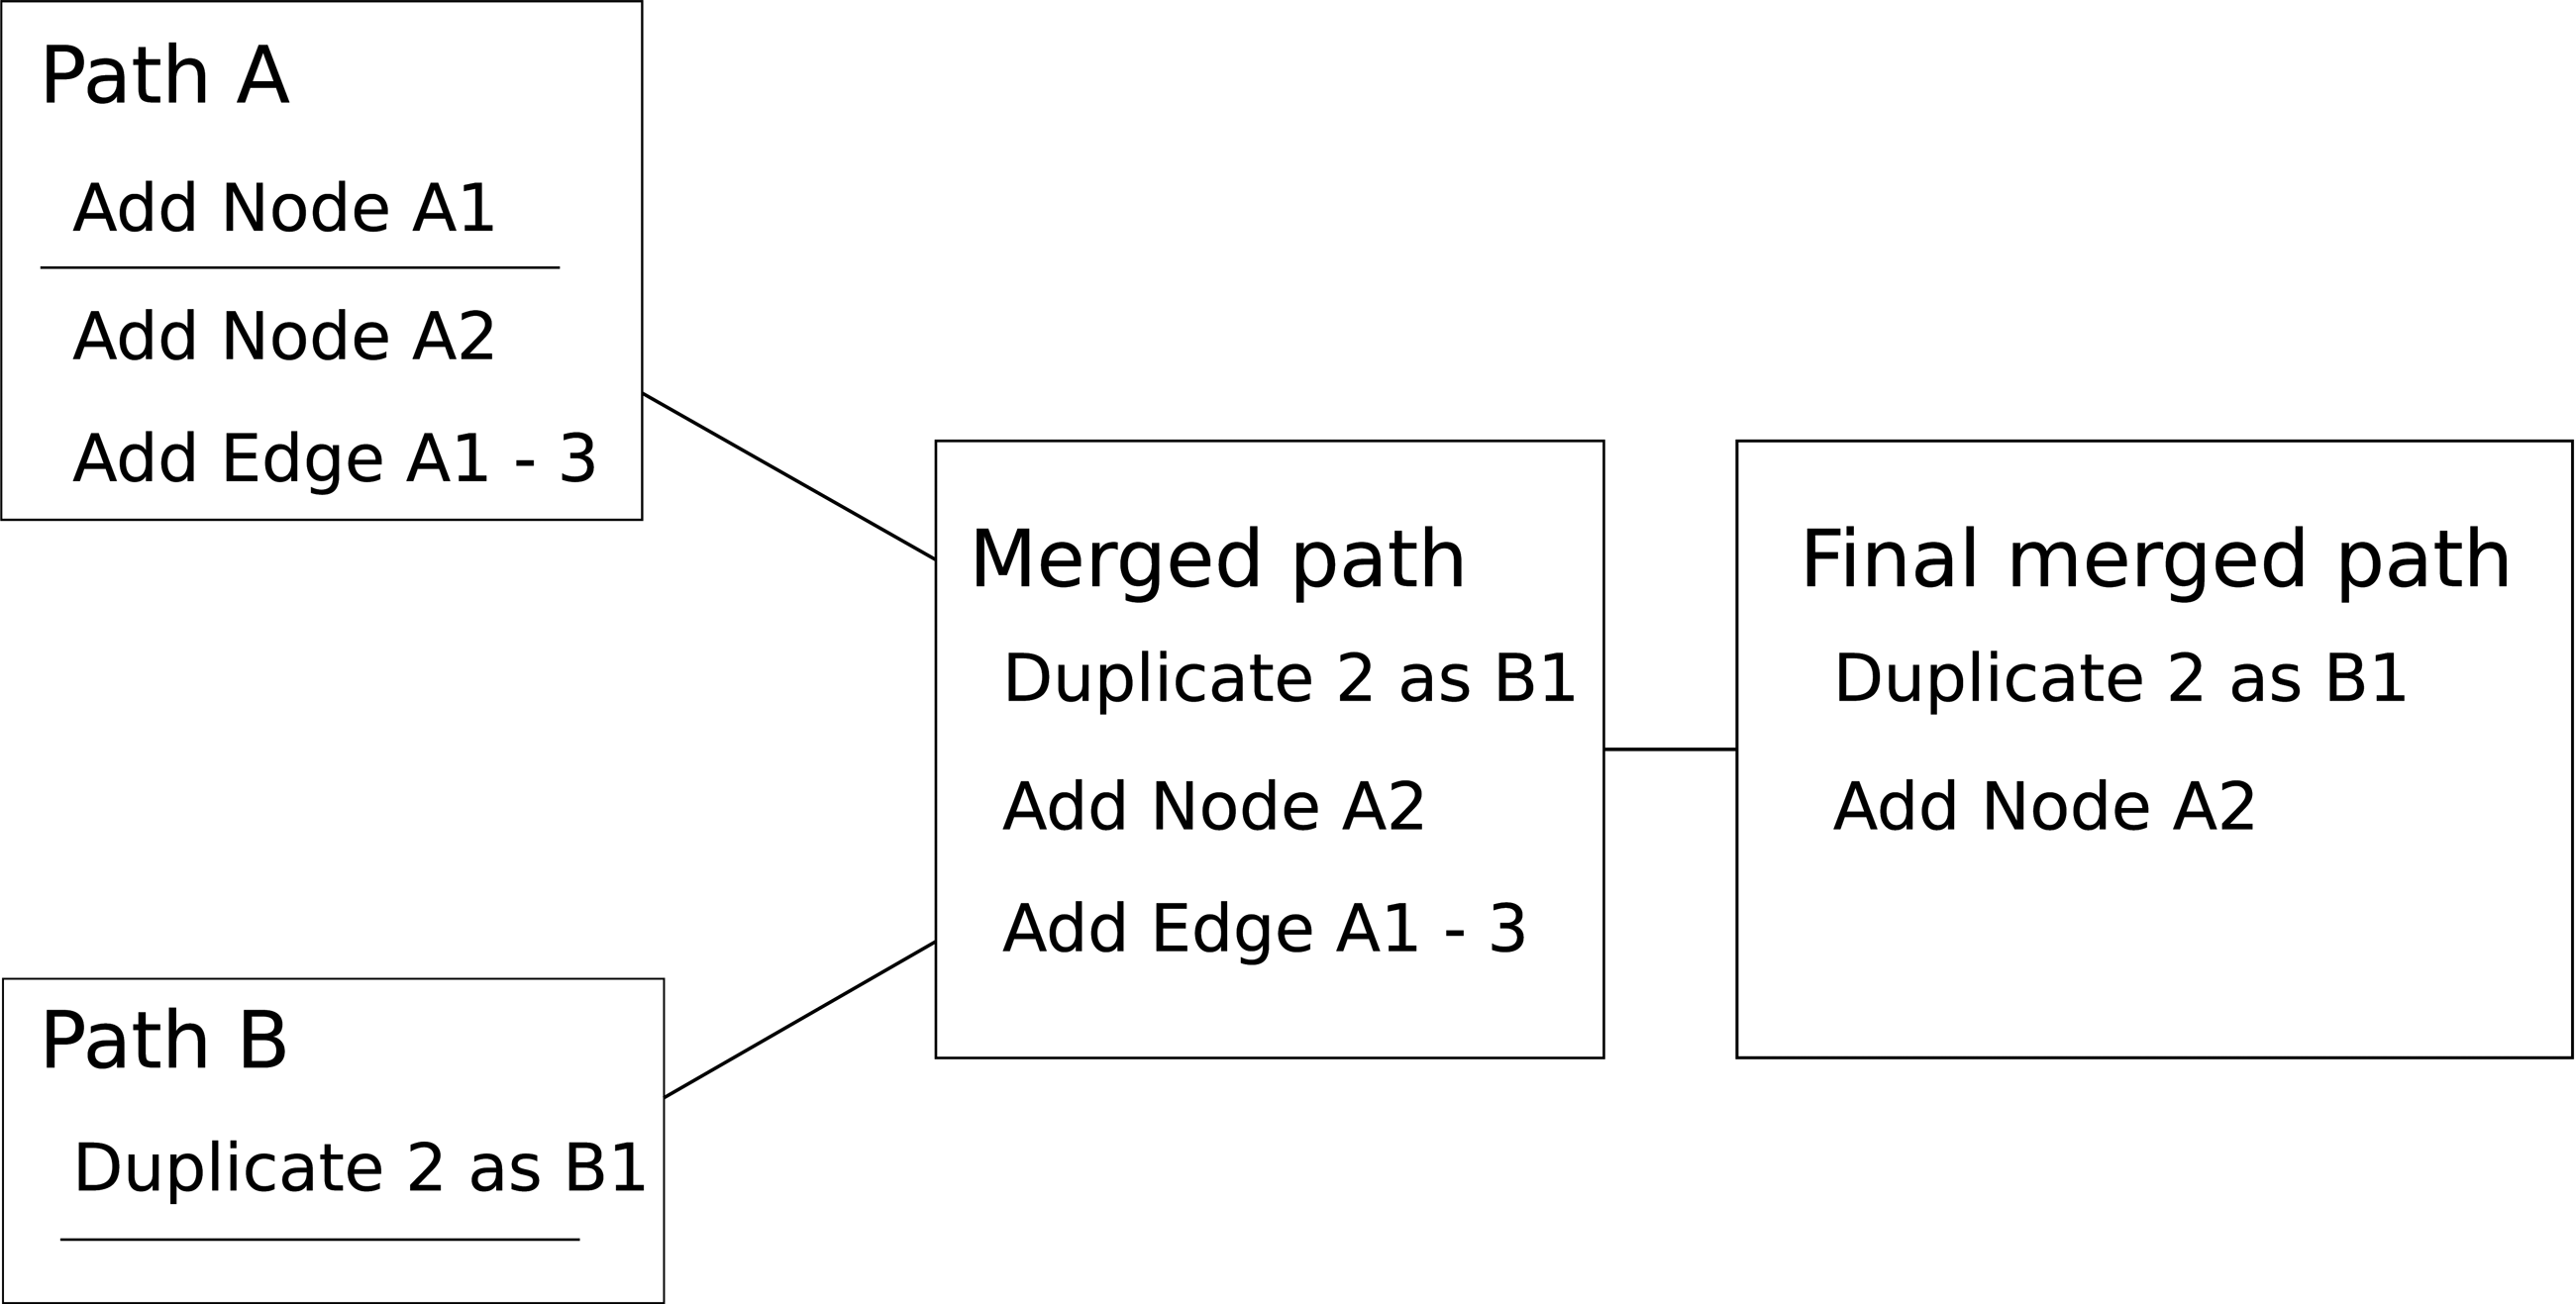
Merging mutation paths. The genetic algorithm used merges paths of mutations by selecting a start section from one path and end section from another and then removes references to missing sections. Using the Ancestor and Descendant graphs of Figure 1, Path A inserts node A1, inserts node A2, and then links A1 to 2. Path B duplicates 2 as B1. The paths are merged and invalid mutations removed. In this example, “Add Edge A1-3” was discarded.
2.2.2. Ancestral networks or maximum common subgraph discovery
The regulatory networks that we compare are rarely as convenient as an ancestral network and a mutated descendant network. Instead, the two networks will be descendants of an unknown ancestral network. Thus, finding a direct path between the two known networks will not accurately model their development. We can approximate the ancestral network by identifying the shortest pair of paths between the two existing networks and some unknown ancestor. However, the increased complexity of this is substantial as we are combining two exponential search spaces, with unbounded potential size. Given that we are searching for the shortest path, in practice an upper bound can be established by using the maximum common subgraph as the ancestor.
2.3. Simulated network data generation
Simulated networks were generated using the Gene Network Virtual Laboratory (GNLab) software package (Ho and Charleston, 2008). Default probabilities were used for all mutations excepting deletions. Deletions were removed as a filter to ensure that the initial networks were complete. Mutations to the networks were generated by choosing a random series of mutations up to a chosen limit. Mutation paths with insertion/deletion cycles, for example, of matching insertions and deletions, were discarded.
bNED was then used to find path lengths between the original and mutated networks. One hundred twenty-eight parallel runs were used for 40 generations each.
2.4. Simulated phylogenies
When multiple networks are present, a useful distance measure should be able to estimate the relative relationships. Biological networks typically evolve in a tree structure with ancestors and descendants—the phylogenetic tree of networks. The distance to a direct ancestor or descendant should be less than the distance to a less direct ancestor or descendant. Whether or not a network distance measure can resolve the phylogenetic signal is a practical test of the utility of the measure.
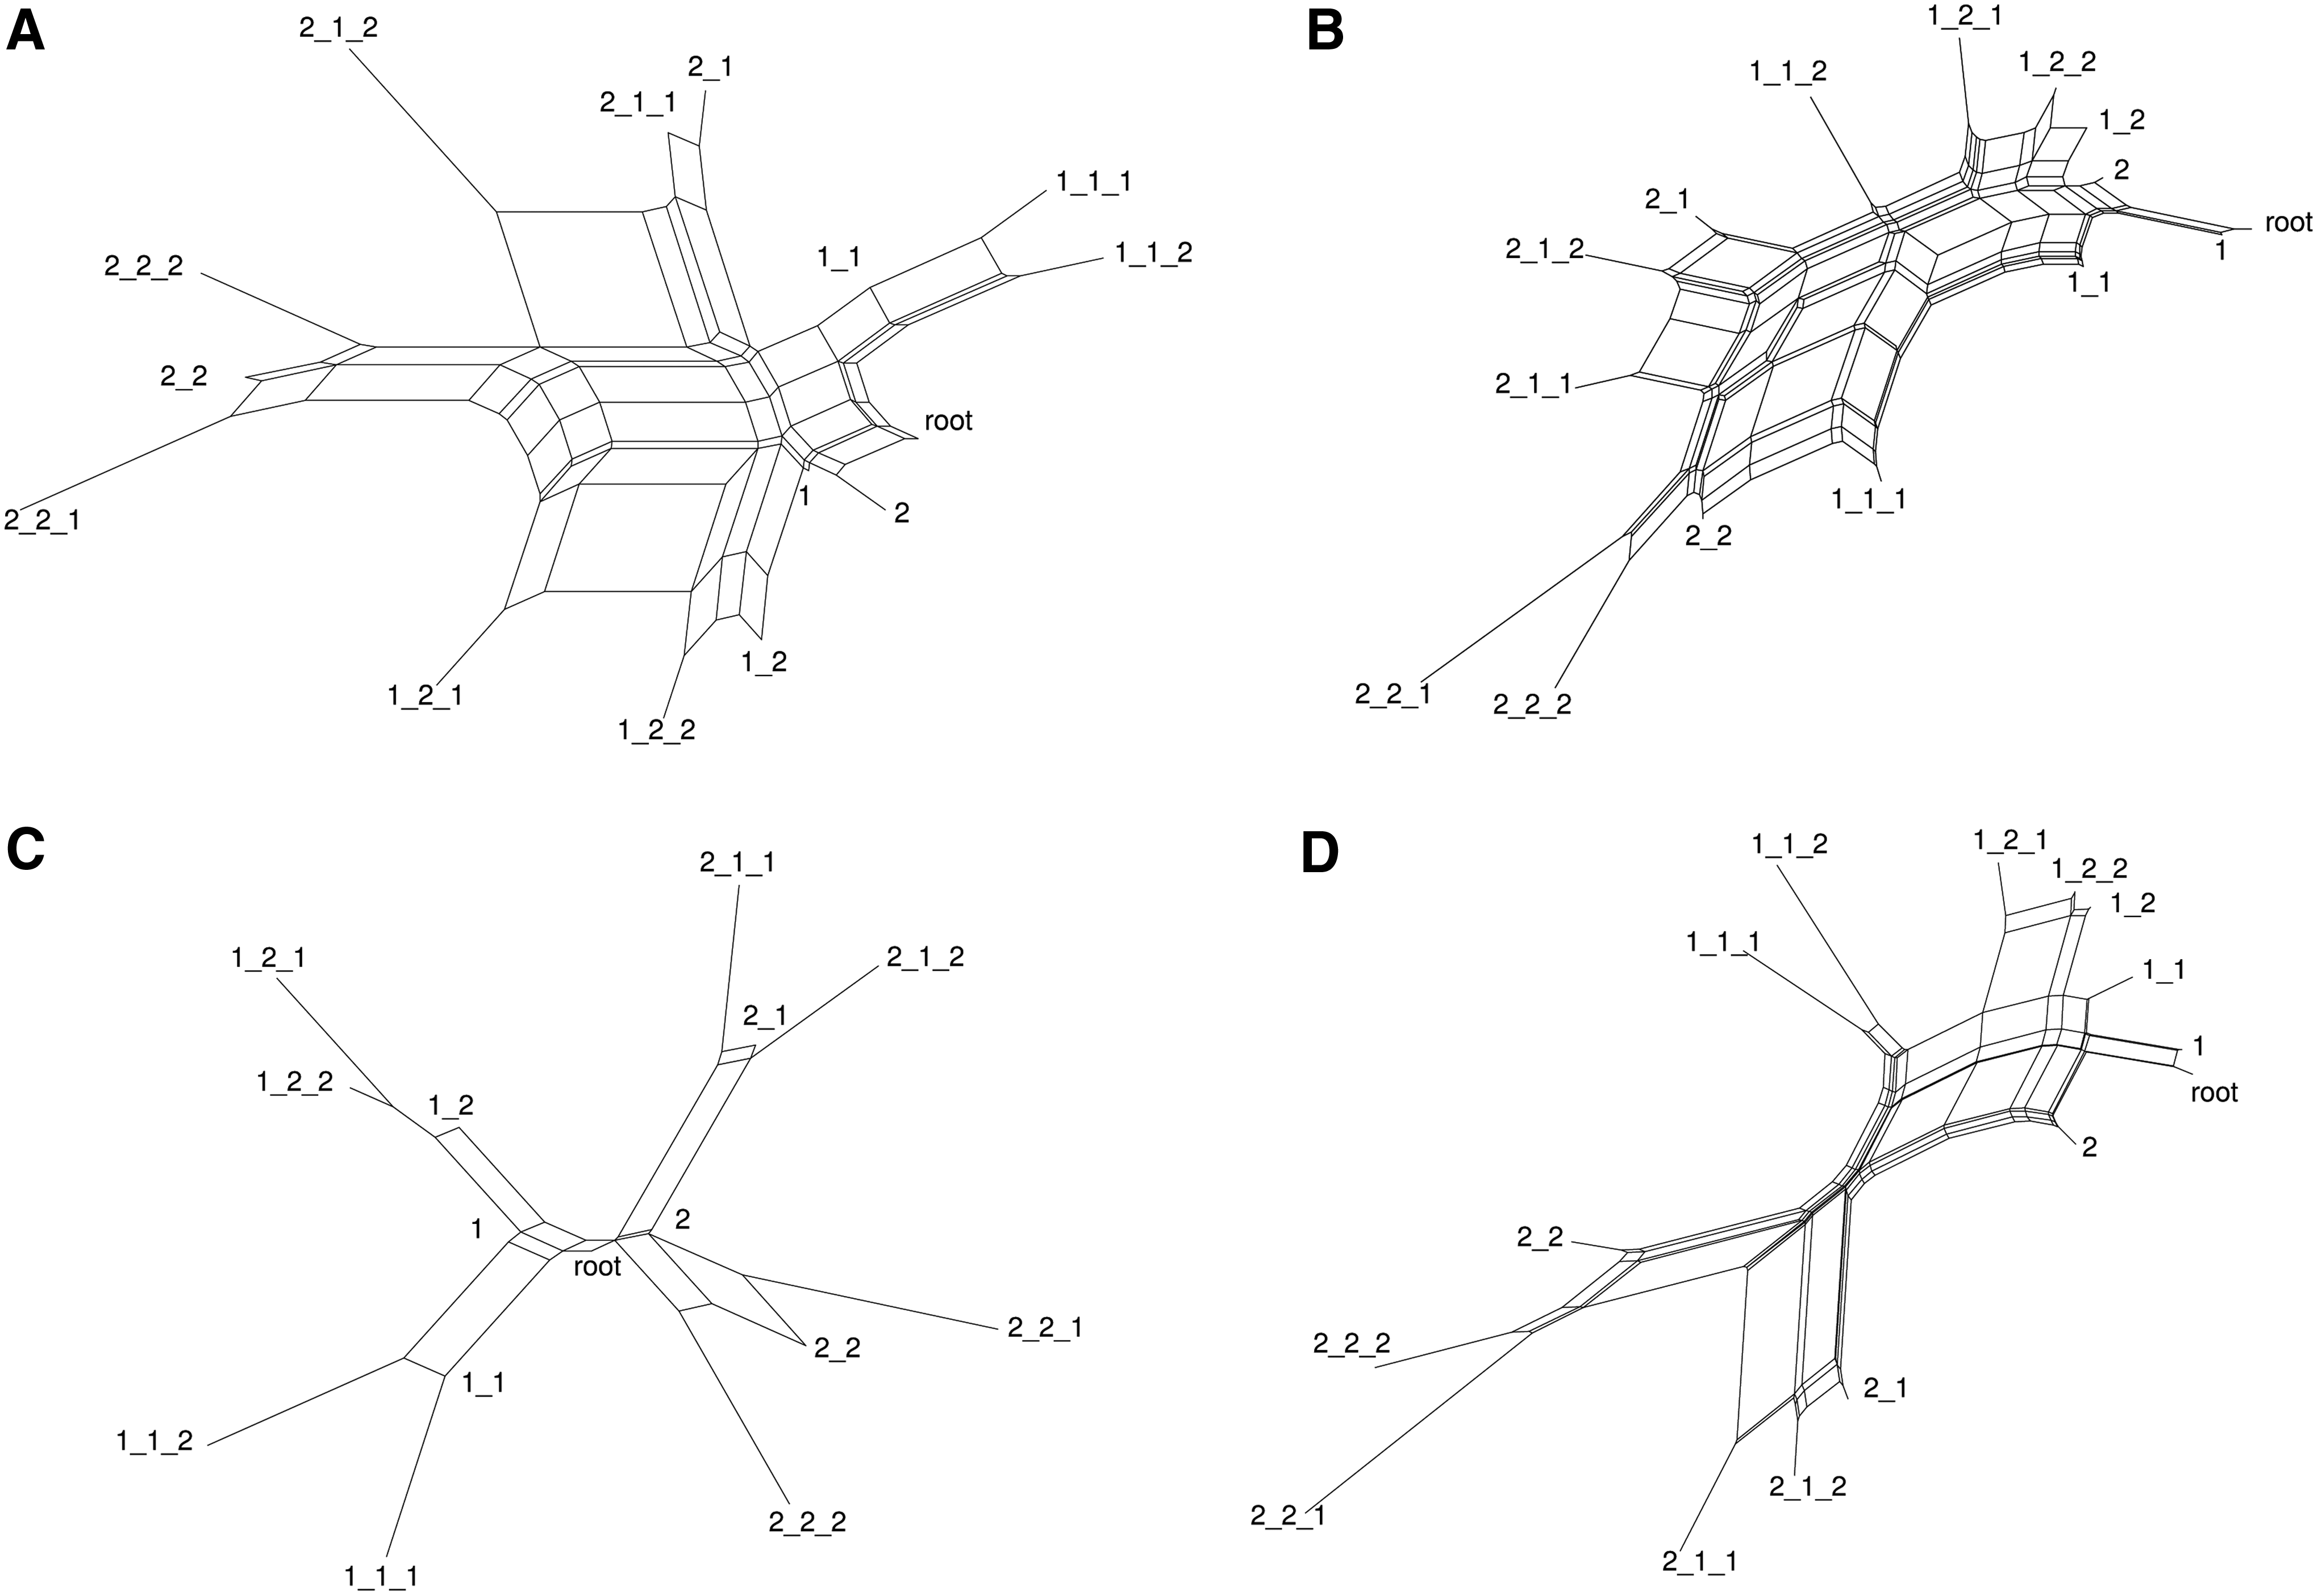
GNLab was used to generate graphs consisting of 40 vertices as ancestral networks. Forty vertices were chosen as the smallest size having sufficient graph structure for alignment tools to be effective. This is comparable to the sizes of viral PINs. A phylogenetic tree was created over three generations, as in Figure 4, producing 15 networks in total. Pairwise distances between each network were estimated using both graph alignment and bNED. The phylogenetic signal was found using SplitsTree (Huson and Bryant, 2006).

Simulated binary phylogenetic tree. A generated network was modified to produce multiple descendant networks by inserting mutations. Each descendant is one mutation different from its parent.
The distance estimation was performed with and without known node attributes, with a duplication-only model, and again for all mutations. Duplication only was included as duplications are a common model used in studies of biological network development.
2.4.1. Experimental setup
The experiments were run on a system with 32 Hyperthreaded Intel Xeon CPU E5-4620 CPUs running at 2.20 GHz, with 512GB of main memory. With 64 threads, the implementation of the model used 20MB of memory with all CPU cores at 100%. CPU speed was clearly the main performance constraint.
Running time for graphs of size 50 with 10 mutations (resulting in a destination network of sizes from 60 to 70 nodes) was roughly 1 hour for 80 iterations on 64 parallel threads.
3. Results
3.1. Simulated networks
Figure 5 shows the average length at each generation for a graph with 10 mutations. The fitness score improved rapidly for the first 20 generations with only minor improvements after the 80th generation. The path length varied around the known correct value, but approached that value as generation count increased.
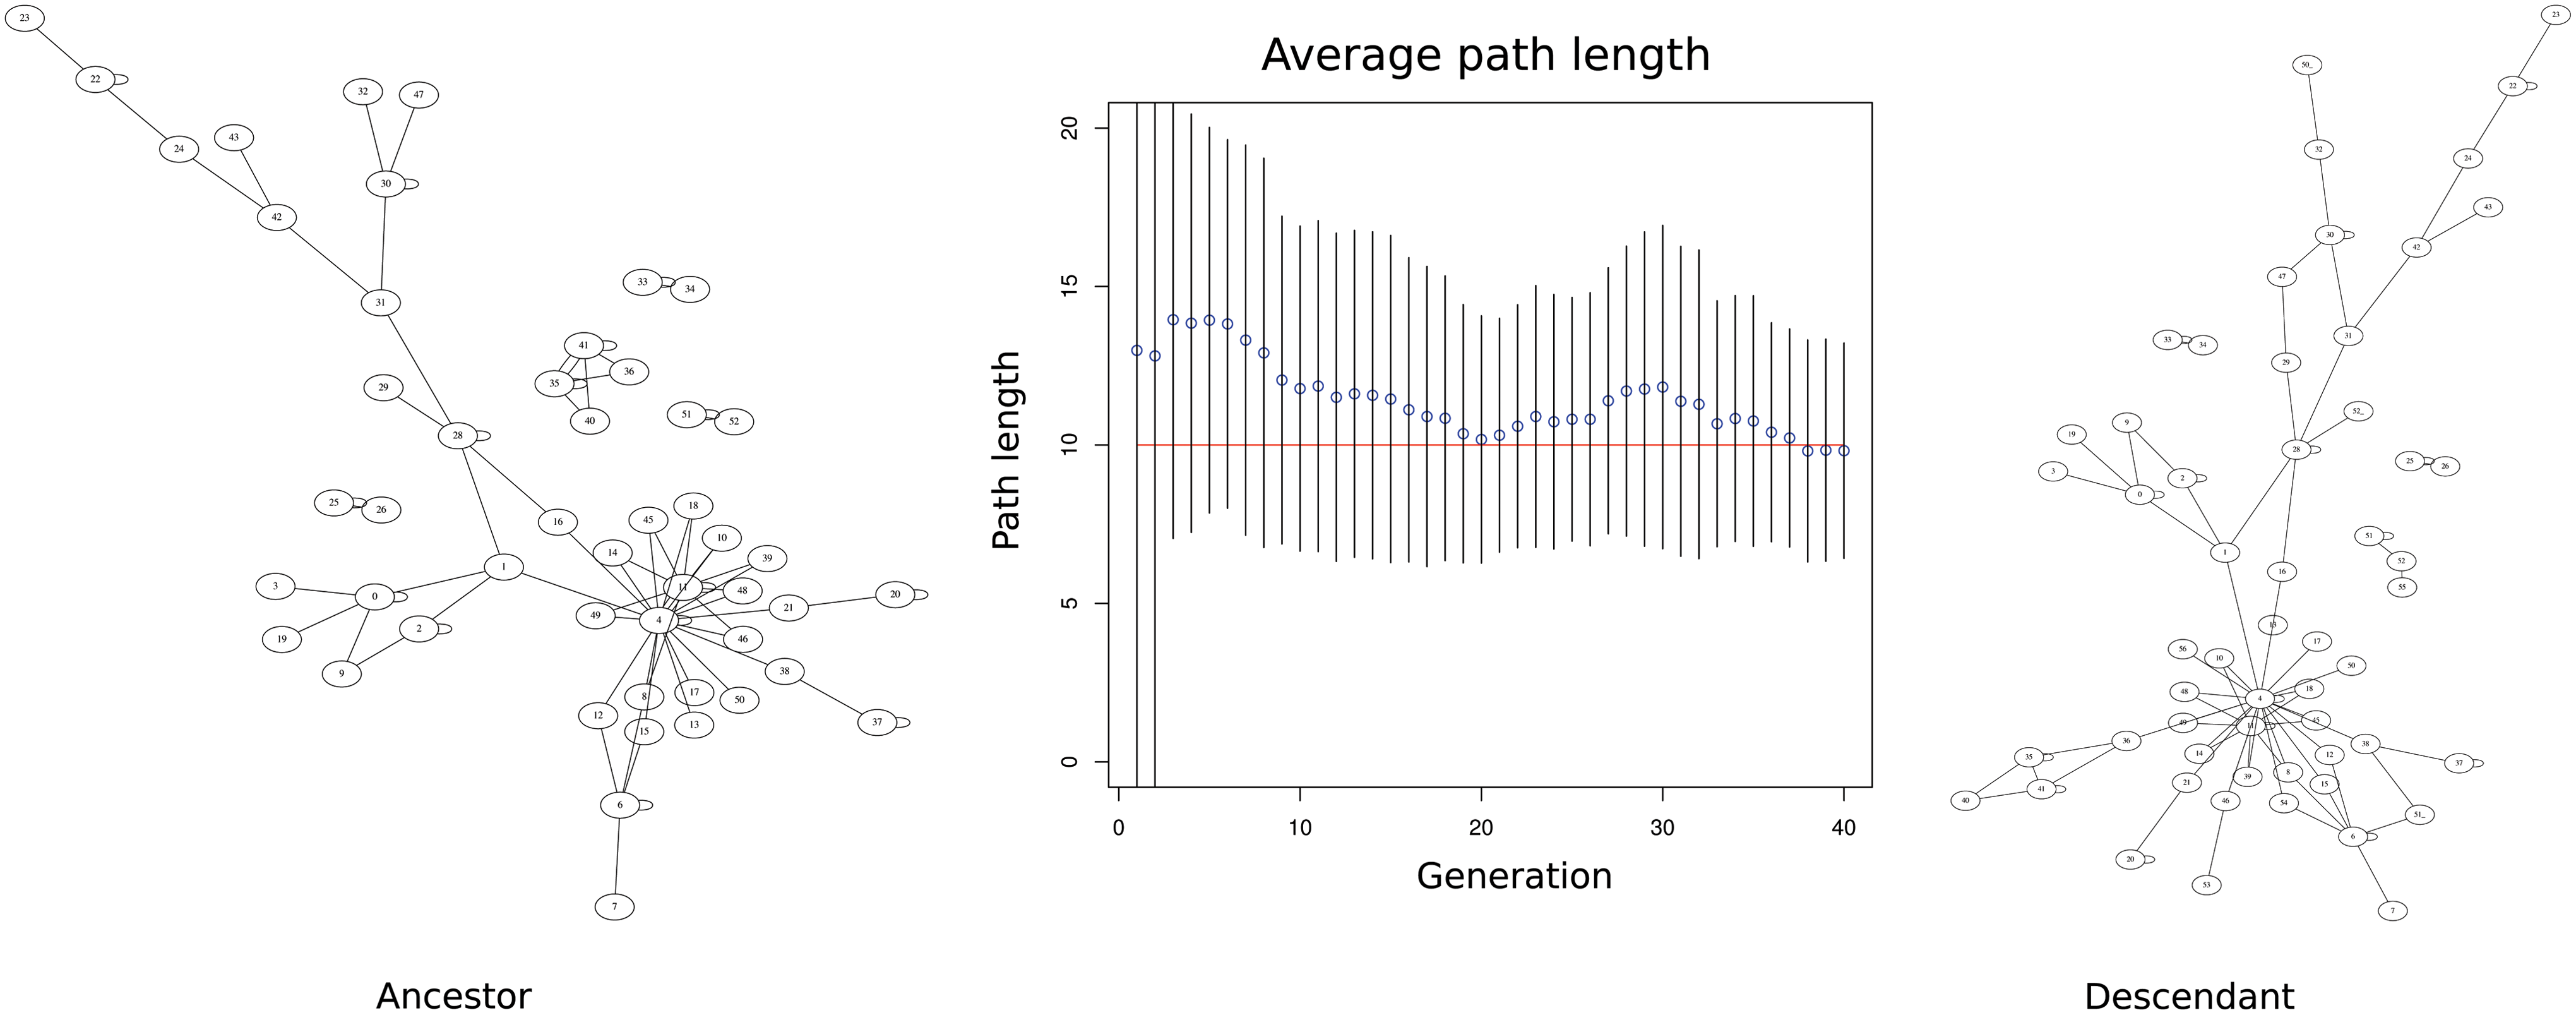
Average bNED path lengths for each generation. Ten mutations were inserted into graphs consisting of 50 vertices generated by GNLab. Two hundred simultaneous paths were used in each generation. The mean and standard deviation of the best paths found are shown for each generation. The mean rapidly approached the inserted path length, while standard deviation also decreased, but at a slower rate. bNED, Biological Network Edit Distance; GNLab, Gene Network Virtual Laboratory.
The path length was found to approximate the number of mutations inserted (Fig. 6a). Analysis of the mutations composing the paths showed that the mutations used were the same as those inserted, or were topologically equivalent. As the inserted path length increased, the quality of the path found decreased. This agrees with the expectation that increasing path length increases both the search space and number of alternatives near optimal paths. The nature of the mutations inserted also affected the quality of the path found. Duplications of multiple vertices are easier to find as the corresponding set of vertex/edge additions is greatly more expensive.

A graph of 50 vertices was generated with GNLab. The graph was modified by inserting one mutation at a time. At each step, the distance between original and modified graph was measured.
Network alignment is a useful measure of the similarity of network topologies. As such, we used alignment as a base to compare with bNED. The raw ED score after alignment was used as a measure of similarity. The simulated networks used in the bNED test were aligned and scored. Figure 6b shows the results of this analysis. While an increasing dissimilarity between the networks was observed as more mutations were introduced, the ED score soon approaches that found between random networks (Radu and Charleston, 2014), for networks that bNED can still estimate distance for.
3.2. Simulated phylogenies
Results for the duplication model are shown in Figure 7. Results for the full model are shown in Figure 8. Each network in the SplitsTree figure is labeled with the corresponding mutation.
SplitsTree analysis of estimated distances in a duplication model. A graph of 40 vertices was generated with GNLab. Duplication mutations were inserted to generate a binary phylogenetic tree consisting of 15 graphs. Pairwise distances were estimated using both bNED and Node Fingerprinting, using node attributes or using topology alone. The distances were then used by SplitsTree to represent the phylogenetic signal using neighbor-net (Huson and Bryant, 2006). Graphs
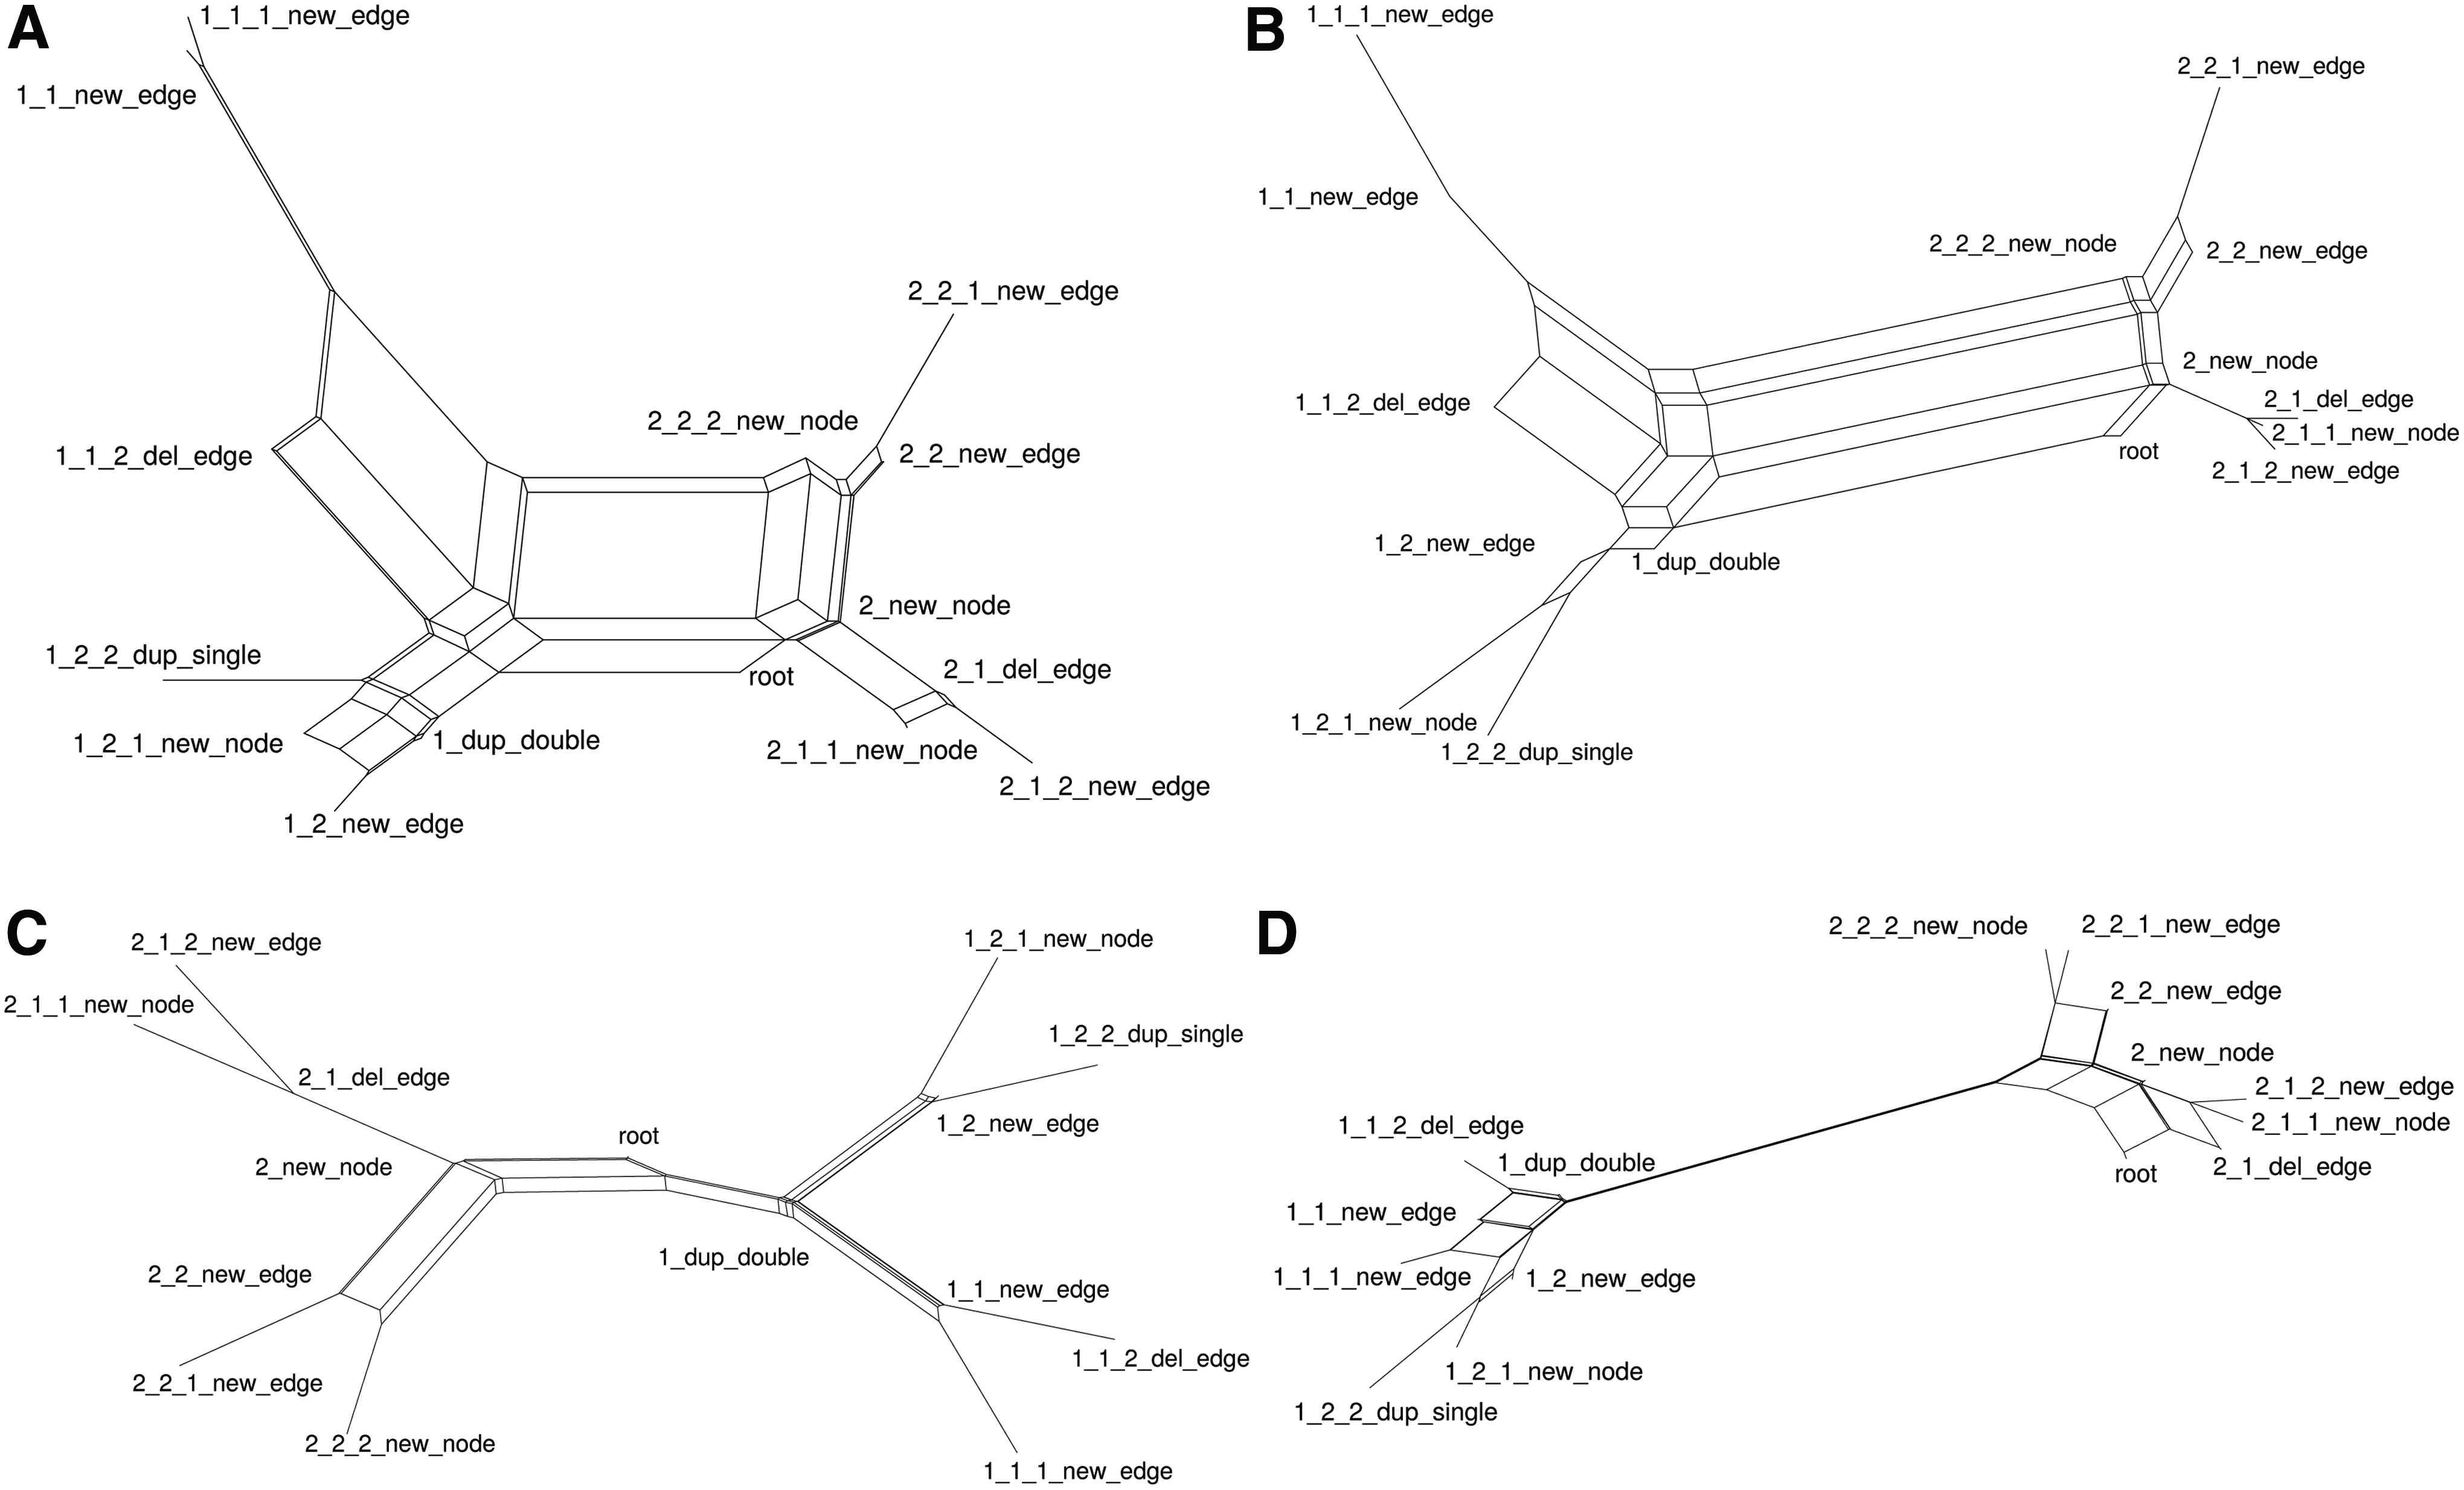
SplitsTree analysis of estimated distances in a full mutation model. A graph of 40 vertices was generated with GNLab. Mutations chosen randomly from all five possible mutations were inserted to generate a binary phylogenetic tree consisting of 15 graphs. Pairwise distances were estimated using both bNED and Node Fingerprinting, using node attributes, or using topology alone. The distances were then used by SplitsTree to represent the phylogenetic signal using neighbor-net (Huson and Bryant, 2006). Graphs
The availability of vertex attributes to greatly improved distance estimates. The graph alignment-based measure produces ideal alignments with a labeled graph, since the only subgraphs that are not known must be the result of mutation. The distance is still overestimated if duplications occur, resulting in poor estimates of the original tree. bNED estimates were nearly ideal with labeled graphs. For the pure duplication model, discrepancies between the estimated distances and actual distances were due to the discovery of shorter paths, for example, a sequence of two unrelated single vertex duplications can be reproduced with a single duplication of two vertices.
4. Discussion
The structure of a biological network is determined by the functional relationships of the proteins, and thus, it can be used as a surrogate for protein function. This observation was the basis for the development of our method to estimate the mutations needed to change one biological network into another. With this, we can complement sequence similarity to determine how closely related two biological networks are. By using newly developed tools for aligning biological networks, independent of homology, as a starting point for our method, we can estimate how close two biological networks are in terms of their evolutionary development.
Accurate distance estimates in terms of mutations can be found using our approach. Accuracy is highest when vertex attributes are present, but even with only topology to guide the search, reasonable estimates were found. Labeling vertices based on gene similarity is clearly a useful technique when investigating interaction, but caution is needed as incorrect mappings can drastically alter graph topology, hampering distance estimates. Currently available data are limited by the high error rate and the greater coverage of more intensively researched species.
The phylogenetic networks generated clearly demonstrate the difficulties that graph alignment techniques face when dealing with duplications. In the worst case of a whole network duplication, an ideal graph alignment will still find a difference of 50%, despite the single mutation needed. Conversely, the addition of a single connected vertex is identified as a single change. However, correct graph alignment cannot be assured as even the addition of a single edge to a sparsely connected subgraph can significantly change local topology, increasing the likelihood of incorrect alignment.
Finding an optimal solution may be hindered by alignment errors. Without a perfect network alignment, common for imperfectly understood biological networks, errors in alignment can be more problematic than local optima. The path found is not strictly between the networks of interest, but between the networks plus the alignment error. However, alignment errors diminish in severity as network size increases—larger networks provide more information to determine the optimal alignment. Biological networks have core regulatory components that are both conserved and high degree. In contrast to the more general problem of graph alignment, the structure of biological networks promotes a unique core network for an alignment algorithm to build from. Core biological pathways are also likely to have known genes in common, both improving the alignment quality and reducing the search complexity.
5. Conclusion
The model we have developed provides a simple but powerful representation of the forces affecting mutation at the network level in a biological system. The method shown finds useful, near optimal, paths using common biological mutations and finds these paths in feasibly small time frames. Knowledge of the relationships between network components improved accuracy, but topological information was sufficient to find useful estimates of network distance.
Tools to estimate the distance between biological networks are important to our understanding of biology. They allow us to better understand both the relationships between organisms and the function of novel genes and pathways. The methodology presented is a useful tool to enable this analysis and forms a positive step forward in our understanding of the evolution of systems.
Footnotes
Acknowledgment
This work was supported by an Australian Postgraduate Award to Martin McGrane.
Author Disclosure Statement
No competing financial interests exist.